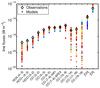
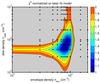
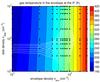
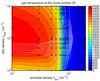
Fig. 5
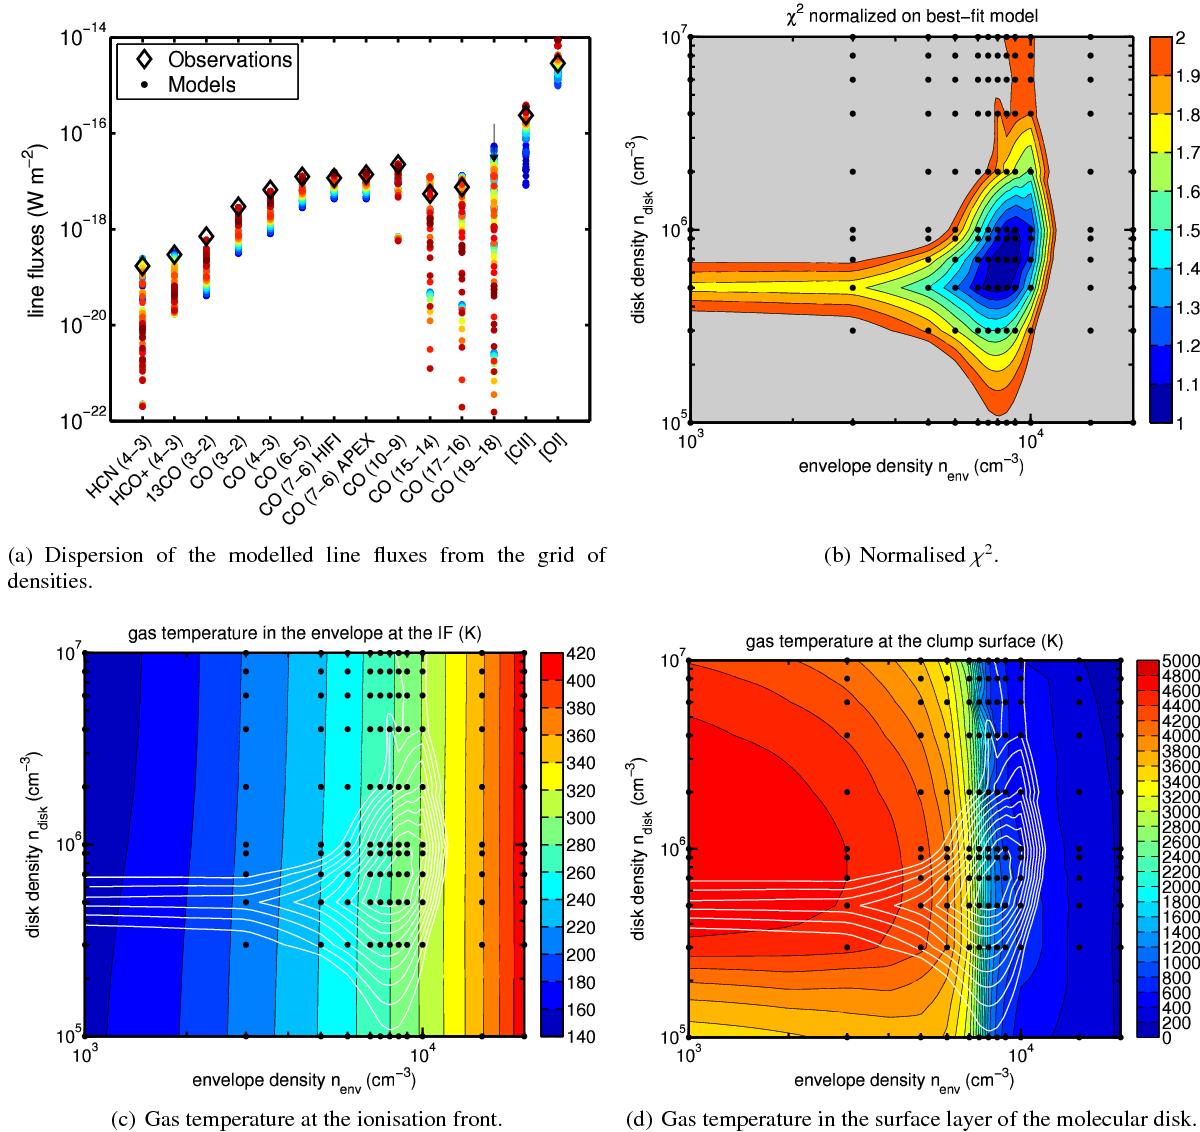
a) Modelled lines fluxes (105-600) for the considered density ranges (colored points) compared to observations (black diamonds). Uncertainties of observations are not plotted because they are smaller than the marker. b) χ2 comparing observed line integrated intensities of 105-600 and modelled values for the considered envelope and disk densities. c) Temperature at the ionisation front, overlaid are the χ2 contours. d) Temperature at the disk surface. In panels b, c, d, points are the positions where the models are calculated and the colors and contours result from interpolating the model results over these points.
Current usage metrics show cumulative count of Article Views (full-text article views including HTML views, PDF and ePub downloads, according to the available data) and Abstracts Views on Vision4Press platform.
Data correspond to usage on the plateform after 2015. The current usage metrics is available 48-96 hours after online publication and is updated daily on week days.
Initial download of the metrics may take a while.