Free Access
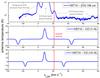
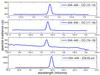
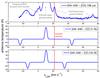
Fig. 2
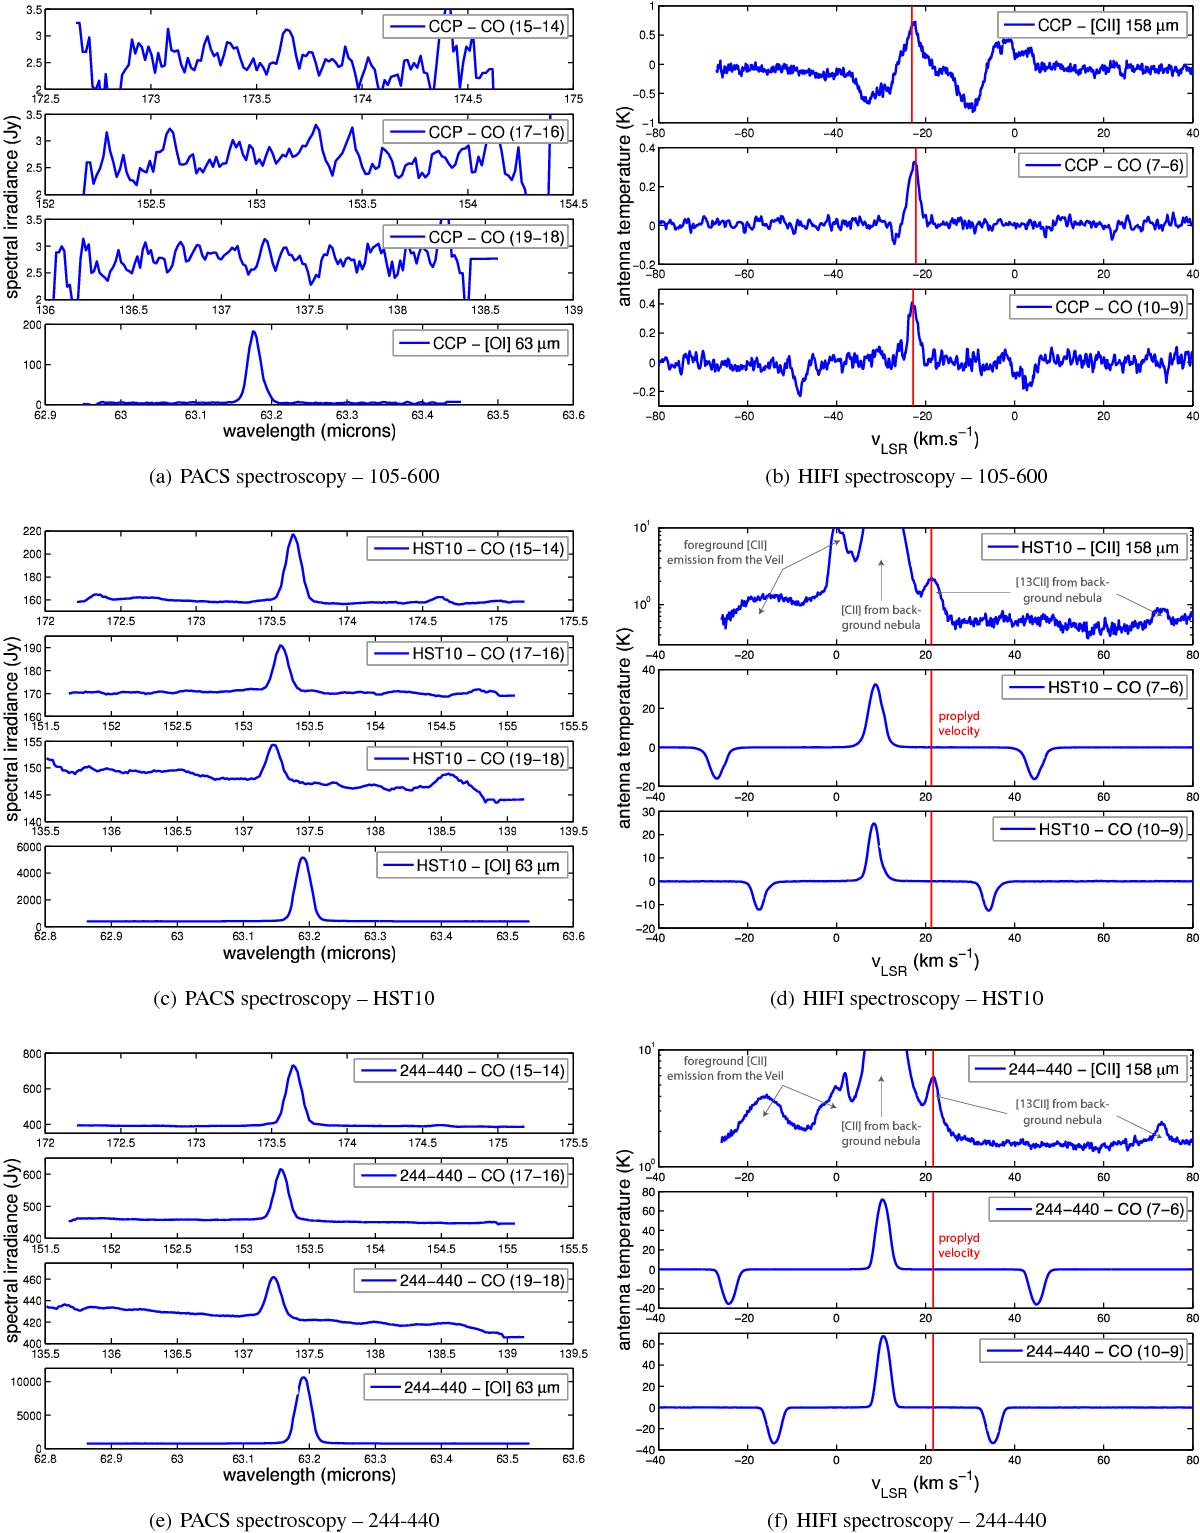
Level-2 calibrated spectra for the three targets: 105-600, HST10 and 244-440 respectively from top to bottom. Spectrally unresolved lines observed with PACS are presented on the left and resolved lines observed with HIFI lied on the right. The red vertical bars on HIFI spectra indicate the vLSR of the objects.
This figure is made of several images, please see below:
Current usage metrics show cumulative count of Article Views (full-text article views including HTML views, PDF and ePub downloads, according to the available data) and Abstracts Views on Vision4Press platform.
Data correspond to usage on the plateform after 2015. The current usage metrics is available 48-96 hours after online publication and is updated daily on week days.
Initial download of the metrics may take a while.