Fig. A.1
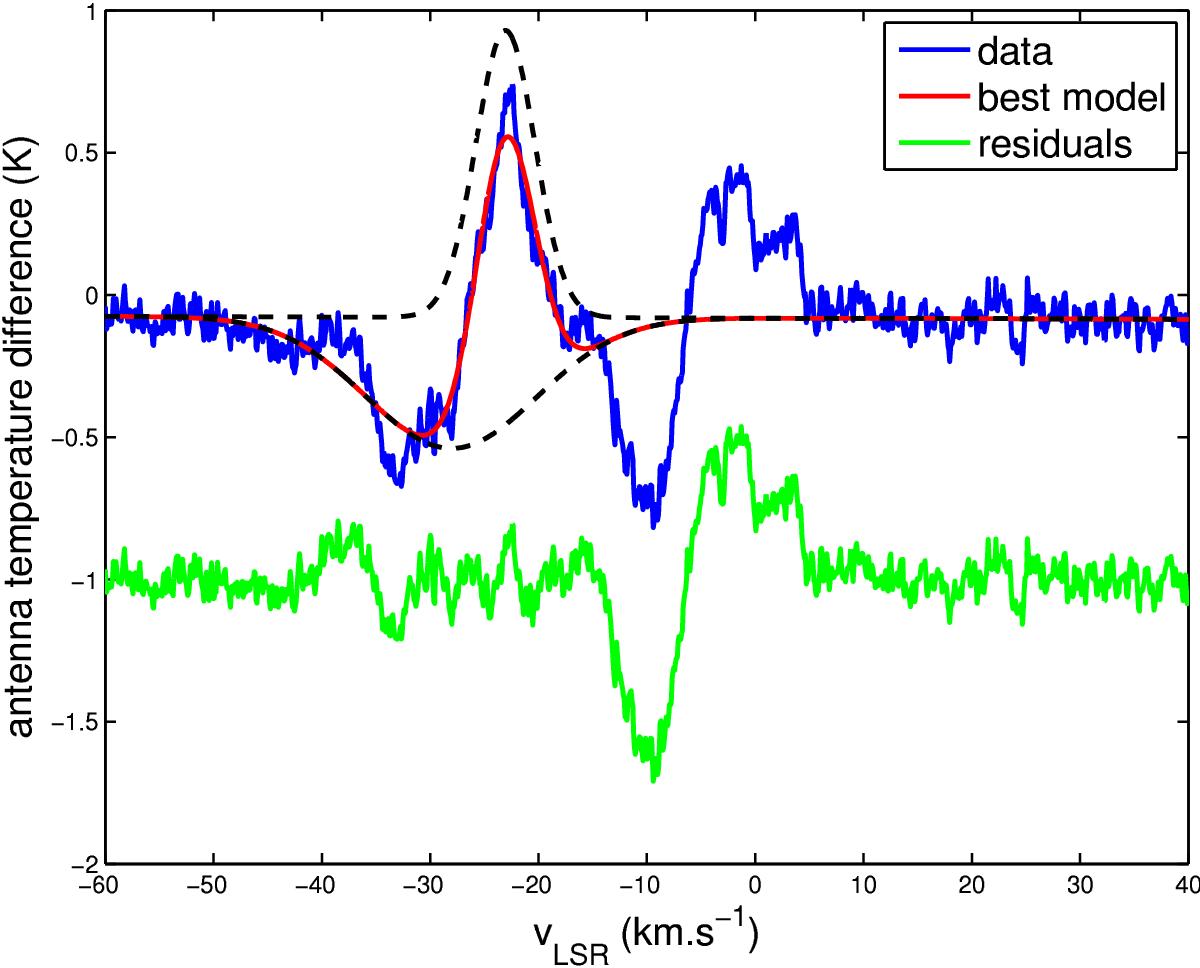
Fit of the [CII] fine-structure line. The blue curve is the level-2 calibrated spectrum which is best fitted by the red curve. The positive dashed black line is the best model without the OFF line corresponding to the observation that we could have done if there was no contamination from the nebula. The negative one is OFF contamination model. Both Gaussians are fitted together and the residuals of the fit are given by the green curve.
Current usage metrics show cumulative count of Article Views (full-text article views including HTML views, PDF and ePub downloads, according to the available data) and Abstracts Views on Vision4Press platform.
Data correspond to usage on the plateform after 2015. The current usage metrics is available 48-96 hours after online publication and is updated daily on week days.
Initial download of the metrics may take a while.