| Issue |
A&A
Volume 593, September 2016
|
|
|---|---|---|
| Article Number | A98 | |
| Number of page(s) | 25 | |
| Section | Extragalactic astronomy | |
| DOI | https://doi.org/10.1051/0004-6361/201628420 | |
| Published online | 29 September 2016 | |
Optical and radio variability of the northern VHE gamma-ray emitting BL Lacertae objects
1 Tuorla Observatory, Department of Physics and Astronomy, University of Turku, 20014 Turku, Finland
2 Finnish Centre for Astronomy with ESO (FINCA), University of Turku, Väisäläntie 20, 21500 Piikkiö, Finland
3 Aalto University Metsähovi Radio Observatory, Metsähovintie 114, 02540 Kylmälä, Finland
4 Aalto University Department of Radio Science and Engineering, PO Box 13000, 00076 Aalto, Finland
5 Foundation for Research and Technology – Hellas, IESL, Voutes, 7110 Heraklion, Greece
6 Department of Physics and Institute for Plasma Physics, University of Crete, 71003 Heraklion, Greece
7 Max-Planck-Institut für Radioastronomie, Auf dem Hügel 69, 53121 Bonn, Germany
8 Cahill Center for Astronomy & Astrophysics, Caltech, 1200 E. California Blvd, Pasadena, CA 91125, USA
Received: 2 March 2016
Accepted: 4 June 2016
We compare the variability properties of very high energy gamma-ray emitting BL Lac objects in the optical and radio bands. We use variability information to distinguish multiple emission components in the jet, to be used as a guidance for spectral energy distribution modelling. Our sample includes 32 objects in the northern sky for which we have data for at least two years in both bands. We use optical R-band data from the Tuorla blazar monitoring program and 15 GHz radio data from the Owens Valley Radio Observatory blazar monitoring program. We estimate the variability amplitudes using the intrinsic modulation index, and study the time-domain connection by cross-correlating the optical and radio light curves assuming power law power spectral density. Our sample objects are in general more variable in the optical than radio. We find correlated flares in about half of the objects, and correlated long-term trends in more than 40% of the objects. In these objects we estimate that at least 10−50% of the optical emission originates in the same emission region as the radio, while the other half is due to faster variations not seen in the radio. This implies that simple single-zone spectral energy distribution models are not adequate for many of these objects.
Key words: galaxies: active / BL Lacertae objects: general / galaxies: jets
© ESO, 2016
1. Introduction
Today 67 extragalactic very high energy (VHE) γ-ray sources are known1. The vast majority of these sources are active galactic nuclei (AGN) of blazar type. In blazars the relativistic jet, where electrons travel with a speed close to the speed of light, points close to our line of sight. The blazar group consists of flat-spectrum radio quasars and BL Lac objects. Of the VHE γ-ray emitting blazars, the 55 BL Lac objects form the majority.
The spectral energy distribution (SED) of the blazars shows two peaks; one in the infra-red to X-ray range and the second in the X-ray to γ-rays. The first peak is synchrotron emission while the second is most commonly attributed to inverse Compton emission. Based on the location of the first peak, the BL Lac objects are traditionally divided into three classes: low, intermediate and high energy synchrotron peaking (LSP, ISP and HSP, Abdo et al. 2010a). The high energy synchrotron peaking objects have their synchrotron peak in the UV to X-ray range and have therefore been considered as best candidates to emit VHE γ-ray energies (e.g. Costamante & Ghisellini 2002). Indeed within the known VHE γ-ray blazars they are the most numerous, which could also in part be an observational bias as the pointed observations focus on best candidates, and no full-sky survey exists. However, all BL Lac object sub-classes are present in the VHE γ-ray emitting blazar class. We also note that in many BL Lac objects the synchrotron peak moves to higher energies during flares (e.g. Pian et al. 1998), and therefore the division between the different classes is not well defined. Additionally, there seems to exist a class of extreme BL Lac objects that show very hard spectra in X-ray and VHE γ-ray regime (e.g. Costamante et al. 2001).
Blazars in general show variability in all wavelengths from radio to γ-rays. Many VHE γ-ray blazars show fast, large amplitude variability in VHE γ-rays (e.g. PKS 2155-304; Aharonian et al. 2007a) (Mrk 501; Albert et al. 2007a), while for some, no variability has been detected (e.g. 1ES 0414+009; Aliu et al. 2012a). In MeV-GeV γ-rays the BL Lac objects are generally less variable than the FSRQs (Abdo et al. 2010a). The variability in X-rays often shows correlation with the VHE γ-rays (e.g. Fossati et al. 2008). There is also a connection between optical outbursts and emission of the VHE γ-rays, witnessed by the success of optically triggered target of opportunity observations in detecting new sources as well as high flux states in VHE γ-rays (Reinthal et al. 2012; Aleksić et al. 2015b, and references therein). In radio bands the HSPs are in general weak and less variable (e.g. Nieppola et al. 2007), while LSPs are bright and show frequent large amplitude outbursts. Due to their radio faintness, the HSPs have not been well represented in large very long baseline interferometry (VLBI) programs, but there is evidence that high energy synchrotron peaking BL Lac objects show lower Doppler factors in the γ-ray loud AGN class (Lister et al. 2011).
In general, the SEDs of VHE γ-ray BL Lacs are modelled with a single-zone synchrotron self-Compton models, where the emission region is located close to the central black hole, and is therefore opaque to radio emission (e.g. Tavecchio et al. 2010). The radio emission is assumed to originate in the parsec scale jet and is therefore typically excluded from the modelling. However, the multiwavelength campaigns are typically short in duration (from a number of weeks to one or two months) or include only sparse radio observations. Whether or not this assumption is justified has not, therefore, been well studied.
The connection between optical and radio outbursts in blazars have been investigated in several works (e.g. Tornikoski et al. 1994; Hanski et al. 2002) in which it was found that the connection is not straightforward. Sometimes there is a correlation between these two bands while other times there is not. However, these works largely concentrate on FSRQs and low frequency BL Lac objects that are bright in radio frequencies. For VHE γ-ray BL Lacs, the radio-optical connection has not been studied in detail. However, recently a connection between optical and radio was found for two sources (Aleksić et al. 2014a,b). In this paper we study the optical and radio variability properties of the VHE γ-ray emitting BL Lacs using the long-term monitoring data from Tuorla blazar monitoring program and Owens Valley radio observatory (OVRO) monitoring program. The study is the first of its kind for a sample of VHE γ-ray blazars. We compare the optical and radio variability behaviour of the sources and investigate if the assumptions used in the modelling of the SEDs are justified.
2. Observations and data analysis
2.1. Tuorla blazar monitoring program
The optical R-band observations have been performed as a part of the Tuorla blazar monitoring program2. The observations are made using the 35 cm telescope attached to the 60 cm Kungliga Vetenskapsakademi (KVA) telescope (and can be used simultaneously with it) at La Palma and Tuorla 1.03 m telescope in Finland. The monitoring program is concentrated on blazars with δ> −20°. The KVA telescope is remotely operated from Finland. The observations are coordinated with the MAGIC Telescope and while the monitoring observations are typically performed two to three times a week (weather permitting), during MAGIC observations the sources are observed every night.
The data are analyzed using the standard procedures with the semi-automatic pipeline developed in Tuorla (Nilsson et al., in prep.). The magnitudes are measured using the differential photometry and comparison star magnitudes from Nilsson et al. (2007), Smith et al. (1991), Smith & Balonek (1998), Monet et al. (1998), Villata et al. (1998), Fiorucci & Tosti (1996), Fiorucci et al. (1998). For five sources VER 0521+211, VER 0648+151, RGB 0847+115, MAGIC J2001+435 and B3 2247+381 we calibrated the comparison stars using the observations of sources with known comparison star magnitudes from same night (see Appendix B). The magnitudes are converted into Janskys using the standard formula S = 3080 × 10− (mag / 2.5).
For many sources the contribution of the host galaxy to the total flux density is significant. Therefore, it has been subtracted using the host galaxy fluxes from Nilsson et al. (2007) or host galaxy magnitudes from Scarpa et al. (2000), Meisner & Romani (2010), Nilsson et al. (2003, 2008), Aleksić et al. (2014b). For the three sources VER 0521+211, VER 0648+151, and RGB 0847+115 neither of these were available, so the host galaxy was assumed to be a standard elliptical with MR = −22.8 and effective radius of 8 kpc and its contribution to the measured flux density within our aperture (5′′) was estimated using the standard formulae. Host galaxy values for these three sources are given in Appendix B.
Finally, the measured fluxes were corrected for the galactic absorption using the values from NED3.
2.2. OVRO
Regular 15 GHz observations of the sources were carried out as part of the blazar monitoring program at OVRO (Richards et al. 2011, 2014). The program includes all the Fermi detected blazars with δ> −20° from 1FGL and 2FGL and the candidate gamma-ray emitters from Healey et al. (2008).
The OVRO 40-m telescope uses off-axis dual-beam optics and a cryogenic high electron mobility transistor (HEMT) low-noise amplifier with a 15.0 GHz center frequency and 3 GHz bandwidth. The two sky beams are Dicke switched using the off-source beam as a reference, and the source is alternated between the two beams in an ON-ON fashion to remove atmospheric and ground contamination. Calibration is achieved using a temperature-stable diode noise source to remove receiver gain drifts and the flux density scale is derived from observations of 3C 286 assuming the Baars et al. (1977) value of 3.44 Jy at 15.0 GHz.
A noise level of approximately 3–4 mJy in quadrature with about 2% additional uncertainty, mostly due to pointing errors, is achieved in a 70 s observation period. The systematic uncertainty of about 5% in the flux density scale is not included in the error bars. Complete details of the reduction and calibration procedure are found in Richards et al. (2011).
3. Sample
VHE BL Lac sample.
The number of known VHE γ-ray emitting BL Lacs is 55 (as of January 2016)4. The redshift range is from 0.03 to ~ 0.6, although some sources still have uncertain or unknown redshift. Most of the sources have high synchrotron peak frequency and are classified as HSPs (log νpeak> 15.0), while only four intermediate and two low synchrotron peaking sources are known. The VHE γ-ray fluxes of the sources range from very weak (< 1% of Crab nebula flux at 200 GeV) to very bright (> 5 Crab nebula flux) and many sources are variable.
For 39 of these sources we could find a radio measurement from the literature and the 5 GHz flux densities range from ~0.01 Jy to ~3.5 Jy, the faintest being 1ES 0347−121 and the brightest one BL Lacertae. For all sources archival optical data from the R band is available and the observed flux density range is from 0.1 mJy (1ES 0229+200, host galaxy subtracted) to 25 mJy (Mrk 421, host galaxy subtracted).
The Tuorla blazar monitoring sample consists of a core sample of 24 TeV candidate BL Lac objects from Costamante & Ghisellini (2002) with δ> 20° (observable from Tuorla). These blazars have been monitored since the fall of 2002. Since then many other sources have been added, and it now monitors most of the VHE γ-ray emitting AGN with δ> −20°. The declination limit excludes eleven VHE γ-ray blazars. The monitoring program does not include IC 310 and HESS J1943+243. Additionally there are ten VHE γ-ray emitting blazars that are not part of the program: SHBL J001355.9−185406, KUV 00311−1938, S2 0109+22, 1ES 0152+017, 1ES 0347−121, RGB 0710+591, MS 1221.8+2452, S3 1227+25, 1ES 1440+122 and RGB 2243+203. This gives us a sample of 32 VHE γ-ray emitting BL Lac objects with optical light curves with at least two years of data (see Table 1).
The OVRO blazar monitoring program started in 2008 including all the sources from the candidate gamma-ray blazar sample in Healey et al. (2008) with δ> −20°. All Fermi-detected sources from 1FGL and 2FGL catalogues have been subsequently added to the monitoring. For each of the 32 sources for which we have long enough optical light curves, there exist more than two years of OVRO data. The source sample, and the time range of the data for each source, is presented in Table 1. The sample represents well the known population of VHE γ-ray emitting BL Lacs in redshift range, classification, VHE γ-ray fluxes and range of optical and radio flux densities found in literature. The majority of the sources are HSPs, all of the intermediate objects are included and one of the two known LSPs is included (although BL Lac is classified as ISP in Ackermann et al. (2011)). In redshifts, the population is mostly concentrated to z< 0.2. Only four BL Lac sources are known at z> 0.4, three of which are in our sample.
Analysis results of the optical R-band light curves.
Analysis results of the 15 GHz radio light curves.
The average radio and optical flux densities for the sample range in radio from 0.014 Jy to 5.544 Jy and in optical from 0.16 mJy to 25.13 mJy (Tables 2 and 3), in the period indicated in Table 1. The median for average radio flux density is 0.17 Jy and for optical flux density 2.19 mJy. The average flux densities are shown in Fig. 1 and Tables 2 and 3. There is a clear correlation between the average flux density in radio and optical with the Spearman’s ρ = 0.75. We estimate the significance of the correlation using simulated samples in the luminosity space as proposed by Pavlidou et al. (2012), in order to account for the common redshift in the two wavebands. For the calculation of the luminosity we assume a flat spectral index of 0 in the radio band and − 1.1, − 1.3, and − 1.5 in the optical band for the HSP, ISP, and LSP sources, respectively (Fiorucci et al. 2004). By simulating 107 uncorrelated samples, we obtain a significance of p = 1.9 × 10⁻⁵ (> 4σ) for the correlation.
As the sample studied in this work is VHE γ-ray selected, we also checked if average flux densities correlate with the VHE γ-ray flux given in Table 1. We found no significant correlation, but we note that the VHE flux densities present the highest observed flux density, not the average one, and are typically non-simultaneous to the optical and radio data.
 |
Fig. 1 Average radio flux density versus the average optical flux density. The average flux densities in these two bands show strong correlation (> 4σ), the dotted line shows the best-fit for the correlation. The different symbols denote different source classes (HSPs, red circles; ISPs, blue rectangles). As expected, the ISP’s seem to be brighter in radio and optical bands. |
4. Variability analysis
4.1. Variability amplitudes
We determined the variability amplitudes of the sources in the optical and radio bands using the intrinsic modulation index (Richards et al. 2011), defined as  (1)where σ0 is the intrinsic standard deviation and S0 is the intrinsic mean flux density of the source. Here the term intrinsic denotes values that would be obtained if the observational uncertainties were zero and we would have infinite number of samples. The intrinsic values were calculated using a likelihood approach, which assumes the observed flux densities to follow a normal distribution with Gaussian errors. The measurement errors were accounted for in the calculation of the joint likelihood for S0 and
  . For the full derivation of the likelihoods see Richards et al. (2011). The main advantage of this method over other variability estimates is that it provides an uncertainty estimate for the variability, which increases when the flux uncertainty is larger or the number of points in the light curves is small.
 |
Fig. 2 Histogram of the intrinsic modulation indices |
The modulation indices and uncertainties for each source are shown in Tables 2 and 3. In four cases (RGB 0136+391, 1ES 0502+675, RGB 0847+115, VER J0648+152) in the radio and in one case (1ES 0229+200) in the optical there were too many low signal-to-noise points for estimating the modulation index. All the remaining sources were variable at a more than 3σ level.
The mean value of modulation index for the optical and radio light curves is  and
and  , respectively. The uncertainty is typically ~ 0.01, largest value being 0.044. The distributions of the modulation indices are shown in Fig. 2 and are clearly different. According to a non-parametric Kolmogorov-Smirnov (K-S) test, the optical and radio modulation indices come from the same population with a probability p = 1.3 × 10⁻⁵.
Figure 3 shows the modulation indices at 15 GHz versus the modulation indices at the R band. The two show significant correlation with Spearman’s ρ = 0.58 corresponding to significance of > 3σ. However, this correlation is largely due to ISPs showing larger modulation index values in general and for HSPs only the Spearman’s ρ = 0.32, i.e. the correlation is not significant.
 |
Fig. 3 Modulation index at 15 GHz versus the modulation index at the optical R band for the sample sources (HSPs red circles, ISPs blue rectangles). The sources for which one of the modulation indices could not be determined were excluded from the plot. As expected the ISPs in general have larger modulation indices in optical and radio than HSPs. Therefore the indices between the two band show significant (> 3σ) correlation (see text). The dotted line shows the best linear fit to the data. |
4.2. Trends
Blazars have been long known to show variability in time scales of years, in addition to the fast variability, which is typically described as flares (Smith et al. 1993). Smith & Nair (1995) determined that for BL Lacs in optical band the observed time scale of such slow variations is typically 5−7.5 yr, with the average at 7.2 yr. In the simplest case such slow variability would show up as increasing or decreasing trend in our data as the studied light curves have duration less than the average time scale of these variations. In the case of PKS 1424+240, such trend was also present in the 15 GHz data (Aleksić et al. 2014a).
Analysis results of the connection between optical and radio light curves.
To look for such trends in our optical and radio light curves, we simply tested if there was a significant correlation between time and flux density. We used the five methods for obtaining the linear regression fits from Isobe et al. (1990). In Tables 2 and 3 we report the Spearman ρ value for these fits for optical and radio light curves, respectively. As the analysis did not take into account the uncertainties of the flux density measurements, we also tested the significance using bootstrapping analysis for re-sampling the light curves. Also these values are given in the tables as well as p-values for null hypothesis of the no trend. If the null hypothesis can be excluded at 5σ level we conclude that there is a significant trend in the data.
We found that 21 of our optical and 22 of our radio light curves5 showed significant increasing or decreasing trend. In 13 sources6 the trends in optical and radio bands were to the same direction.
To investigate the probability of a random occurrence of this result in presence of red noise, we performed simulations. We first simulated 1000 optical and 1000 radio light curves for each source assuming that the light curves were red noise with a power law slope of − 1.5 (optical, Nilsson et al., in prep.) and − 1.7 (radio, derived for this sample using the methods in Max-Moerbeck et al. 2014)7. The light curves were then interpolated to have the same rms scatter and sampling as the observed light curve. Finally, we performed the same linear regression analysis to these simulated light curves. The results are summarized in Table 4. In the simulations we found on average 21.9 sources with a trend in the optical and 17.3 sources with a trend in the radio, so the sample statistics are also in acceptable agreement with the real data, even if on average there are fewer trends in the simulated radio light curves than in the real radio data. However, for some of the weak (F< 0.1 Jy) radio sources, the simulated light curves did not show any trends or occured only in one or two of the 1000 light curves. We suggest that this is related to the size of the uncertainties of the actual radio light curves for these sources. The simulation results were in general agreement with the real data, meaning that for these sources we find no significant trends in the observed light curves either. There is only one exception, VER 0648+121, for which our trend test suggests significant trend, but light curve analysis cannot determine a modulation index. Therefore, we exclude this source from statistics of the whole sample. We found that the observed fraction of trends in the same direction (≥ 13 / 31) is found only in five cases out of 1000 in the simulations (p = 0.005). Therefore, we conclude that the result indicates a true physical connection, meaning that the slowly variable optical component has a common origin with the 15 GHz radio emission.
4.3. Cross-correlation of light curves
We use the discrete correlation function (DCF; Edelson & Krolik 1988) with local normalization (LCCF; Welsh 1999) to study the correlation between the optical and radio light curves. In the calculation of the LCCF, we use time binning of ten days and also require that each LCCF bin has at least ten elements. We include all sources that are variable according to the modulation indices estimated in Sect. 4.1. For these sources the cross correlation functions are shown in the bottom panel of Figs. A.1, A.3, A.5, A.6, A.8, A.10−A.32.
The significance of the cross-correlation is estimated using simulated light curves, as in Max-Moerbeck et al. (2014). We take 1000 simulated uncorrelated light curves of each source (we use the best-fitting power-law index values, as determined in Sect. 4.2) and cross-correlate them as for the real data. This way we can estimate the occurrence of false correlations due to random fluctuations in the data. The significance levels are also shown in the Figs. A.1, A.3, A.5, A.6, A.8, and A.10−A.32. In Table 4, we list the most significant time lag between the optical and radio light curves for sources showing significant correlations at a 3σ level. We only list time lags that are shorter than half the length of the light curves to discard those due to single events.
We note that the significance estimates depend strongly on the slope of the power spectral density used to simulate the light curves (Max-Moerbeck et al. 2014). Furthermore, as shown by Emmanoulopoulos et al. (2013), if the flux density distributions are non-Gaussian, it will also have a large effect on the estimated significances. Therefore it is likely that the significance of our correlations is overestimated in some cases where the obtained time lag is close to the 3σ limit. This seems to be the case for sources such as 1ES 0033+595 where the most significant delays seem to be produced by a few outlier points with small uncertainties in the radio light curve. In cases like this, when the majority of the radio data points have fairly large uncertainties, the simulations do not produce such outliers into the light curves. This results in an overestimation of the significance of the correlation, as the simulated light curves do not reproduce the observed ones perfectly. In other sources, such as VER 0521+211, the significant correlation is most likely produced by a common linear trend in the data. We discuss the individual correlations in Appendix A.
 |
Fig. 4 Histogram of the time lags between optical and radio light curves. A negative lag means that optical leads the radio variations. |
Of the 27 sources for which we calculated the DCF, 17 show correlations at a > 3σ level. The distribution of the time lags is shown in Fig. 4. A negative time lag means that optical leads the radio variations. The range of time lags is − 1030 days (optical leading, 1ES 0647+250) to 860 days (radio leading, 3C 66A). In the case of 1ES 0647+250 the correlation is barely significant and most likely to be due to a common rising trend in the light curves, rather than correlated flares (see also Appendix A). Similarly, in 3C 66A the correlation is barely significant and due to the large radio flare at the beginning of the monitoring period. The mean and median time lags are − 79 and − 70 days, respectively, showing that typically the optical variations lead the radio variations.
5. Discussion
The results from the three methods applied to study the connection between the emission at 15 GHz and the optical R band in VHE γ-ray detected BL Lac object population are discussed below. The findings for individual sources are discussed in Appendix A.
The modulation index analysis shows that the variability in optical and radio bands differs significantly, with the variability amplitudes in the optical being significantly larger than in the radio. This is consistent with the findings for a much larger blazar sample where the optical and 15 GHz radio modulation indices were compared (Hovatta et al. 2014). However, there seems to be a significant connection in these two bands when longer time scales are studied. This has been previously found for single sources of our sample (PG 1424+240 and MAGIC J2001+439, Aleksić et al. 2014a,b), which partially triggered the study presented here. The connection is evident both in the simplistic approach of looking at overall trend of the light curve as well as in DCF analysis. Comparing the results of these two analyses, we find that:
-
For ten sources in our sample both analyses show connectedvariability, which is a strong indication of common origin of theemission in these wavebands, both in very long time scales(scoped by the linear regression) and shorter times scales(correlated flares).
-
For three sources (PG 1424+240, Mkn 501, and 1ES 1959+650) the linear regression analysis indicates common trends, but the DCF plot shows no peak with significance of > 3σ. However, in visual inspection of light curves there seem to be correlated flares (less evident in the case of PG 1424+240 due to very strong increasing trend in the radio light curve). The DCF curves show some 2σ peaks, indicating that there may be multiple time scales involved, but none of the peaks reaches 3σ limit.
-
For seven sources, DCF finds significant correlation (1ES 0033+595, 1ES 0414+009, 1ES 0806+524, 1ES 1218+304, PG 1553+113, H 1722+119, and B3 2247+381), but no common trend is found. In case of the first two, the linear regression analysis shows that there are no significant trends in either optical or radio light curves. For three sources (1ES 0806+524, 1ES 1218+304, and PG 1553+113), there is no significant trend in optical, but a significant trend in radio. Finally, for two (H 1722+119 and B3 2247+381) there is no trend in radio, but a significant trend in optical. These cases demonstrate a weakness in the linear regression method: the significant trend is sometimes a result of a single flare in the beginning or the end of the light curve, and a non-detection of a trend when the visually apparent trend changes direction within the time window we study.
-
Finally for 12 sources we find no indication of a connection between optical and radio variability. However, for five of these (RGB 0136+391, 1ES 0229+200, 1ES 0502+675, VER J0648+152, and RGB 0847+115), we did not even perform DCF analysis as there were too many low signal-to-noise points for estimating the modulation index. The remaining sample of seven sources consists of two sources that are very weak in both optical and radio (RGB 1136+676 and 1ES 1426+428), two sources that are very weak in the optical (HB89 0317+185 and 1ES 1741+196) and three sources (S5 0716+714, ON 231 and ON 325) that show clear outbursts in both wave bands without apparent correlated behaviour. For these weak sources, there still might be connection, but as the sources are weak, our measurements and methods fail to find them. The remaining three sources are discussed below and individually in Appendix A.
The time lags we found between optical and radio variations are similar to lags obtained using longer light curves of mainly bright quasars and BL Lac objects. Tornikoski et al. (1994) studied the correlation between up to 15 yr of radio and optical light curves of 18 sources. They found several sources with correlated variations, with the optical leading the radio variations by zero to a few hundred days. They attributed the lack of correlation to under-sampled light curves. Similar results were also obtained by Hanski et al. (2002) again using long-term radio and optical data. In their study, seven out of 20 sources showed correlations in the DCF analysis with delays from zero to several hundred days. In recent study by Ramakrishnan et al. (2016) 2.5 yr of data was used. In their study two out of nine (37 GHz) and three out of nine (95 GHz) sources showed significant correlation, the lags varying from 78 to 272 days. Tornikoski et al. (1994), Hanski et al. (2002) and Ramakrishnan et al. (2016) used higher frequency radio data from 22 to 95 GHz. A similar study was done by Clements et al. (1995) at lower frequencies, using 4.8, 8, and 14.5 GHz radio data in comparison with optical light curves of up to 26 yr long. They also found correlated variations in half of their sample of 18 sources, with optical variations leading by zero to 14 months.
In our case the light curves are well sampled and at least in some sources the lack of correlation seems to be due to a lack of strong variations in the radio light curves. Another alternative is that our light curves are not long enough to detect variations, as variability time scales in the radio light curves are typically long, on average four to six years (Hovatta et al. 2007). However, as discussed above, there are also several sources with clear outbursts in both bands, but no significant correlation (S5 0716+714, ON 231, ON 325, PKS 1424+240, Mrk 501 and 1ES 1959+650). All but S5 0716+714 show at least two 2σ peaks in the DCF, so it may be that for these sources multiple time scales are involved.
5.1. Common emission component
In Aleksić et al. (2014a), studying PKS 1424+240, it was suggested that the common trend seen in the radio and optical light curves is due to a common emission component, which was suggested to be the 15 GHz VLBA core. In Fig. 5 it is shown that indeed the brightness of the VLBA core closely follows the 15 GHz light curve as has been previously found also at the higher frequencies (Savolainen et al. 2002).
 |
Fig. 5 Comparison of 15 GHz light curve (black filled circles) and VLBA 15 GHz core fluxes (blue triangles) from Lister et al. (2013) for 1ES 1011+496 (top) and 1ES 2344+514 (bottom). |
 |
Fig. 6 Three steps to estimate the contribution from the slowly varying component to the optical light curves for Mkn 180 (top) 1ES 1011+496 (bottom). Left: the polynomial (red solid line) is fit to the radio light curve (green symbols). Middle: the polynomial is scaled to the same average flux density as the optical light curve and then multiplied with 0.1 (red crosses), 0.2, 0.3, ... 1.0 (red triangles). These polynomial-multiples are subtracted from the optical light curve. Right: the optical light curve from which the polynomial-multiple that minimizes the rms (blue line, 0.9 for Mkn 180 and 0.7 for 1ES 1011+496) has been subtracted (red) and the original optical data (green). |
In order to study this further in our sample of objects, we used a simple approach to estimate the contribution from the slowly varying component to the optical light curves. We do this by fitting a polynomial to the radio light curve, which enables us to simply quantify the observed variations. We then subtract this polynomial from the optical light curve and calculate the rms of the polynomial-subtracted optical light curve and compare it to the rms of the original optical light curve. The three steps are shown in Fig. 6 and include:
-
1.
We fit a polynomial to the radio light curve. The order of thepolynomial is defined by adding new orders until the χ2 of the fit does not improve any more. We define this by first fitting 40th order polynomials to determine the scatter in χ2 values and define that the fit did not improve when the improvement is smaller than this scatter. As the radio light curves of the sources are very different from each other, the number of orders differs from one to ~ 30 for the best fits. The polynomial fits are overlaid on top of the radio light curve in Figs. A.1–A.32.
-
2.
We scale the polynomial fit to the same average flux density as the optical data8 and then the polynomial fit is multiplied with 0.1, 0.2, 0.3, ... 1.0 and the resulting curve is subtracted from the optical data. We calculate the rms of the resulting light curves and select as best-fit the one that minimizes the rms. We also tested whether shifting the polynomial fit by the amount of the most significant lag would decrease the rms of the subtracted light curve, but on average this did not seem to be the case.
-
3.
To estimate the fractional contribution of this slowly varying component to the optical flux density, we divide the rms of the best-fit-subtracted data with the rms of the original data: Fraction =1−(rms subtracted optical data/ rmsoptical data).
The polynomial fits to light curves have  meaning that it does not describe all radio variability. Furthermore this analysis cannot account for varying fraction or different time scales of the flares, that is for sources which show multiple flares in both bands, with varying amplitude ratio (e.g. 3C 66A, 1ES 0806+524), or different time scales (typically faster rise of the optical flare, e.g. PG 1553+113), the results are rather poor.
The fractions we find vary from 0−63%, with in total nine sources showing no significant change in rms with the subtracted optical light curve compared to the non-subtracted optical light curve. There are seven sources that have a contribution of ~ 50%: 1ES 0414+009, VER 0521+211, VER J0648+152, Mkn 421, Mkn 180, 1ES 1218+304, and MAGIC J2001+439. These are all sources9 for which also the DCF analysis showed significant correlation and the majority also showed same direction in the linear regression analysis. The average fraction for the whole sample is 0.09 and for the sample, from which we have removed the 12 sources that showed no connection between optical and radio in our DCF and linear regression analysis, it is 0.27. However, due to the limitations of the analysis described above, these fractions should be considered as lower limits. It is still clear that significant fraction of the variability of the optical light curve originates from another component and that the relative contribution of these two components vary from one source to another. In the future work we will study whether this other component can be associated to the region that also emits the VHE γ-rays (Reinthal et al., in prep.). Moreover, it is evident that as some of the sources also show clear flares in their radio light curves (e.g. BL Lac), there can be multiple emission regions contributing to the observed flux density also in the radio band. This needs to be accounted for in the SED modelling.
6. Summary and conclusions
In this work we have presented the first study of the optical and radio variability of VHE γ-ray detected BL Lac objects. The population consists of mainly HSPs, which are, in general, faint radio sources and therefore rather little studied in this waveband. Still we find that all studied sources, for which we can calculate the modulation indices, are variable at 3σ level. Using linear regression analysis, we find significant increasing or decreasing trends in the radio light curves of 21 of our 32 sources. In the case of 13 sources, the trend is in same direction as the trend found in optical light curves, and our simulations show that chance coincidence for this has p = 0.005. We also found a significant correlation between radio and optical light curves for 17 sources. This clearly supports the common origin for radio and optical emission for some sources, which is in conflict with the most commonly adopted SED model, the one-zone SSC model, where the optical emission is assumed to originate from VHE γ-ray emitting region and radio emission from separate outer region and is excluded from the modelling.
We also study the amplitude of the variability of the radio and optical light curves. We find that modulation indices found for optical light curves are significantly larger than for radio light curves. Inspection of the light curves shows that many sources show fast sharp flares in the optical band, which are absent in most of the radio light curves. It is therefore evident, that in addition to common emission component, there is a second component contributing to the optical emission, which can indeed be linked to VHE γ-ray emission. We quantified this by estimating the slowly varying component in the optical light curves using the trends in the radio curves as a guidance, and found that on average, at least 27% of the optical emission is coming from the slowly varying component. This supports the two-zone models that have been suggested for, for example, Mrk 501 (Katarzynski et al. 2001; Doert et al. 2013) and most recently for PKS 1424+240 (Aleksić et al. 2014a), but also potentially provides a method to separate the emission from these components, by means of comparing the long term radio and optical light curves. In a future work we will compare this method with the method suggested in Barres de Almeida et al. (2014) using the optical polarization to separate the SED components.
As the sample studied in this work is VHE γ-ray selected, we also checked whether average flux densities or modulation indices correlated with the VHE γ-ray flux given in Table 1. We found no significant correlation, which is in agreement with the emission scenario presented above. However, we note that our VHE γ-ray data is not coherent in a sense that it could present different states for different sources (e.g. some sources have been only observed once). We will also address this question in a future work (Fallah Ramazani et al., in prep.).
As of January 2016, http://tevcat.uchicago.edu
We calculate the average and variance of the polynomial sampled with the dates of the optical data and subtract the average. We calculate the average and variance of the optical data and subtract the average. Finally we scale the polynomial such that the variances are equal and add the average of the optical data.
Acknowledgments
T.H. was supported by the Academy of Finland project number 267324. The OVRO 40-m monitoring program is supported in part by NASA grants NNX08AW31G and NNX11A043G, and NSF grants AST-0808050 and AST-1109911. This research has made use of the NASA/IPAC Extragalactic Database (NED) which is operated by the Jet Propulsion Laboratory, California Institute of Technology, under contract with the National Aeronautics and Space Administration.
References
- Abdo, A. A., Ackermann, M., Ajello, M., et al. (Fermi-LAT Collaboration) 2010a, ApJ, 715, 429 [NASA ADS] [CrossRef] [Google Scholar]
- Abdo, A. A., Ackermann, M., Ajello, M., et al. (Fermi-LAT Collaboration) 2010b, ApJ, 722, 520 [NASA ADS] [CrossRef] [Google Scholar]
- Abdo, A. A., Ackermann, M., Ajello, M., et al. (Fermi-LAT Collaboration) 2011, ApJ, 726, 43 [NASA ADS] [CrossRef] [Google Scholar]
- Abramowski, A., Acero, F., Aharonian, F., et al. (H.E.S.S. Collaboration) 2012, A&A, 538, A103 [NASA ADS] [CrossRef] [EDP Sciences] [Google Scholar]
- Abramowski, A., Aharonian, F., Ait Benkhali, F., et al. (H.E.S.S. Collaboration) 2015, ApJ, 802, 65 [NASA ADS] [CrossRef] [Google Scholar]
- Acciari, V. A., Aliu, E., Aune, T., et al. (VERITAS Collaboration) 2009, ApJ, 707, 612 [NASA ADS] [CrossRef] [Google Scholar]
- Acciari, V. A., Aliu, E., Beilicke, M., et al. (VERITAS Collaboration) 2010, ApJ, 709, 163 [Google Scholar]
- Acciari, V. A., Aliu, E., Arlen, T., et al. (VERITAS Collaboration) 2011, ApJ, 738, 169 [NASA ADS] [CrossRef] [Google Scholar]
- Ackermann, M., Ajello, M., Allafort, A., et al. (Fermi-LAT Collaboration) 2011, ApJ, 743, 171 [NASA ADS] [CrossRef] [Google Scholar]
- Ackermann, M., Ajello, M., Albert, A., et al. (Fermi-LAT Collaboration) 2015, ApJ, 813, 41 [Google Scholar]
- Aharonian, F. A., Akhperjanian, A. G., Barrio, J. A., et al. (H.E.S.S. Collaboration) 1999, A&A, 342, 69 [NASA ADS] [Google Scholar]
- Aharonian, F., Akhperjanian, A. G., Bazer-Bachi, A. R., et al. (H.E.S.S. Collaboration) 2007a, ApJ, 664, 71 [NASA ADS] [CrossRef] [Google Scholar]
- Aharonian, F., Akhperjanian, A. G., Barres de Almeida, U., et al. (H.E.S.S. Collaboration) 2007b, A&A, 475, L9 [NASA ADS] [CrossRef] [EDP Sciences] [Google Scholar]
- Ahnen, M. L., Ansoldi, S., Antonelli, L. A., et al. (MAGIC Collaboration) 2016a, A&A, 590, 24 [Google Scholar]
- Ahnen, M. L., Ansoldi, S., Antonelli, L. A., et al. (MAGIC Collaboration) 2016b, MNRAS, 459, 3271 [NASA ADS] [CrossRef] [Google Scholar]
- Albert, J., Aliu, E., Anderhub, H., et al. (MAGIC Collaboration) 2006, ApJ, 648, L105 [NASA ADS] [CrossRef] [Google Scholar]
- Albert, J., Aliu, E., Anderhub, H., et al. (MAGIC Collaboration) 2007a, ApJ, 669, 862 [NASA ADS] [CrossRef] [Google Scholar]
- Albert, J., Aliu, E., Anderhub, H., et al. (MAGIC Collaboration) 2007b, ApJ, 667, L21 [NASA ADS] [CrossRef] [Google Scholar]
- Aleksić, J., Alvarez, E. A., Antonelli, L. A., et al. (MAGIC Collaboration) 2012a, A&A, 544, A142 [NASA ADS] [CrossRef] [EDP Sciences] [Google Scholar]
- Aleksić, J., Alvarez, E. A., Antonelli, L. A., et al. (MAGIC Collaboration) 2012b, A&A, 539, A118, 6 [NASA ADS] [CrossRef] [EDP Sciences] [Google Scholar]
- Aleksić, J., Ansoldi, S., Antonelli, L. A., et al. (MAGIC Collaboration) 2014a, A&A, 567, A135 [NASA ADS] [CrossRef] [EDP Sciences] [Google Scholar]
- Aleksić, J., Ansoldi, S., Antonelli, L. A., et al. (MAGIC Collaboration) 2014b, A&A, 572, 121 [Google Scholar]
- Aleksić, J., Antonelli, L. A., Antoranz, P., et al. (MAGIC Collaboration) 2014c, A&A, 563, 90 [Google Scholar]
- Aleksić, J., Ansoldi, S., Antonelli, L. A., et al. (MAGIC Collaboration) 2015a, MNRAS, 446, 217 [NASA ADS] [CrossRef] [Google Scholar]
- Aleksić, J., Ansoldi, S., Antonelli, L. A., et al. (MAGIC Collaboration) 2015b, MNRAS, 451, 739 [NASA ADS] [CrossRef] [Google Scholar]
- Aleksić, J., Ansoldi, S., Antonelli, L. A., et al. (MAGIC Collaboration) 2015c, MNRAS, 450, 4399 [NASA ADS] [CrossRef] [Google Scholar]
- Aliu, E., Aune, T., Beilicke, M., et al. (VERITAS Collaboration) 2011, ApJ, 742, 127 [NASA ADS] [CrossRef] [Google Scholar]
- Aliu, E., Archambault, S., Arlen, T., et al. (VERITAS Collaboration) 2012a, ApJ, 755, 118 [NASA ADS] [CrossRef] [Google Scholar]
- Aliu, E., Archambault, S., Arlen, T., et al. (VERITAS Collaboration) 2012b, ApJ, 750, 94 [NASA ADS] [CrossRef] [Google Scholar]
- Aliu, E., Archer, A., Aune, T., et al. (VERITAS Collaboration) 2015, ApJ, 799, 7 [NASA ADS] [CrossRef] [Google Scholar]
- Anderhub, H., Antonelli, L. A., Antoranz, P., et al. (MAGIC Collaboration) 2009, ApJ, 704, L129 [NASA ADS] [CrossRef] [Google Scholar]
- Archambault, S., Arlen, T., Aune, T., et al. (VERITAS Collaboration) 2013, ApJ, 776, 69 [NASA ADS] [CrossRef] [Google Scholar]
- Archambault, S., Archer, A., Beilicke, M., et al. (VERITAS Collaboration) 2015, ApJ, 808, 110 [NASA ADS] [CrossRef] [Google Scholar]
- Arlen, T., Aune, T., Beilicke, M., et al. (VERITAS Collaboration) 2013, ApJ, 762, 92 [NASA ADS] [CrossRef] [Google Scholar]
- Baars, J. W. M., Baars, J. W. M., Genzel, R., et al. 1977, A&A, 61, 99 [NASA ADS] [Google Scholar]
- Barres de Almeida, U., Tavecchio, F., & Mankuzhiyil, N. 2014, MNRAS, 441, 2885 [NASA ADS] [CrossRef] [Google Scholar]
- Berger, K. 2011, Proc. 32nd ICRC, held in Beijing, China, 169 [Google Scholar]
- Berger, K., Schultz, C., Reinthal, R., et al. 2013, Proc. 33rd ICRC, Rio de Janeiro [arXiv:1308.3486] [Google Scholar]
- Clements, A. D., Smith, A. G., Aller, H. D., & Aller, M. F. 1995, AJ, 110, 529 [NASA ADS] [CrossRef] [Google Scholar]
- Cortina, J. 2012a, ATel, #3977 [Google Scholar]
- Cortina, J. 2012b, ATel, #4069 [Google Scholar]
- Cortina, J., & Holder, J. 2014, ATel, #4976 [Google Scholar]
- Costamante, L., & Ghisellini, G. 2002, A&A, 384, 56 [NASA ADS] [CrossRef] [EDP Sciences] [Google Scholar]
- Costamante, L., Ghisellini, G., Giommi, P., et al. 2001, A&A, 371, 512 [NASA ADS] [CrossRef] [EDP Sciences] [Google Scholar]
- Danforth, C. W., Keeney, B. A., Stocke, J. T., Shull, J. M., & Yao, Y. 2010, ApJ, 720, 976 [NASA ADS] [CrossRef] [Google Scholar]
- Doert, M., et al. 2013, Proc. 33rd ICRC 2013, Rio de Janeiro, contribution #762 [Google Scholar]
- Edelson, R. A., & Krolik, J. H. 1988, ApJ, 333, 646 [NASA ADS] [CrossRef] [Google Scholar]
- Emmanoulopoulos, D., McHardy, I. M., & Papadakis, I. E. 2013, MNRAS, 433, 907 [NASA ADS] [CrossRef] [Google Scholar]
- Falomo, R., & Kotilainen, J. K. 1999, A&A, 352, 85 [NASA ADS] [Google Scholar]
- Fiorucci, M., & Tosti, G. 1996, A&AS, 116, 403 [NASA ADS] [CrossRef] [EDP Sciences] [Google Scholar]
- Fiorucci, M., Ciprini, S., & Tosti, G. 2004, A&A, 419, 25 [NASA ADS] [CrossRef] [EDP Sciences] [Google Scholar]
- Fiorucci, M., Tosti, G., & Rizzi, N. 1998, PASP, 110, 105 [NASA ADS] [CrossRef] [Google Scholar]
- Fossati, G., Buckley, J. H., Bond, I. H., et al. 2008, ApJ, 677, 906 [NASA ADS] [CrossRef] [Google Scholar]
- Furniss, A., Fumagalli, M., Danforth, C., et al. 2013a, ApJ, 766, 35 [NASA ADS] [CrossRef] [Google Scholar]
- Furniss, A., Williams, D. A., Danforth, C., et al. 2013b, ApJ, 768, L31 [NASA ADS] [CrossRef] [Google Scholar]
- Furniss, A., Noda, K., Boggs, S., et al. 2015, ApJ, 812, 65 [NASA ADS] [CrossRef] [Google Scholar]
- Hanski, M., Takalo, L. O., & Valtaoja, E. 2002, A&A, 394, 17 [NASA ADS] [CrossRef] [EDP Sciences] [Google Scholar]
- Heidt, J., Nilsson, K., Fried, J. W., Takalo, L. O., & Sillanpää, A. 1999, A&A, 348, 113 [NASA ADS] [Google Scholar]
- Healey, S. E., Romani, R. W., Cotter, G., et al. 2008, ApJ, 175, 97 [Google Scholar]
- Horan, D., Badran, H. M., Bond, I. H., et al. 2002, ApJ, 571, 753 [NASA ADS] [CrossRef] [Google Scholar]
- Hovatta, T., Tornikoski, M., Lainela, M., et al. 2007, A&A, 469, 899 [NASA ADS] [CrossRef] [EDP Sciences] [Google Scholar]
- Hovatta, T., Pavlidou, V., King, O. G., et al. 2014, MNRAS, 439, 690 [NASA ADS] [CrossRef] [Google Scholar]
- Hovatta, T., Petropoulou, M., Richards, J. L., et al. 2015, MNRAS, 448, 3121 [NASA ADS] [CrossRef] [Google Scholar]
- Isobe, T., Feigelson, E. D., Akritas, M. G., et al. 1990, ApJ, 364, 104 [NASA ADS] [CrossRef] [EDP Sciences] [Google Scholar]
- Katarzynski, K., Sol, H., & Kus, A. 2001, A&A, 367, 809 [NASA ADS] [CrossRef] [EDP Sciences] [Google Scholar]
- Kotilainen, J. K., Hyvönen, T., Falomo, R., Treves, A., & Uslenghi, M. 2011, A&A, 534, L2, 5 [NASA ADS] [CrossRef] [EDP Sciences] [Google Scholar]
- Krawczynski, H., Hughes, S. B., Horan, D., et al. 2004, ApJ, 601, 151 [NASA ADS] [CrossRef] [Google Scholar]
- Laurent-Muehleisen, S. A., Kollgaard, R. I., Ciardullo, R., et al. 1998, ApJ, 118, 127 [NASA ADS] [Google Scholar]
- Lister, M., Aller, M. F., Aller, H., et al. 2011, ApJ, 742, 27 [NASA ADS] [CrossRef] [Google Scholar]
- Lister, M., Aller, M. F., Aller, H., et al. 2013, AJ, 146, 120 [NASA ADS] [CrossRef] [Google Scholar]
- Max-Moerbeck, W., Richards, J. L., Hovatta, T., et al. 2014, MNRAS, 445, 437 [NASA ADS] [CrossRef] [Google Scholar]
- Majumdar, P. 2011, Proc. 32nd International Cosmic Ray Conf. (ICRC2011), held 11−18 August, 2011 in Beijing, China, 8, 43 [Google Scholar]
- Meisner, A., & Romani, R. 2010, ApJ, 712, 14 [NASA ADS] [CrossRef] [Google Scholar]
- Mirzoyan, R. 2014a, ATel, #5768 [Google Scholar]
- Mirzoyan, R. 2014b, ATel, #6062 [Google Scholar]
- Mirzoyan, R., & Holder, J. 2014, ATel, #5887 [Google Scholar]
- Monet, D., Canzian, B., Harris, H., et al. 1998, VizieR Online Data Catalogue, I/243 [Google Scholar]
- Nieppola, E., Tornikoski, M., Lähteenmäki, A., et al. 2007, AJ, 133, 1947 [NASA ADS] [CrossRef] [Google Scholar]
- Nilsson, K., Pursimo, T., Heidt, J., et al. 2003, A&A, 400, 95 [NASA ADS] [CrossRef] [EDP Sciences] [Google Scholar]
- Nilsson, K., Pasanen, M., Takalo, L. O., et al. 2007, A&A, 475, 199 [NASA ADS] [CrossRef] [EDP Sciences] [Google Scholar]
- Nilsson, K., Pursimo, T., Sillanpää, A., Takalo, L. O., & Lindfors, E. 2008, A&A, 487, 29 [Google Scholar]
- Nilsson, K., Pursimo, T., Villforth, C., et al. 2012, A&A, 547, 1 [Google Scholar]
- Oke, J. B. 1978, ApJ, 219, L97 [NASA ADS] [CrossRef] [Google Scholar]
- Pavlidou, V., Richards, J. L., Max-Moerbeck, W., et al. 2012, ApJ, 751, 149 [NASA ADS] [CrossRef] [Google Scholar]
- Pian, E., Vacanti, G., Tagliaferri, G., et al. 1998, ApJ, 492, 17 [Google Scholar]
- Plotkin, R. M., Anderson, S. F., Brandt, W. N., et al. 2010, AJ, 139, 390 [NASA ADS] [CrossRef] [Google Scholar]
- Raiteri, C. M., Villata, M., Tosti, G., et al. 2003, A&A, 402, 151 [NASA ADS] [CrossRef] [EDP Sciences] [Google Scholar]
- Ramakrishnan, V., Hovatta, T., Tornikoski, M., et al. 2016, MNRAS, 456, 171 [NASA ADS] [CrossRef] [Google Scholar]
- Reinthal, R., Lindfors, E., Mazin, D., et al. 2012, J. Phys. Conf. Ser., 355, 012013 [NASA ADS] [CrossRef] [Google Scholar]
- Richards, J. L., Max-Moerbeck, W., Pavlidou, V., et al. 2011, ApJS, 194, 29 [NASA ADS] [CrossRef] [Google Scholar]
- Richards, J. L., Hovatta, T., Max-Moerbeck, W., et al. 2014, MNRAS, 438, 3058 [NASA ADS] [CrossRef] [Google Scholar]
- Savolainen, T., Wiik, K., Valtaoja, E., Jorstad, S. G., & Marscher, A. P. 2002, A&A, 394, 851 [NASA ADS] [CrossRef] [EDP Sciences] [Google Scholar]
- Sbarufatti, B., Treves, A., & Falomo, R. 2005, ApJ, 635, 173 [NASA ADS] [CrossRef] [Google Scholar]
- Sbarufatti, B., Treves, A., & Falomo, R. 2006, AJ, 132, 1 [NASA ADS] [CrossRef] [Google Scholar]
- Scarpa, R., Urry, C. M., Padovani, P., et al. 2000, ApJ, 544, 258 [NASA ADS] [CrossRef] [Google Scholar]
- Shaw, M. S., Romani, R. W., Cotter, G., et al. 2013, ApJ, 764, 135 [NASA ADS] [CrossRef] [Google Scholar]
- Smith, A. G., & Nair, A. D. 1995, PASP, 107, 863 [NASA ADS] [CrossRef] [Google Scholar]
- Smith, A. G., Nair, A. D., Leacock, R. J., & Clements, S. D. 1993, AJ, 105, 437 [NASA ADS] [CrossRef] [Google Scholar]
- Smith, P. S., Jannuzi, B. T., & Elston, R. 1991, ApJS, 77, 67 [NASA ADS] [CrossRef] [Google Scholar]
- Smith, P. S., & Balonek, T. J. 1998, PASP, 110, 1164 [NASA ADS] [CrossRef] [Google Scholar]
- Sorcia, M., Benitez, E., Hiriart, D., et al. 2014, ApJ, 794, 54 [NASA ADS] [CrossRef] [Google Scholar]
- Tavecchio, F., Ghisellini, G., Ghirlanda, G., et al. 2010, MNRAS, 401, 1570 [NASA ADS] [CrossRef] [Google Scholar]
- Tornikoski, M., Valtaoja, E., Terasranta, H., et al. 1994, A&A, 289, 673 [NASA ADS] [Google Scholar]
- Welsh, W. F. 1999, PASP, 111, 1347 [NASA ADS] [CrossRef] [Google Scholar]
- Villata, M., Raiteri, C. M., Lanteri, L., Sobrito, G., & Cavallone, M. 1998, A&AS, 130, 305 [NASA ADS] [CrossRef] [EDP Sciences] [MathSciNet] [PubMed] [Google Scholar]
- Villata, M., Raiteri, C. M., Aller, H. D., et al. 2004, A&A, 424, 497 [NASA ADS] [CrossRef] [EDP Sciences] [Google Scholar]
- Villata, M., Raiteri, C. M., & Larionov, V. M. 2008, A&A, 481, 79 [NASA ADS] [CrossRef] [EDP Sciences] [Google Scholar]
Appendix A: Comments on individual sources
1ES 0033+595: the average flux density in the optical and radio bands is below the median of the sample. The radio nor the optical light curve show significant trends, but DCF shows significant correlation with radio leading by 610 days (see Fig. A.1). This correlation is due to a few radio data points in the beginning of the light curve with rather small uncertainties. Subtracting the polynomial fitted to radio light curve does not reduce the rms of the optical light curve at all. Also this method does not find connection between the optical and radio bands.
RGB 0136+591: one of the faintest radio sources, while in the optical the average flux density is above the median. In the radio band the modulation index calculation failed due to large uncertainties and faintness of the source. The optical light curve has a significant decreasing trend, while the radio light curve does not show any significant trend. This is in agreement with the results from simulated light curves, where in only two cases out of 1000 a significant trend occurs in the radio band. In the polynomial fitting, this was one of the few sources for which adding higher order polynomial did not improve the fit significantly, that is, a straight line was the best fit for the radio light curve (see Fig. A.2).
3C 66A: one of the brightest sources in both bands. The optical light curve is characterized by fast variability, while in the radio band the variability is clearly slower. In both light curves there is a highly significant decreasing trend. As discussed in Sect. 4.3, the time lag of 860 days (radio leading) is caused by the large radio flare in the beginning of the light curve (see Fig. A.3). However, visually it seems that the two bands correlate on long time scales with optical leading the radio, but this peak has significance of ~ 2σ only in the DCF plot. The result is in agreement with previous correlation studies (e.g. Hanski et al. 2002). It is also evident that our simplistic method to define the fraction of common radio-optical component to the optical light curve fails, because the ratio of the amplitudes of the flares in optical and radio is clearly variable.
1ES 0229+200: the faintest source in our optical sample, resulting in failing calculation of the modulation index for the source. The source is also one of the weakest sources in the radio band in our sample. Still the radio light curve shows significant increasing trend, while in the optical light curve the increasing trend is significant only at 99.9% significance level. Our polynomial subtraction method decreases the rms of the optical light curve very little, which is probably due to large uncertainty in the optical data. Visually the shape of the polynomial seems to trace the general shape of the optical light curve (see Fig. A.4).
HB89 0317+185: one of the weakest sources of the sample in the optical, while the radio flux density is above the median of the sample. The optical light curve shows significant decreasing trend, while the radio light curve shows significant increasing trend. Also DCF finds no significant correlation between the two bands, and therefore it is not surprising that our polynomial subtraction method does not decrease the rms much. We note that the optical light curve is poorly sampled compared to most other sources in our sample (see Fig. A.5).
1ES 0414+009: the source is rather weak in both bands. Both light curves show no trend, but DCF shows a significant correlation with radio leading optical by 20 days. Visually it appears that the correlation is a result of a common long term behaviour, rather than correlated flares. With the trend changing direction within the studied period, the trend analysis fails, but instead the polynomial subtraction is successful and we find that at least ~ 50% of the flux in optical originates from the common slowly varying optical-radio component (see Fig. A.6).
1ES 0502+675: the source is the weakest radio source in our sample and therefore the calculation of the modulation index fails. Thus, we perform no DCF analysis for this source. In the optical the source shows clear outbursts and a highly significant decreasing trend (see Fig. A.7).
VER 0521+211: the source is rather bright both in the optical and radio bands, and shows common increasing trend, as well as significant correlation with optical leading by 110 days. There are several 3σ points in the correlation plot and actually these points form rather flat plateaus than single peaks, indicating that the correlation is probably due to common trend rather than correlated flares (see Fig. A.8). Subtracting the polynomial fit of the radio light curve from optical light curve shows that ~ 50% of the optical flux originates from the common radio-optical component (which should be considered as lower limit, see main text).
VER 0648+152: weak optical and radio source (see Fig. A.9), and for the radio the modulation index calculation fails due to large uncertainties and low measured flux density. However, we find significant increasing trend in both bands. This is particularly puzzling as the simulations indicate that no significant trends are expected in radio. Visual inspection supports the result of the trend analysis as does the polynomial fitting to the radio data. We suggest that the problem with the modulation index calculation and simulated light curves arises from the overestimation of the uncertainties in the radio band. However, due to this disagreement between real data and simulations, we exclude the source from further analysis.
1ES 0647+250: the optical light curve shows clear outbursts and significant increasing trend. In radio the source is rather weak, but the increasing trend is significant also in this band. As discussed in Sect. 4.3., the positive correlation found in DCF analysis, with time lag of 1030 days, is due to this common trend rather than correlated flares. The polynomial subtraction suggests that at least ~ 10% of the optical flux would originate from common optical-radio component (see Fig. A.10).
S5 0716+714: the average flux densities in the optical and radio are the second highest of the sample and the modulation indices are the highest of the sample in both bands. The variability is fast and visually there is no clear connection between the two bands, which is also supported by our analysis methods finding no connection in flaring activity nor long-term behaviour. The study of Raiteri et al. (2003) found varying long-term trend from the optical light curves with a characteristic time scale of about 3.3 yr, while a longer period of 5.5−6 yr was found to characterize the radio long-term variations. Villata et al. (2008) concludes that major optical outbursts may have modest radio counterparts (at least in 37 GHz) and thus, the optically-emitting jet region is sometimes not completely opaque to the high radio frequencies, while lower frequencies are at least partially absorbed and a delay is observed. In recent study by Ramakrishnan et al. (2016) significant correlation was found between 95 GHz radio and optical data (but not 37 GHz and optical), which further supports this conclusion.
Our analysis is not optimal for finding periodicities, although one would naively expect them to result in trends, and we find no significant correlation. Therefore, we cannot confirm the results from these previous studies, but this might simply suggests that methods adopted here are too simplistic for the case of S5 0716+714 (see Fig. A.11).
1ES 0806+524: this source is close to the median flux density of the sample in both wavebands. Both light curves show very little variability before MJD 55 400, after which there is a clear outburst in both wavebands. The peak in the optical is reached ~200 days before the peak in radio, but due to a gap in the optical light curve we cannot exclude the possibility of a second peak at the time of the radio maxima. After the outburst the optical flux density steadily decreases and no significant trend is found in our trend analysis. DCF finds a significant correlation with optical leading radio by 110 days. In Aleksić et al. (2015b) short period around the optical flare was studied and no correlation found. The shape of the polynomial fitted to the radio light curve visually resembles the shape of the optical light curve very well, but as for 3C 66A, the ratio of the amplitudes of optical and radio outbursts is variable (see Fig. A.12) and therefore the subtraction of the polynomial does not decrease the rms of the optical light curve significantly.
RGB 0847+115: among the weakest sources in our sample in both optical and radio. The calculation of the radio modulation index fails. The linear regression does not find significant trend in the radio light curve, but the polynomial fit does favour second order polynomial with decreasing trend. As such trend is clearly present in optical light curve, subtracting the “polynomial” (which in this case is just a line) decreases the rms of the optical light curve significantly. We note that the light curves of this source have a few data points compared to other sources, as it was added to monitoring programs only after the Fermi-LAT detection (see Fig. A.13).
1ES 1011+496: this source is close to the median flux density of the sample in both wavebands. The radio light curve shows little variability, but a clear decreasing trend. The modulation index of the optical light curve is much larger, but in addition to the short-term variability, the source also shows highly significant decreasing trend. The DCF analysis shows several peaks and is actually rather flat, suggesting that the correlation is probably due to common decreasing trend of the light curves rather than correlated flares. As shown in Figs. 6 and A.14, for this source the polynomial subtraction method works rather well and suggest that at least ~ 25% of the flux comes from common optical-radio emission component.
Mrk 421: the brightest optical source in our sample with rather large modulation index. Both light curves show clear outbursts that visually seem correlated which is confirmed by the DCF analysis (see Fig. A.15). Both light curves also show significant increasing trend and polynomial subtraction suggests that at least ~ 50% of the optical flux originates from common optical-radio component. For this source a significant correlation is also found between the radio and γ-ray light curves, when the largest extreme flare in 2012 is studied (Hovatta et al. 2015). The γ-ray variations lead the radio by 40−70 days, which is consistent with the delay of − 60 days obtained between our radio and optical light curves. The visibility gap in the optical light curve hinders a more detailed study of the 2012 flare in the optical band.
Mrk 180: the source is close to the median flux density of the sample in both optical and radio bands. Very significant (highest significance within our sample) increasing trends extending through several years are found in both optical and radio light curves. Besides this, both light curves show flares. However, the DCF curve is really flat, with several subsequent points above 3σ, suggesting that the significant correlation we find is mainly due to common trend seen in the optical and radio light curves. It seems that all four visually identified optical flares have also counterpart in the radio light curve (see Fig. A.16), which might indicate that all of the optical emission (also the fast flares) in the studied period originates from the same emission region as the radio emission. Our polynomial subtraction indicates that at least ~ 50% of the optical emission originates from this region.
RGB 1136+676: one of the faintest sources in our sample both in the radio and optical. The light curves show no trends and no correlated variability (see Fig. A.17). Accordingly the rms of the optical light curve does not improve with the subtraction of the polynomial.
ON 325: the average brightness in both bands are above the median and light curves show clear outbursts. Visually, the light curves seem to show an anti-correlation (see Fig. A.18) instead of a correlation with the radio flux density increasing when the optical is decreasing. Our analysis finds no common trend and DCF reveals no significant peaks and is therefore in agreement with this visual impression. Interestingly, at the time of the γ-ray flare observed by Fermi-LAT (around MJD 54 700 Abdo et al. 2010b) there was a major decaying outburst in the radio (gap in the optical light curve), while during the Very High Energy γ-ray detection by MAGIC (around MJD 55 570 Aleksić et al. 2012a), there was an major outburst in the optical, but not in the radio. In Aleksić et al. (2012a) it was suggested, based on optical polarization degree dropping during the optical flare, that there are two components (one variable and one presenting a standing shock) contributing to the optical emission. However, in the present work, we do not find signatures that would link one of these regions with the radio core, the polynomial subtraction does not decrease the rms of the optical light curve. It could be that also in the radio band there are multiple emission regions contributing and our simple method fails to discriminate them.
1ES 1218+304: one of the faintest radio sources and also in the optical band the average flux density is below the median. Visually both light curves show increasing trends until MJD 55 800, after which the flux density begins to decrease in both bands (see Fig. A.19). Due to this change of direction, the trend analysis shows no significant trend in the optical. However, the DCF analysis shows a clear correlation between the two with the optical leading by 50 days. The correlation is a result of these common trends in the light curves, rather than correlated flares. The polynomial subtraction suggests that at least ~ 50% of the optical flux originates from common radio-optical component.
ON 231: the average brightness in both bands is above the median of the sample, and the light curves show clear outbursts. Visually the outbursts do not appear correlated and while the optical light curve shows highly significant decreasing trend, the radio light curve shows an increasing trend. DCF analysis finds no significant correlation (see Fig. A.20). In summary, the visual appearance and obtained results are very similar to those of ON 325. According to our light curves, the detection of a strong VHE γ-ray flare (MJD 54 625, Acciari et al. 2009) took place just after the peak of a major optical flare (brightest in our light curve covering six years of data). There is no obvious radio counterpart for this flare. Recently, in Sorcia et al. (2014), it was suggested based on optical polarization data, that there are two emission components contributing to optical emission. As for ON 325, we do not find signatures (and the polynomial subtraction does not decrease the rms of the optical light curve), that would link one of these components with the radio emission and we suggest that this might be due to a more complex emission pattern.
PG 1424+240: a significant increasing trends extending through several years is found in both optical and radio light curves. In addition the optical light curve shows several fast outburst, the one starting around MJD 55 600 is marginally visible in the radio light curve. In Aleksić et al. (2014a) it was concluded that optical emission originates in two components, one connected to variable high energy emission and one to 15 GHz VLBA core. For the study presented here, we have added two more years of data, which increases the significance of the radio trend and decreases that of the optical, but both remain significant. We find no significant correlation in the DCF analysis and also rather surprisingly the subtraction of the polynomial fit does not decrease the rms of the optical light curve (see Fig. A.21).
1ES 1426+428: one of the faintest sources in both bands showing moderate variability in both bands. The surprisingly large modulation index in the radio band is possibly artefact of the few outliers. There is no significant trend in the radio data, we find no significant correlation between optical and radio light curves and polynomial subtraction does not improve the rms of the optical light curve (see Fig. A.22).
PG 1553+113: the source is one of the brightest in the optical band while in radio its average flux density is around the median of the sample. The optical light curve shows several clear outbursts and the modulation index is large, while in radio the appearance of the light curve is smoother and modulation index small. In the beginning of both light curves there seems to be a decreasing trend ending around MJD 55 200 (see Fig. A.23). Analysis of Ackermann et al. (2015) revealed a two-year periodicity in the γ-ray light curve and visually this periodicity is apparent also in our light curves. As discussed in the case of S5 0716+714, our analysis methods are not optimal for looking at periodicities. However, our results (no significant trend, significant correlation) are in agreement with the short period of the suggested periodicity. During the latest optical outburst (starting MJD 55 900), which showed high very high energy γ-ray flux (Cortina 2012a,b; Aliu et al. 2015; Abramowski et al. 2015; Aleksić et al. 2015c), the radio outburst is clearly delayed compared to the optical one, which is in agreement with the scenario we suggest, where some optical outbursts occur closer to the central engine (where 15 GHz emission is still self-absorbed) and are associated with VHE γ-ray emission. In this case, the delayed radio outburst is caused when the emission region propagates down the jet and becomes transparent to radio emission. We suggest that this wider shape of the radio outbursts is also the reason why the polynomial subtraction did not decrease the rms of the optical light curve, even when we shifted it with 200 days like suggested by the DCF analysis.
Mrk 501: the source is one of the brightest ones in the radio and optical bands, but shows only modest variability resulting in the lowest modulation indices of the sample. Visual inspection of the radio and optical light curves shows a decreasing trend starting ~MJD 55 500, which is confirmed by our trend analysis showing significant decreasing trends for both bands. The outburst around MJD 55 400 is visible both in the radio and optical, and in general the two light curves follow the same patterns. However, the DCF analysis does not reveal a significant correlation. As discussed earlier, this might be due to multiple timescales in the light curve, producing two 2σ peaks (see Fig. A.24). This seems to be also the reason why the polynomial subtraction is only mildly successful in reducing the rms of the optical light curve. It suggests that at least ~ 20% of the optical flux would originate from common radio-optical component. Still, it is apparent that the emission in these two bands originates largely from the same emission region. Being one of the brightest VHE γ-ray sources, it has been extensively monitored in the VHE γ band, and correlation analyses have not revealed any correlation between the optical and VHE γ-rays (e.g. Furniss et al. 2015). However, Doert et al. (2013) found a rotation of the optical polarization angle associated with the VHE γ-ray flare, revealing that small fraction of the optical emission does originate from the VHE γ-ray emitting region, but the flux density from this region is very small compared to the other components contributing in the optical.
H 1722+118: faint radio source with large amplitude optical outbursts. Visual inspection suggests an increasing trend in the radio light curve starting around MJD 56 000 and decreasing before it, resulting in no significant trend in our trend analysis (see Fig. A.25). There is a significant correlation between the two bands, and in the absence of flares in the radio light curve, it seems to be a result of slow variability common in the two bands. However, the polynomial subtraction does not decrease the rms of the optical light curve significantly. In addition to the increasing trend, the optical light curve shows very sharp optical flares, which are probably associated with much more compact emission region and therefore possibly also with the VHE γ-ray emission. This is supported by the discovery of VHE γ-ray emission during an optical flare in spring 2013 (Ahnen et al. 2016b).
1ES 1727+502: the source is rather weak with mean flux density below the median flux density of the sample in both optical and radio bands. Both light curves show significant increasing flux density trend throughout the period. There are two major optical outburst in the source, around MJD 55 350 and MJD 56 300, which are visible also in the radio light curve, and DCF finds a significant correlation between the two bands (see Fig. A.26). At the time of the detection of VHE γ-rays from the source (Aleksić et al. 2014c), there is no flare in optical or radio. Therefore, it seems that for this source a major part of the optical emission originates from same region as the radio emission. The polynomial subtraction suggests that at least ~ 33% originates from common region.
1ES 1741+196: the source is close to the median flux density of the sample in both optical and radio band, but shows very little variability. In the optical the modulation index is the smallest of the sample and in radio among the smallest of the sample together with Mrk 501 and HB89 0317+185. Visually, there seems to be an increasing trend in the end of the radio light curve, and almost a 3σ peak in the DCF with a delay of ~250 days (see Fig. A.27). polynomial subtraction does not decrease the rms of the optical light curve.
1ES 1959+650: visual inspection of the light curves reveals similar flaring behaviour in the radio and optical band with quasi-simultaneous outbursts starting around MJD 54 900, 55 350, 55 700, 56 200 and 56 500 (see Fig. A.28). The linear regression analysis shows a highly significant flux density increase in both radio and optical bands throughout the observing period, but similarly to Mrk 501 the DCF does not find a significant correlation. This is probably due to multiple time scales as well as varying ratio of the amplitude of the outbursts. The polynomial subtraction suggests that at least ~ 15% the optical flux would originate from common emission component.
MAGIC J2001+439: the common decreasing trend and significant correlation between the radio and optical bands found in (Aleksić et al. 2014b) are confirmed by our results using slightly more data (see Fig. A.29). The flat DCF curve, with many subsequent data points above 3σ limit, suggests that the correlation is due to common decreasing trend. Also the polynomial subtraction suggests that at least ~ 50% of the optical flux would originate from common radio-optical emission region.
BL Lac: this source has been studied previously in numerous large multiwavelength campaigns, the longest of which cover data from 1968 to 2003 (Villata et al. 2004), revealing significant periodicy of approximately eight years in the radio light curves. The average radio flux density of this source is an order of magnitude larger than the mean average flux density of the sample and is by far the brightest radio source in our sample. Also the optical flux density is one of the highest in the sample. Both light curves show fast and large amplitude variability and correspondingly the modulation indices are among the largest for the sample. Both light curves reveal highly significant increasing trends, which could be a result of a slowly varying component. In agreement with Villata et al. (2004), the visual inspection does not reveal evident connection between the radio and optical outbursts, but the correlation analysis suggests a significant correlation with time lag of 540 days (optical leading). Villata et al. (2004) concluded that there are two radio components soft and hard, such that only the hard components have optical counterparts. This conclusion is further supported by a recent study, where significant correlation is found between 95 GHz and optical, but not 37 GHz and optical (Ramakrishnan et al. 2016). As one would expect, at 15 GHz the outbursts are mainly soft bursts, and as we find a significant correlation, our result may conflict with this model. However, we note, as in the case of S5 0716+714, that our methods might be too simplistic for these two extremely variable sources that clearly differ from the other sources in our sample (see Fig. A.30).
B3 2247+381: one of the faintest sources in the sample both in radio and optical band. There is a clear optical high state
between MJD 55 380 and 55 600, during which the source was discovered in VHE γ-rays (Aleksić et al. 2012b), but there is no clear high state in radio during this period. Polynomial subtraction suggests that at least ~ 15% of the optical emission originates from the common optical-radio emitting region. The DCF suggests a correlation with optical leading by 90 days (see Fig. A.31).
1ES 2344+514: the radio flux density is close to median for this sample, while the optical flux density is one of the faintest in our sample. The visual inspection of the radio light curve shows slowly increasing flux density starting ~MJD 54 850 and continuing for ~1000 days. The same increasing trend is also visually present in the optical light curve (see Fig. A.32). The trend analysis shows a highly significant trend in both light curves and the DCF shows a significant correlation with optical leading by 70 days. Similarly, as for Mrk 501 and 1ES 1959+650, we suggest that for this source, the optical emission originates from the same regions as the radio emission (polynomial subtraction gives lower limit of ~ 25%), with no clear association to the VHE γ-ray emitting region.
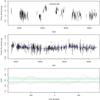 |
Fig. A.1 Optical R-band light curve (top) and radio 15 GHz light curve (middle) of 1ES 0033+595. The solid blue line in middle panel shows the polynomial fit to radio data, which is subtracted from the optical light curve to estimate the contribution of the slowly varying component to optical flux. The bottom panel shows the results of the DCF study; the green, blue and red lines representing the 1σ, 2σ and 3σ significance limits, respectively. |
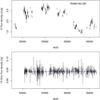 |
Fig. A.2 Optical R-band light curve (top) and radio 15 GHz light curve (bottom) of RGB 0136+391. The solid blue line in the bottom panel shows the polynomial fit to the radio data. As the modulation index for radio data could not be determined, no DCF analysis was performed. |
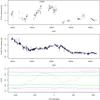 |
Fig. A.3 Optical R-band light curve (top) and radio 15 GHz light curve (middle) of 3C 66A. The solid blue line in middle panel shows the polynomial fit to radio data, which is subtracted from the optical light curve to estimate the contribution of the slowly varying component to optical flux. The bottom panel shows the results of the DCF study; the green, blue and red lines representing the 1σ, 2σ and 3σ significance limits, respectively. |
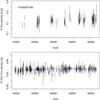 |
Fig. A.4 Optical R-band light curve (top) and radio 15 GHz light curve (bottom) of 1ES 0229+200. The solid blue line in the bottom panel shows the polynomial fit to the radio data. As the modulation index for radio data could not be determined, no DCF analysis was performed. |
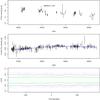 |
Fig. A.5 Optical R-band light curve (top) and radio 15 GHz light curve (middle) of HB89 0317+185. The solid blue line in middle panel shows the polynomial fit to radio data, which is subtracted from the optical light curve to estimate the contribution of the slowly varying component to optical flux. The bottom panel shows the results of the DCF study; the green, blue and red lines representing the 1σ, 2σ and 3σ significance limits, respectively. |
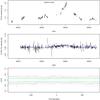 |
Fig. A.6 Optical R-band light curve (top) and radio 15 GHz light curve (middle) of 1ES 0414+009. The solid blue line in middle panel shows the polynomial fit to radio data, which is subtracted from the optical light curve to estimate the contribution of the slowly varying component to optical flux. The bottom panel shows the results of the DCF study; the green, blue and red lines representing the 1σ, 2σ and 3σ significance limits, respectively. |
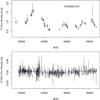 |
Fig. A.7 Optical R-band light curve (top) and radio 15 GHz light curve (bottom) of 1ES 0502+675. The solid blue line in the bottom panel shows the polynomial fit to the radio data. As the modulation index for radio data could not be determined, no DCF analysis was performed. |
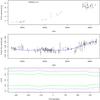 |
Fig. A.8 Optical R-band light curve (top) and radio 15 GHz light curve (middle) of VER J0521+211. The solid blue line in middle panel shows the polynomial fit to radio data, which is subtracted from the optical light curve to estimate the contribution of the slowly varying component to optical flux. The bottom panel shows the results of the DCF study; the green, blue and red lines representing the 1σ, 2σ and 3σ significance limits, respectively. |
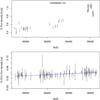 |
Fig. A.9 Optical R-band light curve (top) and radio 15 GHz light curve (bottom) of VER J0648+152. The solid blue line in the bottom panel shows the polynomial fit to the radio data. As the modulation index for radio data could not be determined, no DCF analysis was performed. |
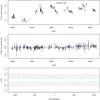 |
Fig. A.10 Optical R-band light curve (top) and radio 15 GHz light curve (middle) of 1ES 0647+250. The solid blue line in middle panel shows the polynomial fit to radio data, which is subtracted from the optical light curve to estimate the contribution of the slowly varying component to optical flux. The bottom panel shows the results of the DCF study; the green, blue and red lines representing the 1σ, 2σ and 3σ significance limits, respectively. |
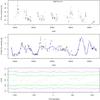 |
Fig. A.11 Optical R-band light curve (top) and radio 15 GHz light curve (middle) of S5 0716+714. The solid blue line in middle panel shows the polynomial fit to radio data, which is subtracted from the optical light curve to estimate the contribution of the slowly varying component to optical flux. The bottom panel shows the results of the DCF study; the green, blue and red lines representing the 1σ, 2σ and 3σ significance limits, respectively. |
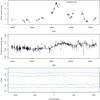 |
Fig. A.12 Optical R-band light curve (top) and radio 15 GHz light curve (middle) of 1ES 0806+524. The solid blue line in middle panel shows the polynomial fit to radio data, which is subtracted from the optical light curve to estimate the contribution of the slowly varying component to optical flux. The bottom panel shows the results of the DCF study; the green, blue and red lines representing the 1σ, 2σ and 3σ significance limits, respectively. |
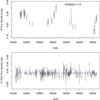 |
Fig. A.13 Optical R-band light curve (top) and radio 15 GHz light curve (bottom) of RGB 0847+115. The solid blue line in the bottom panel shows the polynomial fit to the radio data. As the modulation index for radio data could not be determined, no DCF analysis was performed. |
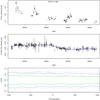 |
Fig. A.14 Optical R-band light curve (top) and radio 15 GHz light curve (middle) of 1ES 1011+496. The solid blue line in middle panel shows the polynomial fit to radio data, which is subtracted from the optical light curve to estimate the contribution of the slowly varying component to optical flux. The bottom panel shows the results of the DCF study; the green, blue and red lines representing the 1σ, 2σ and 3σ significance limits, respectively. |
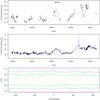 |
Fig. A.15 Optical R-band light curve (top) and radio 15 GHz light curve (middle) of Mkn 421. The solid blue line in middle panel shows the polynomial fit to radio data, which is subtracted from the optical light curve to estimate the contribution of the slowly varying component to optical flux. The bottom panel shows the results of the DCF study; the green, blue and red lines representing the 1σ, 2σ and 3σ significance limits, respectively. |
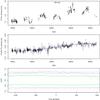 |
Fig. A.16 Optical R-band light curve (top) and radio 15 GHz light curve (middle) of Mkn 180. The solid blue line in middle panel shows the polynomial fit to radio data, which is subtracted from the optical light curve to estimate the contribution of the slowly varying component to optical flux. The bottom panel shows the results of the DCF study; the green, blue and red lines representing the 1σ, 2σ and 3σ significance limits, respectively. |
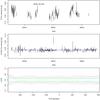 |
Fig. A.17 Optical R-band light curve (top) and radio 15 GHz light curve (middle) of RGB 1136+676. The solid blue line in middle panel shows the polynomial fit to radio data, which is subtracted from the optical light curve to estimate the contribution of the slowly varying component to optical flux. The bottom panel shows the results of the DCF study; the green, blue and red lines representing the 1σ, 2σ and 3σ significance limits, respectively. |
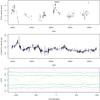 |
Fig. A.18 Optical R-band light curve (top) and radio 15 GHz light curve (middle) of ON 325. The solid blue line in middle panel shows the polynomial fit to radio data, which is subtracted from the optical light curve to estimate the contribution of the slowly varying component to optical flux. The bottom panel shows the results of the DCF study; the green, blue and red lines representing the 1σ, 2σ and 3σ significance limits, respectively. |
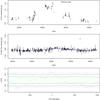 |
Fig. A.19 Optical R-band light curve (top) and radio 15 GHz light curve (middle) of 1ES 1218+304. The solid blue line in middle panel shows the polynomial fit to radio data, which is subtracted from the optical light curve to estimate the contribution of the slowly varying component to optical flux. The bottom panel shows the results of the DCF study; the green, blue and red lines representing the 1σ, 2σ and 3σ significance limits, respectively. |
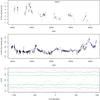 |
Fig. A.20 Optical R-band light curve (top) and radio 15 GHz light curve (middle) of ON 231. The solid blue line in middle panel shows the polynomial fit to radio data, which is subtracted from the optical light curve to estimate the contribution of the slowly varying component to optical flux. The bottom panel shows the results of the DCF study; the green, blue and red lines representing the 1σ, 2σ and 3σ significance limits, respectively. |
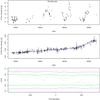 |
Fig. A.21 Optical R-band light curve (top) and radio 15 GHz light curve (middle) of PG 1424+240. The solid blue line in middle panel shows the polynomial fit to radio data, which is subtracted from the optical light curve to estimate the contribution of the slowly varying component to optical flux. The bottom panel shows the results of the DCF study; the green, blue and red lines representing the 1σ, 2σ and 3σ significance limits, respectively. |
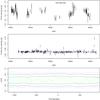 |
Fig. A.22 Optical R-band light curve (top) and radio 15 GHz light curve (middle) of 1ES 1426+428. The solid blue line in middle panel shows the polynomial fit to radio data, which is subtracted from the optical light curve to estimate the contribution of the slowly varying component to optical flux. The bottom panel shows the results of the DCF study; the green, blue and red lines representing the 1σ, 2σ and 3σ significance limits, respectively. |
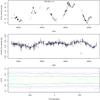 |
Fig. A.23 Optical R-band light curve (top) and radio 15 GHz light curve (middle) of PG 1553+113. The solid blue line in middle panel shows the polynomial fit to radio data, which is subtracted from the optical light curve to estimate the contribution of the slowly varying component to optical flux. The bottom panel shows the results of the DCF study; the green, blue and red lines representing the 1σ, 2σ and 3σ significance limits, respectively. |
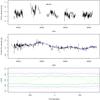 |
Fig. A.24 Optical R-band light curve (top) and radio 15 GHz light curve (middle) of Mkn 501. The solid blue line in middle panel shows the polynomial fit to radio data, which is subtracted from the optical light curve to estimate the contribution of the slowly varying component to optical flux. The bottom panel shows the results of the DCF study; the green, blue and red lines representing the 1σ, 2σ and 3σ significance limits, respectively. |
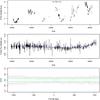 |
Fig. A.25 Optical R-band light curve (top) and radio 15 GHz light curve (middle) of H 1722+119. The solid blue line in middle panel shows the polynomial fit to radio data, which is subtracted from the optical light curve to estimate the contribution of the slowly varying component to optical flux. The bottom panel shows the results of the DCF study; the green, blue and red lines representing the 1σ, 2σ and 3σ significance limits, respectively. |
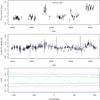 |
Fig. A.26 Optical R-band light curve (top) and radio 15 GHz light curve (middle) of 1ES 1727+502. The solid blue line in middle panel shows the polynomial fit to radio data, which is subtracted from the optical light curve to estimate the contribution of the slowly varying component to optical flux. The bottom panel shows the results of the DCF study; the green, blue and red lines representing the 1σ, 2σ and 3σ significance limits, respectively. |
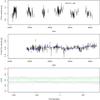 |
Fig. A.27 Optical R-band light curve (top) and radio 15 GHz light curve (middle) of 1ES 1741+196. The solid blue line in middle panel shows the polynomial fit to radio data, which is subtracted from the optical light curve to estimate the contribution of the slowly varying component to optical flux. The bottom panel shows the results of the DCF study; the green, blue and red lines representing the 1σ, 2σ and 3σ significance limits, respectively. |
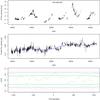 |
Fig. A.28 Optical R-band light curve (top) and radio 15 GHz light curve (middle) of 1ES 1959+650. The solid blue line in middle panel shows the polynomial fit to radio data, which is subtracted from the optical light curve to estimate the contribution of the slowly varying component to optical flux. The bottom panel shows the results of the DCF study; the green, blue and red lines representing the 1σ, 2σ and 3σ significance limits, respectively. |
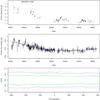 |
Fig. A.29 Optical R-band light curve (top) and radio 15 GHz light curve (middle) of MAGIC J2001+439. The solid blue line in middle panel shows the polynomial fit to radio data, which is subtracted from the optical light curve to estimate the contribution of the slowly varying component to optical flux. The bottom panel shows the results of the DCF study; the green, blue and red lines representing the 1σ, 2σ and 3σ significance limits, respectively. |
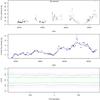 |
Fig. A.30 Optical R-band light curve (top) and radio 15 GHz light curve (middle) of BL Lac. The solid blue line in middle panel shows the polynomial fit to radio data, which is subtracted from the optical light curve to estimate the contribution of the slowly varying component to optical flux. The bottom panel shows the results of the DCF study; the green, blue and red lines representing the 1σ, 2σ and 3σ significance limits, respectively. |
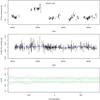 |
Fig. A.31 Optical R-band light curve (top) and radio 15 GHz light curve (middle) of B3 2247+381. The solid blue line in middle panel shows the polynomial fit to radio data, which is subtracted from the optical light curve to estimate the contribution of the slowly varying component to optical flux. The bottom panel shows the results of the DCF study; the green, blue and red lines representing the 1σ, 2σ and 3σ significance limits, respectively. |
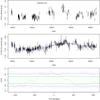 |
Fig. A.32 Optical R-band light curve (top) and radio 15 GHz light curve (middle) of 1ES 2344+514. The solid blue line in middle panel shows the polynomial fit to radio data, which is subtracted from the optical light curve to estimate the contribution of the slowly varying component to optical flux. The bottom panel shows the results of the DCF study; the green, blue and red lines representing the 1σ, 2σ and 3σ significance limits, respectively. |
Appendix B: Finding charts and calibrated magnitudes of comparison stars
For five sources the magnitudes of the comparison star were calibrated using the observations of stars with known magnitude from the same night. The stars are marked in the finding charts in Figs. B.1 and B.2. The R-band magnitudes are given in Tables B.1 and B.2. The estimation of the host galaxy fluxes contributing to the aperture of 5′′ are given in Table B.3.
Calibrated magnitudes of comparison stars in the R band.
Calibrated magnitudes of comparison stars in the R band.
Host galaxy fluxes.
 |
Fig. B.1 Finding charts for VER 0521+211 (top), VER J0648+152 (middle) and RGB0847+115 (bottom). The field of view of the finding charts is 12 arcmin. Stars 1−3 have been calibrated in this work (see Table B.1). The stars circled are used as comparison (continuous line) and control (dashed line) stars for the light curves in this work. |
 |
Fig. B.2 Finding charts for MAGIC J2001+439 (left) and B3 2247+381 (right).The field of view of the finding charts is 12 arcmin. Stars 1−4 and A−E have been calibrated in this work (see Table B.2). The stars circled are used as comparison (continuous line) and control (dashed line) stars for the light curves in this work. |
All Tables
All Figures
 |
Fig. 1 Average radio flux density versus the average optical flux density. The average flux densities in these two bands show strong correlation (> 4σ), the dotted line shows the best-fit for the correlation. The different symbols denote different source classes (HSPs, red circles; ISPs, blue rectangles). As expected, the ISP’s seem to be brighter in radio and optical bands. |
| In the text | |
 |
Fig. 2 Histogram of the intrinsic modulation indices |
| In the text | |
 |
Fig. 3 Modulation index at 15 GHz versus the modulation index at the optical R band for the sample sources (HSPs red circles, ISPs blue rectangles). The sources for which one of the modulation indices could not be determined were excluded from the plot. As expected the ISPs in general have larger modulation indices in optical and radio than HSPs. Therefore the indices between the two band show significant (> 3σ) correlation (see text). The dotted line shows the best linear fit to the data. |
| In the text | |
 |
Fig. 4 Histogram of the time lags between optical and radio light curves. A negative lag means that optical leads the radio variations. |
| In the text | |
 |
Fig. 5 Comparison of 15 GHz light curve (black filled circles) and VLBA 15 GHz core fluxes (blue triangles) from Lister et al. (2013) for 1ES 1011+496 (top) and 1ES 2344+514 (bottom). |
| In the text | |
 |
Fig. 6 Three steps to estimate the contribution from the slowly varying component to the optical light curves for Mkn 180 (top) 1ES 1011+496 (bottom). Left: the polynomial (red solid line) is fit to the radio light curve (green symbols). Middle: the polynomial is scaled to the same average flux density as the optical light curve and then multiplied with 0.1 (red crosses), 0.2, 0.3, ... 1.0 (red triangles). These polynomial-multiples are subtracted from the optical light curve. Right: the optical light curve from which the polynomial-multiple that minimizes the rms (blue line, 0.9 for Mkn 180 and 0.7 for 1ES 1011+496) has been subtracted (red) and the original optical data (green). |
| In the text | |
 |
Fig. A.1 Optical R-band light curve (top) and radio 15 GHz light curve (middle) of 1ES 0033+595. The solid blue line in middle panel shows the polynomial fit to radio data, which is subtracted from the optical light curve to estimate the contribution of the slowly varying component to optical flux. The bottom panel shows the results of the DCF study; the green, blue and red lines representing the 1σ, 2σ and 3σ significance limits, respectively. |
| In the text | |
 |
Fig. A.2 Optical R-band light curve (top) and radio 15 GHz light curve (bottom) of RGB 0136+391. The solid blue line in the bottom panel shows the polynomial fit to the radio data. As the modulation index for radio data could not be determined, no DCF analysis was performed. |
| In the text | |
 |
Fig. A.3 Optical R-band light curve (top) and radio 15 GHz light curve (middle) of 3C 66A. The solid blue line in middle panel shows the polynomial fit to radio data, which is subtracted from the optical light curve to estimate the contribution of the slowly varying component to optical flux. The bottom panel shows the results of the DCF study; the green, blue and red lines representing the 1σ, 2σ and 3σ significance limits, respectively. |
| In the text | |
 |
Fig. A.4 Optical R-band light curve (top) and radio 15 GHz light curve (bottom) of 1ES 0229+200. The solid blue line in the bottom panel shows the polynomial fit to the radio data. As the modulation index for radio data could not be determined, no DCF analysis was performed. |
| In the text | |
 |
Fig. A.5 Optical R-band light curve (top) and radio 15 GHz light curve (middle) of HB89 0317+185. The solid blue line in middle panel shows the polynomial fit to radio data, which is subtracted from the optical light curve to estimate the contribution of the slowly varying component to optical flux. The bottom panel shows the results of the DCF study; the green, blue and red lines representing the 1σ, 2σ and 3σ significance limits, respectively. |
| In the text | |
 |
Fig. A.6 Optical R-band light curve (top) and radio 15 GHz light curve (middle) of 1ES 0414+009. The solid blue line in middle panel shows the polynomial fit to radio data, which is subtracted from the optical light curve to estimate the contribution of the slowly varying component to optical flux. The bottom panel shows the results of the DCF study; the green, blue and red lines representing the 1σ, 2σ and 3σ significance limits, respectively. |
| In the text | |
 |
Fig. A.7 Optical R-band light curve (top) and radio 15 GHz light curve (bottom) of 1ES 0502+675. The solid blue line in the bottom panel shows the polynomial fit to the radio data. As the modulation index for radio data could not be determined, no DCF analysis was performed. |
| In the text | |
 |
Fig. A.8 Optical R-band light curve (top) and radio 15 GHz light curve (middle) of VER J0521+211. The solid blue line in middle panel shows the polynomial fit to radio data, which is subtracted from the optical light curve to estimate the contribution of the slowly varying component to optical flux. The bottom panel shows the results of the DCF study; the green, blue and red lines representing the 1σ, 2σ and 3σ significance limits, respectively. |
| In the text | |
 |
Fig. A.9 Optical R-band light curve (top) and radio 15 GHz light curve (bottom) of VER J0648+152. The solid blue line in the bottom panel shows the polynomial fit to the radio data. As the modulation index for radio data could not be determined, no DCF analysis was performed. |
| In the text | |
 |
Fig. A.10 Optical R-band light curve (top) and radio 15 GHz light curve (middle) of 1ES 0647+250. The solid blue line in middle panel shows the polynomial fit to radio data, which is subtracted from the optical light curve to estimate the contribution of the slowly varying component to optical flux. The bottom panel shows the results of the DCF study; the green, blue and red lines representing the 1σ, 2σ and 3σ significance limits, respectively. |
| In the text | |
 |
Fig. A.11 Optical R-band light curve (top) and radio 15 GHz light curve (middle) of S5 0716+714. The solid blue line in middle panel shows the polynomial fit to radio data, which is subtracted from the optical light curve to estimate the contribution of the slowly varying component to optical flux. The bottom panel shows the results of the DCF study; the green, blue and red lines representing the 1σ, 2σ and 3σ significance limits, respectively. |
| In the text | |
 |
Fig. A.12 Optical R-band light curve (top) and radio 15 GHz light curve (middle) of 1ES 0806+524. The solid blue line in middle panel shows the polynomial fit to radio data, which is subtracted from the optical light curve to estimate the contribution of the slowly varying component to optical flux. The bottom panel shows the results of the DCF study; the green, blue and red lines representing the 1σ, 2σ and 3σ significance limits, respectively. |
| In the text | |
 |
Fig. A.13 Optical R-band light curve (top) and radio 15 GHz light curve (bottom) of RGB 0847+115. The solid blue line in the bottom panel shows the polynomial fit to the radio data. As the modulation index for radio data could not be determined, no DCF analysis was performed. |
| In the text | |
 |
Fig. A.14 Optical R-band light curve (top) and radio 15 GHz light curve (middle) of 1ES 1011+496. The solid blue line in middle panel shows the polynomial fit to radio data, which is subtracted from the optical light curve to estimate the contribution of the slowly varying component to optical flux. The bottom panel shows the results of the DCF study; the green, blue and red lines representing the 1σ, 2σ and 3σ significance limits, respectively. |
| In the text | |
 |
Fig. A.15 Optical R-band light curve (top) and radio 15 GHz light curve (middle) of Mkn 421. The solid blue line in middle panel shows the polynomial fit to radio data, which is subtracted from the optical light curve to estimate the contribution of the slowly varying component to optical flux. The bottom panel shows the results of the DCF study; the green, blue and red lines representing the 1σ, 2σ and 3σ significance limits, respectively. |
| In the text | |
 |
Fig. A.16 Optical R-band light curve (top) and radio 15 GHz light curve (middle) of Mkn 180. The solid blue line in middle panel shows the polynomial fit to radio data, which is subtracted from the optical light curve to estimate the contribution of the slowly varying component to optical flux. The bottom panel shows the results of the DCF study; the green, blue and red lines representing the 1σ, 2σ and 3σ significance limits, respectively. |
| In the text | |
 |
Fig. A.17 Optical R-band light curve (top) and radio 15 GHz light curve (middle) of RGB 1136+676. The solid blue line in middle panel shows the polynomial fit to radio data, which is subtracted from the optical light curve to estimate the contribution of the slowly varying component to optical flux. The bottom panel shows the results of the DCF study; the green, blue and red lines representing the 1σ, 2σ and 3σ significance limits, respectively. |
| In the text | |
 |
Fig. A.18 Optical R-band light curve (top) and radio 15 GHz light curve (middle) of ON 325. The solid blue line in middle panel shows the polynomial fit to radio data, which is subtracted from the optical light curve to estimate the contribution of the slowly varying component to optical flux. The bottom panel shows the results of the DCF study; the green, blue and red lines representing the 1σ, 2σ and 3σ significance limits, respectively. |
| In the text | |
 |
Fig. A.19 Optical R-band light curve (top) and radio 15 GHz light curve (middle) of 1ES 1218+304. The solid blue line in middle panel shows the polynomial fit to radio data, which is subtracted from the optical light curve to estimate the contribution of the slowly varying component to optical flux. The bottom panel shows the results of the DCF study; the green, blue and red lines representing the 1σ, 2σ and 3σ significance limits, respectively. |
| In the text | |
 |
Fig. A.20 Optical R-band light curve (top) and radio 15 GHz light curve (middle) of ON 231. The solid blue line in middle panel shows the polynomial fit to radio data, which is subtracted from the optical light curve to estimate the contribution of the slowly varying component to optical flux. The bottom panel shows the results of the DCF study; the green, blue and red lines representing the 1σ, 2σ and 3σ significance limits, respectively. |
| In the text | |
 |
Fig. A.21 Optical R-band light curve (top) and radio 15 GHz light curve (middle) of PG 1424+240. The solid blue line in middle panel shows the polynomial fit to radio data, which is subtracted from the optical light curve to estimate the contribution of the slowly varying component to optical flux. The bottom panel shows the results of the DCF study; the green, blue and red lines representing the 1σ, 2σ and 3σ significance limits, respectively. |
| In the text | |
 |
Fig. A.22 Optical R-band light curve (top) and radio 15 GHz light curve (middle) of 1ES 1426+428. The solid blue line in middle panel shows the polynomial fit to radio data, which is subtracted from the optical light curve to estimate the contribution of the slowly varying component to optical flux. The bottom panel shows the results of the DCF study; the green, blue and red lines representing the 1σ, 2σ and 3σ significance limits, respectively. |
| In the text | |
 |
Fig. A.23 Optical R-band light curve (top) and radio 15 GHz light curve (middle) of PG 1553+113. The solid blue line in middle panel shows the polynomial fit to radio data, which is subtracted from the optical light curve to estimate the contribution of the slowly varying component to optical flux. The bottom panel shows the results of the DCF study; the green, blue and red lines representing the 1σ, 2σ and 3σ significance limits, respectively. |
| In the text | |
 |
Fig. A.24 Optical R-band light curve (top) and radio 15 GHz light curve (middle) of Mkn 501. The solid blue line in middle panel shows the polynomial fit to radio data, which is subtracted from the optical light curve to estimate the contribution of the slowly varying component to optical flux. The bottom panel shows the results of the DCF study; the green, blue and red lines representing the 1σ, 2σ and 3σ significance limits, respectively. |
| In the text | |
 |
Fig. A.25 Optical R-band light curve (top) and radio 15 GHz light curve (middle) of H 1722+119. The solid blue line in middle panel shows the polynomial fit to radio data, which is subtracted from the optical light curve to estimate the contribution of the slowly varying component to optical flux. The bottom panel shows the results of the DCF study; the green, blue and red lines representing the 1σ, 2σ and 3σ significance limits, respectively. |
| In the text | |
 |
Fig. A.26 Optical R-band light curve (top) and radio 15 GHz light curve (middle) of 1ES 1727+502. The solid blue line in middle panel shows the polynomial fit to radio data, which is subtracted from the optical light curve to estimate the contribution of the slowly varying component to optical flux. The bottom panel shows the results of the DCF study; the green, blue and red lines representing the 1σ, 2σ and 3σ significance limits, respectively. |
| In the text | |
 |
Fig. A.27 Optical R-band light curve (top) and radio 15 GHz light curve (middle) of 1ES 1741+196. The solid blue line in middle panel shows the polynomial fit to radio data, which is subtracted from the optical light curve to estimate the contribution of the slowly varying component to optical flux. The bottom panel shows the results of the DCF study; the green, blue and red lines representing the 1σ, 2σ and 3σ significance limits, respectively. |
| In the text | |
 |
Fig. A.28 Optical R-band light curve (top) and radio 15 GHz light curve (middle) of 1ES 1959+650. The solid blue line in middle panel shows the polynomial fit to radio data, which is subtracted from the optical light curve to estimate the contribution of the slowly varying component to optical flux. The bottom panel shows the results of the DCF study; the green, blue and red lines representing the 1σ, 2σ and 3σ significance limits, respectively. |
| In the text | |
 |
Fig. A.29 Optical R-band light curve (top) and radio 15 GHz light curve (middle) of MAGIC J2001+439. The solid blue line in middle panel shows the polynomial fit to radio data, which is subtracted from the optical light curve to estimate the contribution of the slowly varying component to optical flux. The bottom panel shows the results of the DCF study; the green, blue and red lines representing the 1σ, 2σ and 3σ significance limits, respectively. |
| In the text | |
 |
Fig. A.30 Optical R-band light curve (top) and radio 15 GHz light curve (middle) of BL Lac. The solid blue line in middle panel shows the polynomial fit to radio data, which is subtracted from the optical light curve to estimate the contribution of the slowly varying component to optical flux. The bottom panel shows the results of the DCF study; the green, blue and red lines representing the 1σ, 2σ and 3σ significance limits, respectively. |
| In the text | |
 |
Fig. A.31 Optical R-band light curve (top) and radio 15 GHz light curve (middle) of B3 2247+381. The solid blue line in middle panel shows the polynomial fit to radio data, which is subtracted from the optical light curve to estimate the contribution of the slowly varying component to optical flux. The bottom panel shows the results of the DCF study; the green, blue and red lines representing the 1σ, 2σ and 3σ significance limits, respectively. |
| In the text | |
 |
Fig. A.32 Optical R-band light curve (top) and radio 15 GHz light curve (middle) of 1ES 2344+514. The solid blue line in middle panel shows the polynomial fit to radio data, which is subtracted from the optical light curve to estimate the contribution of the slowly varying component to optical flux. The bottom panel shows the results of the DCF study; the green, blue and red lines representing the 1σ, 2σ and 3σ significance limits, respectively. |
| In the text | |
 |
Fig. B.1 Finding charts for VER 0521+211 (top), VER J0648+152 (middle) and RGB0847+115 (bottom). The field of view of the finding charts is 12 arcmin. Stars 1−3 have been calibrated in this work (see Table B.1). The stars circled are used as comparison (continuous line) and control (dashed line) stars for the light curves in this work. |
| In the text | |
 |
Fig. B.2 Finding charts for MAGIC J2001+439 (left) and B3 2247+381 (right).The field of view of the finding charts is 12 arcmin. Stars 1−4 and A−E have been calibrated in this work (see Table B.2). The stars circled are used as comparison (continuous line) and control (dashed line) stars for the light curves in this work. |
| In the text | |
Current usage metrics show cumulative count of Article Views (full-text article views including HTML views, PDF and ePub downloads, according to the available data) and Abstracts Views on Vision4Press platform.
Data correspond to usage on the plateform after 2015. The current usage metrics is available 48-96 hours after online publication and is updated daily on week days.
Initial download of the metrics may take a while.


