Free Access
Fig. 5
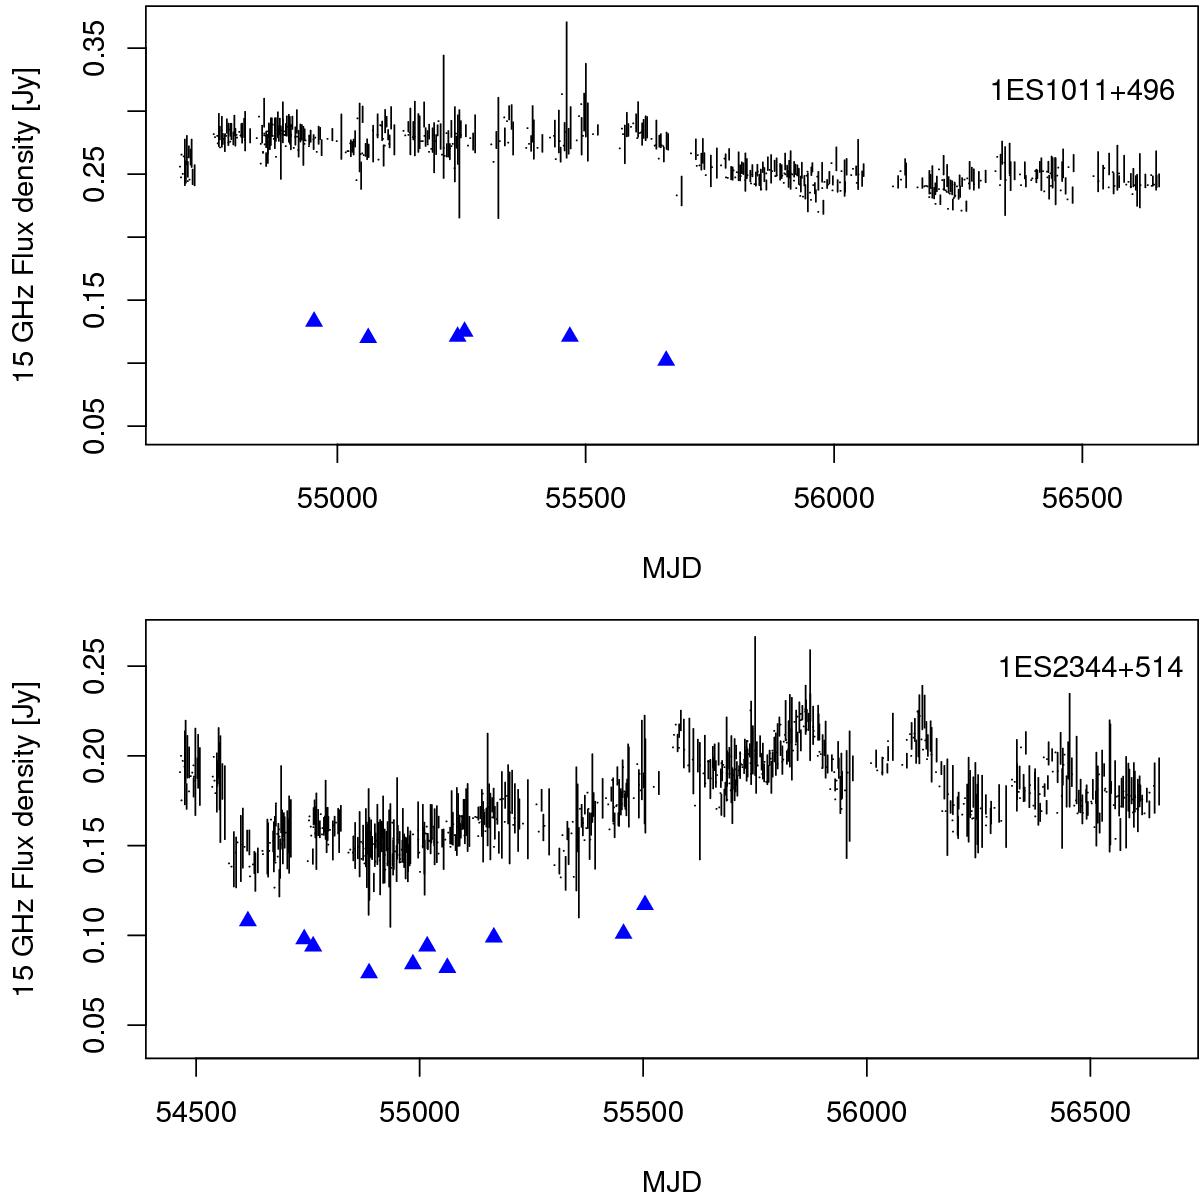
Comparison of 15 GHz light curve (black filled circles) and VLBA 15 GHz core fluxes (blue triangles) from Lister et al. (2013) for 1ES 1011+496 (top) and 1ES 2344+514 (bottom).
Current usage metrics show cumulative count of Article Views (full-text article views including HTML views, PDF and ePub downloads, according to the available data) and Abstracts Views on Vision4Press platform.
Data correspond to usage on the plateform after 2015. The current usage metrics is available 48-96 hours after online publication and is updated daily on week days.
Initial download of the metrics may take a while.