Free Access
Fig. A.7
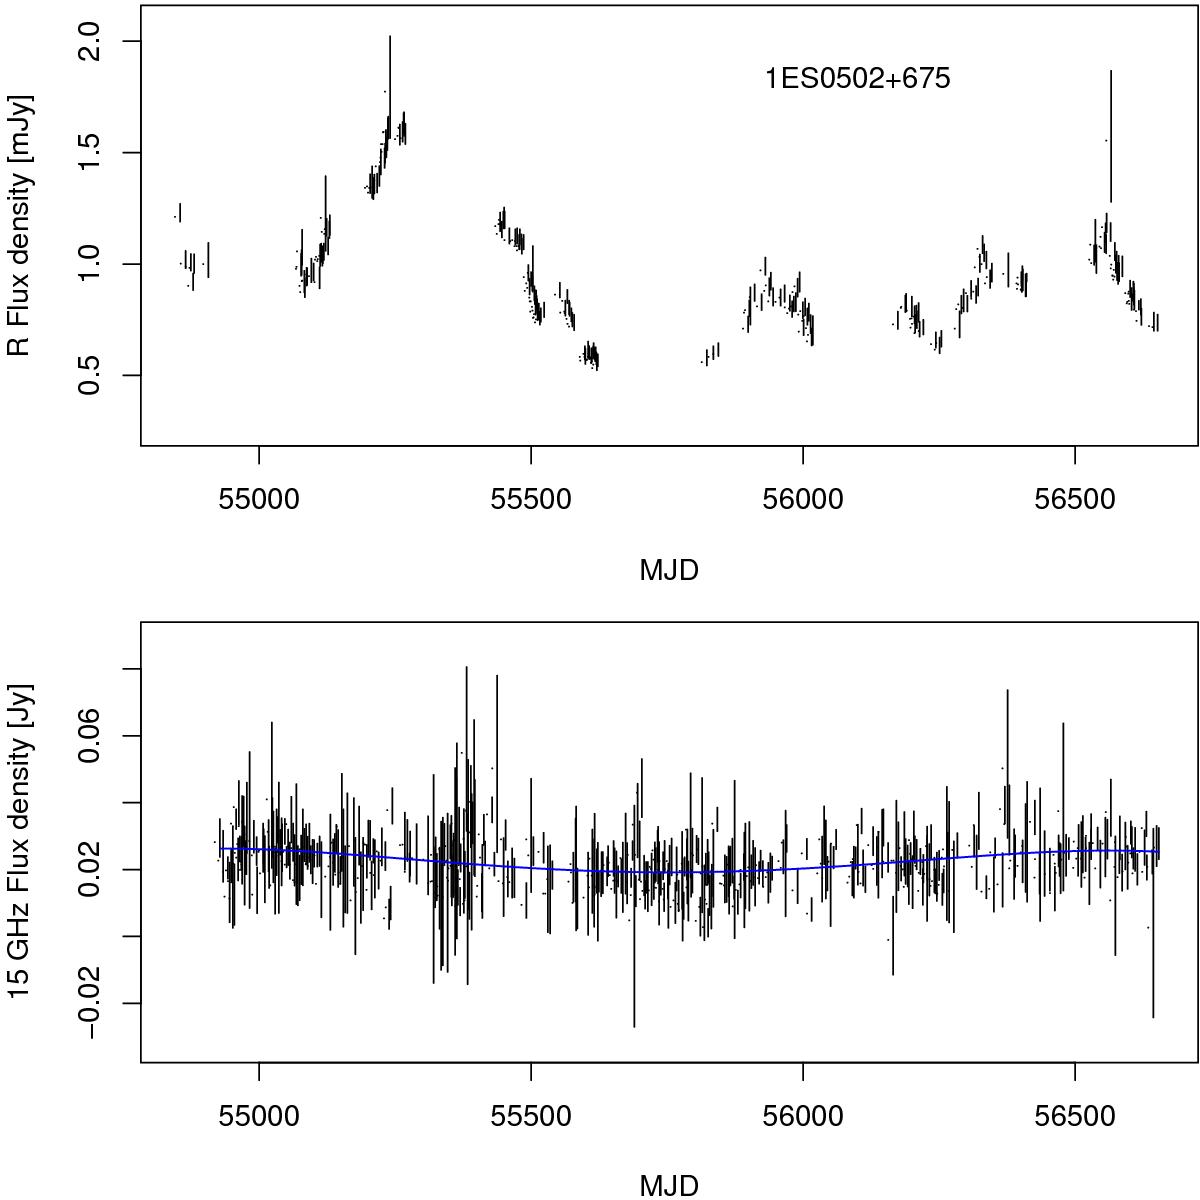
Optical R-band light curve (top) and radio 15 GHz light curve (bottom) of 1ES 0502+675. The solid blue line in the bottom panel shows the polynomial fit to the radio data. As the modulation index for radio data could not be determined, no DCF analysis was performed.
Current usage metrics show cumulative count of Article Views (full-text article views including HTML views, PDF and ePub downloads, according to the available data) and Abstracts Views on Vision4Press platform.
Data correspond to usage on the plateform after 2015. The current usage metrics is available 48-96 hours after online publication and is updated daily on week days.
Initial download of the metrics may take a while.