Fig. 3
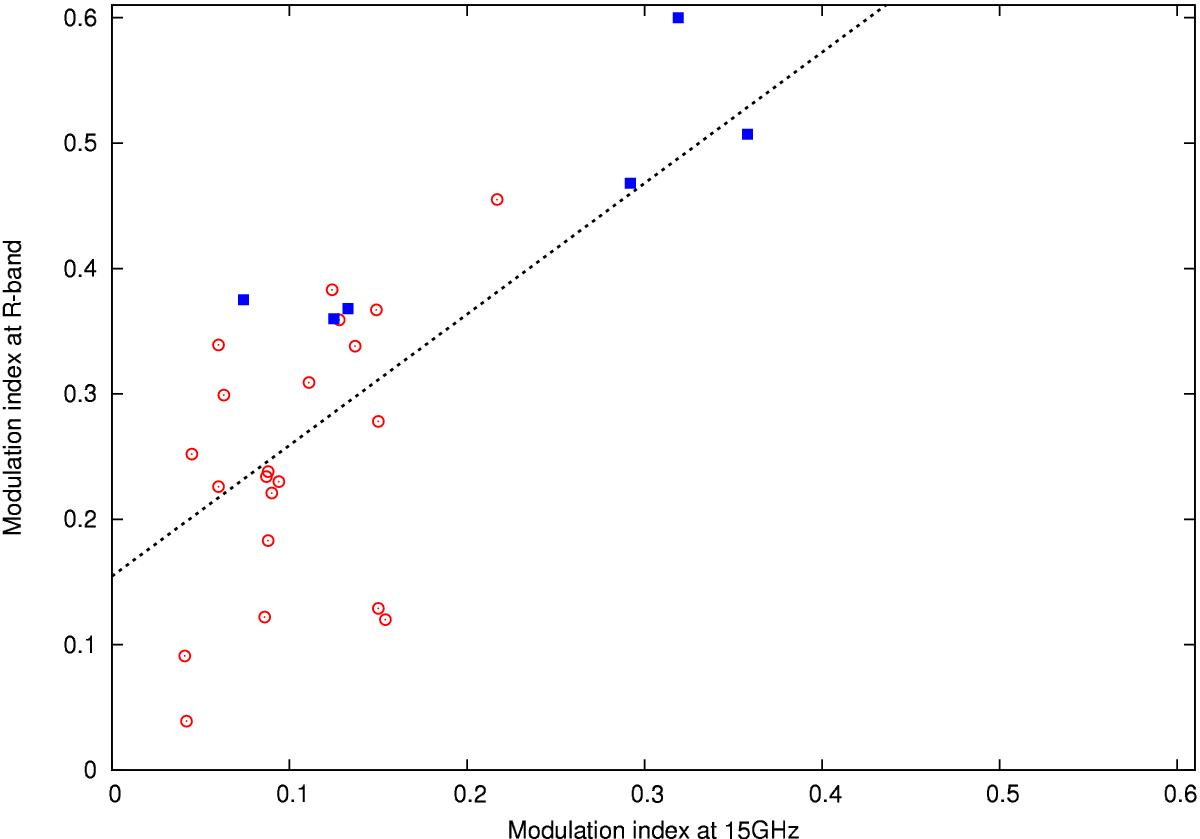
Modulation index at 15 GHz versus the modulation index at the optical R band for the sample sources (HSPs red circles, ISPs blue rectangles). The sources for which one of the modulation indices could not be determined were excluded from the plot. As expected the ISPs in general have larger modulation indices in optical and radio than HSPs. Therefore the indices between the two band show significant (> 3σ) correlation (see text). The dotted line shows the best linear fit to the data.
Current usage metrics show cumulative count of Article Views (full-text article views including HTML views, PDF and ePub downloads, according to the available data) and Abstracts Views on Vision4Press platform.
Data correspond to usage on the plateform after 2015. The current usage metrics is available 48-96 hours after online publication and is updated daily on week days.
Initial download of the metrics may take a while.