Fig. A.16
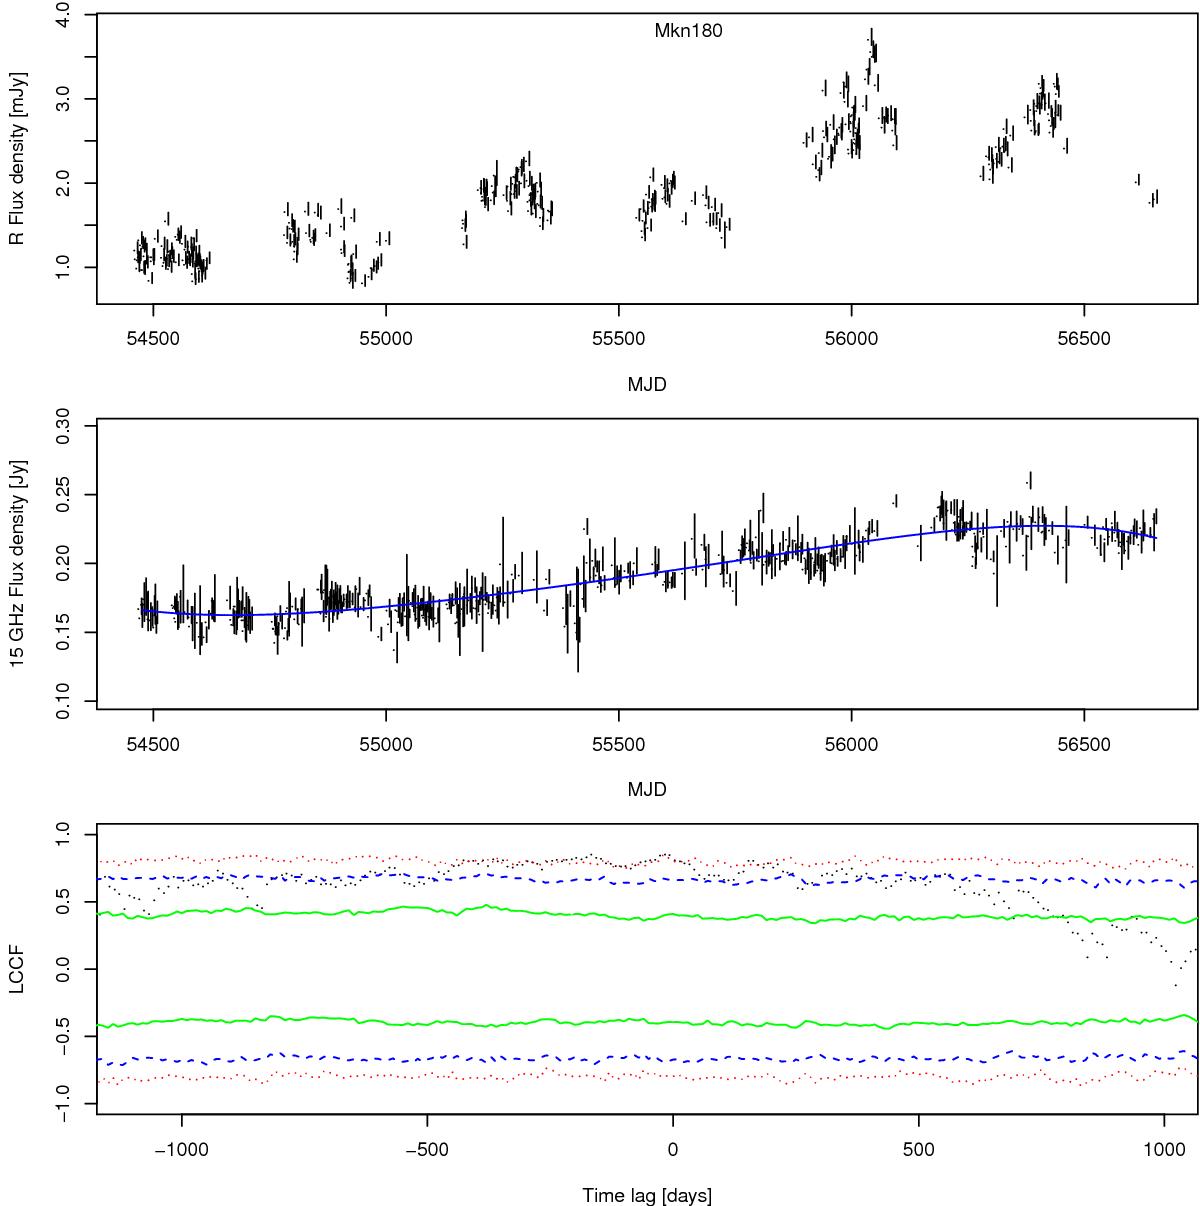
Optical R-band light curve (top) and radio 15 GHz light curve (middle) of Mkn 180. The solid blue line in middle panel shows the polynomial fit to radio data, which is subtracted from the optical light curve to estimate the contribution of the slowly varying component to optical flux. The bottom panel shows the results of the DCF study; the green, blue and red lines representing the 1σ, 2σ and 3σ significance limits, respectively.
Current usage metrics show cumulative count of Article Views (full-text article views including HTML views, PDF and ePub downloads, according to the available data) and Abstracts Views on Vision4Press platform.
Data correspond to usage on the plateform after 2015. The current usage metrics is available 48-96 hours after online publication and is updated daily on week days.
Initial download of the metrics may take a while.