| Issue |
A&A
Volume 591, July 2016
|
|
|---|---|---|
| Article Number | A68 | |
| Number of page(s) | 12 | |
| Section | Astrophysical processes | |
| DOI | https://doi.org/10.1051/0004-6361/201628505 | |
| Published online | 16 June 2016 | |
A young supernova remnant illuminating nearby molecular clouds with cosmic rays
Institut für Astronomie und Astrophysik, Eberhard Karls Universität Tübingen, Sand 1, 72076 Tübingen, Germany
e-mail: This email address is being protected from spambots. You need JavaScript enabled to view it.
Received: 14 March 2016
Accepted: 19 April 2016
Abstract
The supernova remnant (SNR) HESS J1731-347 displays strong nonthermal TeV γ-ray and X-ray emission, thus the object is presently accelerating particles to very high energies. A distinctive feature of this young SNR is the nearby (~30 pc in projection) extended source HESS J1729-345, which is currently unidentified but is in spatial projection coinciding with known molecular clouds (MC). We model the SNR evolution to explore whether the TeV emission from HESS J1729-345 can be explained as emission from runaway hadronic cosmic rays (CRs) that are illuminating these MCs. The observational data of HESS J1729-345 and HESS J1731-347 can be reproduced using core-collapse SN models for HESS J1731-347. Starting with different progenitor stars and their presupernova environment, we model potential SNR evolution histories along with the CR acceleration in the SNR and the diffusion of the CRs. A simplified three-dimensional structure of the MCs is introduced based on 12CO data of that region, adopting a distance of 3.2 kpc to the source. A Monte Carlo based diffusion model for the escaping CRs is developed to deal with the inhomogeneous environment. The fast SNR forward shock speed, as implied from the X-ray data, can easily be explained when employing scenarios with progenitor star masses between 20 M⊙ and 25 M⊙, where the SNR shock is still expanding inside the main-sequence (MS) bubble at present time. The TeV spectrum of HESS J1729-345 is satisfactorily fitted by the emission from the highest energy CRs that have escaped the SNR, using a standard Galactic CR diffusion coefficient in the interclump medium. The TeV image of HESS J1729-345 can be explained with a reasonable three-dimensional structure of MCs. The TeV emission from the SNR itself is dominated by leptonic emission in this model. We also explore scenarios where the shock is starting to encounter the dense MS progenitor wind bubble shell. The escaping hadronic CR hypothesis for the γ-ray emission of HESS J1729-345 can still hold,but even in this case our model cannot easily account for the TeV emission from HESS J1731-347 in a hadronic scenario.
Key words: astroparticle physics / ISM: supernova remnants / gamma rays: ISM / ISM: individual objects: HESS J1731-347 / cosmic rays
© ESO, 2016
1. Introduction
Supernova remnants (SNRs) are considered prime candidates for the main sources of Galactic cosmic rays (CRs), given the sustained kinetic energy input of this source class into the Galaxy and the well-known Fermi mechanism to convert this energy into CR particle acceleration.Substantial theoretical improvement has been achieved to support the idea that SNR shocks can indeed accelerate particles up to ~1015 eV (i.e., up to the position of the knee in the CR energy spectrum), employing the concept of fast amplification of magnetic fields upstream of SNR shocks through nonresonant streaming instability (Bell 2004; Zirakashvili et al. 2008; Zirakashvili & Ptuskin 2008). Direct observational evidence for particle acceleration up to PeV energies is so far lacking, but X-ray synchrotron and TeV γ-ray observations have revealed super-TeV particles in shocks of young SNRs, e.g., Aharonian (2004). If the TeV spectra trace the dominant hadronic CR particles, they should thus extend unbroken to the highest accessible γ-ray energies if particles with PeV energies are indeed present. The fact, however, that all well-measured TeV spectra of young SNRs show relatively soft spectra (photon index Γ > 2) or cutoffs toward higher energies needs to be interpreted through one of two possible scenarios. Either, the spectra are dominated by inverse Compton (IC) emission from the TeV electrons that are seen in synchrotron X-rays and thus suffer from synchrotron cooling; in that case, the cutoff energy of the hadronic CRs in these SNR would experimentally be unconstrained, unless a second component above the measured leptonic cutoff energy were detected in the future. Or, the known TeV-emitting shells no longer confine previously accelerated PeV (hadronic) particles; those particles would have escaped at earlier times of the SNR evolution and are at present already diffusing into the environment of the SNR. The latter hypothesis has been discussed in several works as a possibility to lower the high energy cutoff of TeV spectra of young SNRs in hadronically dominated TeV emission scenarios (e.g., Berezhko et al. 2003; Malkov et al. 2005; Berezhko et al. 2009).
In general, previously accelerated CR particles are assumed to be trapped inside the SNR until the shock significantly slows down and can no longer confine the CRs with a given threshold energy. Such an energy dependent, but purely diffusive escape, is at present possibly the dominant escape process for TeV and super-TeV CRs in middle-aged SNRs, such as W 28,which do not accelerate TeV particles any more. For young, TeV-emitting SNRs, such as RX J1713.7-3946 and Vela Jr., direct CR escape from the acceleration region (Ptuskin & Zirakashvili 2005; Gabici & Aharonian 2007) is likely the dominant escape process. This offers an experimental access to identifying these particles as hadrons. At and outside of the forward shock locations, the TeV morphology of these SNRs might differfrom their X-ray morphology, which is dominated by electron synchrotron emission, namely they might extend further outward. Such an effect might be strongly enhanced if the SNR is embedded in areas of dense gas, such as molecular clouds, which serves as target material for π0-production preceding the γ-ray emission (Aharonian & Atoyan 1996). Besides such a morphological signature, a spectral signature could also be expected from TeV emission regions outside SNRs, since the energy of the escaping particles depends on the SNR evolutionary stage including the current forward shock speed (e.g., Ptuskin & Zirakashvili 2005; Gabici & Aharonian 2007; Gabici et al. 2009); in essence, the spectra may peak at higher energies further away from the SNR.
In the work presented in this paper, we focus on the TeV-emitting SNR HESS J1731-347 (Aharonian et al. 2008b; Abramowski et al. 2011). This SNR is very similar to the well-known TeV SNRs RX J1713.7-3946 and Vela Jr., regarding their physical size and TeV luminosity, in displaying low surface brightness radio emission (Tian et al. 2008) and exhibiting essentially pure nonthermal X-ray emission (Abramowski et al. 2011; Bamba et al. 2012). The high forward shock speed (≳ 1000 km s-1) inferred from the nonthermal X-ray emission indicates that the remnant is still in an early evolutionary stage with super-TeV particle acceleration ongoing in the shocks. A distinctive feature of the HESS J1731-347 environment is another resolved TeV source, HESS J1729-345, located just outside of the SNR (Abramowski et al. 2011). This source is in apparent spatial coincidence, at least in projection, with molecular clouds seen through sub-mm molecular line emission (Abramowski et al. 2011). Since no other local particle accelerators are known so far, a scenario is conceivable in which particles that have escaped the SNR HESS J1731-347 are presently penetrating molecular clouds coincident with HESS J1729-345 and thus lead to enhanced γ-ray emission, above the emission induced by the sea of CRs that are homogeneously filling the Galaxy.
In fact, a similar scenario has been successfully invoked to explain the γ-ray emission region HESS J1800-240 south of the SNR W 28 (Aharonian et al. 2008a; Abdo et al. 2010; Li & Chen 2010). HESS J1800-240 displays a very good morphological match to the molecular gas measured through CO emission from that region. Unlike the old SNR W 28, HESS J1731-347 is however much younger and is presently still accelerating super-TeV particles. This region offers the opportunity to model the evolution of the SNR and its associated particle acceleration history, simulating the particle acceleration and escape history up to the present time with good precision. For this purpose, we adopt the particle acceleration and escape formalism developed by Zirakashvili & Ptuskin (2008) and couple it to simulated SNR evolution histories.
The aim of the study presented in this paper is to explore whether the observational constraints are compatible with a scenario in which CRs that have been accelerated in HESS J1731-347 and are now diffusing outward could indeed explain the γ-ray emission seen from HESS J1729-345. To this extent, we explored SNR evolution models (Sects. 2.2 and 2.3) that are consistent with the known properties of HESS J1731-347 (Sect. 2.1). Using these models, CR acceleration in the forward shock and the escape of the highest energy particles was simulated, adopting the recipes developed by Zirakashvili & Ptuskin (2008) (Sect. 2.3). Over the history of the SNR, we simulated the diffusion of the escaping CR particles into an environmental molecular cloud setup, which we constructed to match the known observational constraints (Sect. 2.4). In Sect. 3, we discuss two possible scenarios: one in which the SNR still resides in the main-sequence wind bubble of the progenitor star (Sect. 3.1), and a second scenario in which the SNR has started to enter the surrounding wind bubble shell (Sect. 3.2).
In our model, once the particles have left the SNR, they propagate diffusively and isotropically into the surrounding simulated molecular cloud environment. Such diffusion has been the basis of most corresponding work in the literature(e.g., Aharonian & Atoyan 1996; Gabici & Aharonian 2007; Li & Chen 2010; Ohira et al. 2011). Cosmic ray particles can normally only be assumed to travel diffusively on sufficiently large scales, ≫ 100 pc according to the observed maximum scale of magnetic fluctuations in our galaxy (e.g., Han et al. 2004). In general, previous works found that the diffusion speed required for a self-consistent picture requires low diffusion coefficients, ~ 10 times lower than typical Galactic values(e.g., Gabici & Aharonian 2007; Aharonian et al. 2008a; Gabici et al. 2009; Li & Chen 2010, 2012; Ohira et al. 2011), justifying to some extent the concept of diffusive CR transport even on scales ≲ 100 pc. For our model of the HESS J1731-347/HESS J1729-345 system, resulting diffusion speeds turn out to be closer to typical Galactic values. This is somewhat at odds with the presented geometric solution that places the molecular cloud corresponding to HESS J1729-345 at only 30 pc distance to the SNR. We discuss the implications of this apparent tension in Sect. 3.3. The main conclusions of the paper are summarized in Sect. 4.
2. Model
2.1. HESS J1731-347 and HESS J1729-345: observational constraints
Shell-type emission from the SNR HESS J1731-347 is seen through TeV γ-ray emission (Aharonian et al. 2008b; Abramowski et al. 2011) and through radio synchrotron (Tian et al. 2008) and X-ray synchrotron (Abramowski et al. 2011; Bamba et al. 2012) emission. In the GeV-(Fermi-LAT) band, only upper limits were derived (Yang et al. 2014; Acero et al. 2015); also, no thermal X-rays have been detected yet from the SNR (Abramowski et al. 2011; Bamba et al. 2012). A morphological match of an absorption pattern in X-rays with a gas density patternmeasured through  column density from the CfA survey (Dame et al. 2001) was used to set a lower limit on the distance to the SNR of ~3.2 kpc; likely locations are thus in the Scutum-Crux Galactic spiral arm at a distance of ~3 kpc or the Norma-Cygnus arm at ~4.5 kpc (Abramowski et al. 2011). A luminous point source has been identified in thermal X-rays at the geometrical center of the SNR and has been classified as the associated central compact object (CCO), i.e., a cooling neutron star (NS) that remains after the SN explosion (Abramowski et al. 2011; Klochkov et al. 2013). Modeling of the NS atmosphere indicates that the nearby distance is preferred (Klochkov et al. 2013, 2015). An association with the nearby H II region at 3.2 ± 0.8 kpc distance (Tian et al. 2008) is thus possible.
Throughout this paper, we adopt the distance estimate of 3.2 kpc from Earth, placing the SNR just behind the molecular cloud structure at 3.2 kpc at the rear side of the Scutum-Crux arm. The radius of the SNR is thus about 15 pc. We note that in a recent work by Fukuda et al. (2014), a distance of ~5.2 kpc was derived by matching the TeV image with the interstellar gas density profile (using data from Nanten and HI data). We discuss this possibility a bit further in the context of our model where the shock has entered the progenitor wind bubble shell (Sect. 3.2).
The SNR outer shock speed is not known from direct observations. However, the detection of synchrotron X-rays imply forward shock speeds ≳ 1000 km s-1, using the argument that the synchrotron peak energy does not depend on magnetic field strength but only on shock speed (e.g., Aharonian & Atoyan 1999; Vink 2013). This theory is also supported by the observation that measured shock speeds of X-ray synchrotron emitting SNRs are always high (≈ 2000−6000 km s-1; Vink 2012).
The nearby TeV source HESS J1729-345 has a significantly lower surface brightness than HESS J1731-347, with moderate peak detection significance (~8 σ; Abramowski et al. 2011). Thus, we believe a detailed morphological correlation analysis of the γ-ray source HESS J1729-345 with gas density maps is premature. As shown in Abramowski et al. (2011), the source coincides in projection with two molecular cloud structures, one at LSR velocities integrated from − 13 to − 25 km s-1 (at a distance of ~3.2 kpc, i.e., the foreground cloud), and one at − 75 to − 87 km s-1, which is located at a distance of ~6 kpc (Abramowski et al. 2011), i.e., likely in the 3 kpc spiral arm (see Fukuda et al. 2014). A similar range of possible distances is also derived by Maxted et al. (2015) through possible associations with high-density gas (nH ≳ 104 cm-3) traced by CS(1−0) data.
As we adopt the distance to the SNR of 3.2 kpc and assume that HESS J1729-345 is a γ-ray source near the SNR in space, we associate HESS J1729-345 with the molecular clouds seen in the distance range − 13 to − 25 km s-1. The moderate resolution of both the gas density and the TeV γ-ray maps leaves room to set up a geometrical molecular cloud model as introduced in Sect. 2.4.3. This model is chosen such that it matches the TeV data that are computed in the framework of our CR propagation model, while at the same time not violating any constraints from the gas density data.
2.2. The progenitor star of a core-collapse SNR and its environment
The presence of a CCO suggests a core collapse supernova (SN) scenario for HESS J1731-347, implying a progenitor star with relatively large mass, M> 8 M⊙. Massive stars are normally formed as clusters inside molecular clouds (MCs) which can be considered MC clumps floating inside the interclump medium (ICM). Clumps have densities around 103 ~ 104 H cm-3, but only take 2−8% of the volume; the pressure in the ICM is around 105 K cm-3 and the density is around 5−25 H cm-3 (Chevalier 1999). Thus, the stellar wind bubble and the SNR expand into the ICM environment. Before the SN exploded, the massive progenitor star during its main-sequence (MS) phase has likely blown a huge bubble (with a size of up to tens of parsec) in the MC or the ICM. After the MS phase, the massive star enters the red supergiant (RSG) phase. For SNe IIP, the RSG wind extends only to ≲ 1 pc, while SNe IIL/b has larger RSG wind bubbles above 5 pc with material up to the CNO layer striped up from the star and extending into the bubble. After the RSG phase, progenitor stars of SNe Ib/c are expected to go through a Wolf-Rayet (WR) phase, during which the high speed WR wind could blow away the dense RSG bubble and form a very turbulent structure inside the MS bubble (Chevalier 2005).
Thus right before the SN happens, we divide the progenitor environment of HESS J1731-347 into several regions:
-
ICM. We adopt nICM = 5 H cm-3 for the ICM density and the standard Galactic diffusion coefficient (D(E) = D10(E/ 10 GeV)δ,D10 = 1028 cm2/ s,δ = 0.3 ~ 0.5) in the ICM.
-
MCclumps. High gas densities are expected inside MC clumps which can be deduced from the CO data. Diffusion coefficients in the MC clumps are unknown; we discuss this issue further below.
-
TheMSwindbubble. Starting close to the star, the density in the MS bubble first follows a power law in the stellar wind region; then it remains constant inside the long shocked wind region (nb ≈ 0.01 H cm-3); at the border of the MS bubble, ICM swept up by the MS wind forms a MS bubble shell (Weaver et al. 1977). In our models, we ignore the power law wind region because of its small size and low density compared to the whole MS bubble. The bubble shell is assumed to have a thickness ~ 1 pc. Turbulence is strong in this shocked wind region, thus lower diffusion coefficients than inside the ICM region may be assumed in the following chapters. The magnetic field is assumed to be B0 = 5 μG for CR acceleration calculations, which is consistent with Berezhko & Völk (2000) and Ptuskin & Zirakashvili (2005).
-
TheRSGwindbubble. Compared to the MS wind bubble, the size of the RSG bubble is smaller but its density is much higher. The density follows nRSG(r) = ṀRSG/ 4πr2vRSG (Chevalier 2005). Here, ṀRSG and vRSG are the mass loss rate and wind speed during RSG phase. The bubble shell between the RSG wind bubble and the MS bubble is ignored in our calculations because it only contains very little mass swept up from the almost empty MS bubble. The turbulence in the RSG wind is also strong. The magnetic field is assumed to be B0(r) = 2 × 10¹³(vRSG/ 106 cm/s)-1 (r/ cm)-1 G (Ptuskin & Zirakashvili 2005) which is similar to the interplanetary magnetic field (Parker 1958).
-
TheWRwind. We also explored SNe Ib/c scenarioswhich imply the presence of a WR wind phase in the progenitor environment. However, we did not explore the complex inhomogeneous structures that are typical for the instabilities evolving from WR winds expanding into RSG wind bubbles. The WR wind together with the RSG wind can only inject very little material into the MS wind bubble. For example, before the SN explosion, a 25 M⊙ star blows about 21 M⊙ material into the MS wind bubble (with a size of ~ 21 pc) and leaves a CNO core behind. When the WR wind-driven material collides with the MS bubble shell, and if we assume that all material bounces back into the MS bubble, the maximum density contribution after dissipation in the MS bubble is about 0.02 H cm-3. Thus, we adopt a homogeneous but very tenuous density for the WR wind, extending up to the inner boundary of the MS bubble. The magnetic field is assumed to be the same as in the MS bubble.
2.3. The SNR evolution history and particle acceleration process
With the adopted distance of HESS J1731-347 from Earth of 3.2 kpc, the radius (defined by the forward shock) of the SNR is about 15 pc at present.For example in the case of a type IIL/b SN, after starting the expansion the SNR forward shock first passes the relatively dense RSG bubble, then enters the MS bubble, and finally encounters the ICM.
For the ejecta-dominated phase of an SNR, a self-similar solution was found by Chevalier (1982) and Nadezhin (1985), with RSNR ∝ t4/7 for an SNR expanding in a uniform medium and RSNR ∝ t7/8 for an SNR expanding in a RSG wind.Here we adopt the derived equations from Ptuskin & Zirakashvili (2005), which follow these power-law rules. Once the shock leaves the RSG wind and enters the essentially empty MS bubble, and if, at this stage, the SNR is still in ejecta-dominated phase, we simply assume that the shock maintains its speed until it enters the Sedov phase (swept-up mass equals the ejecta mass, Ms ≈ Mej). To smooth the transition between two SNR phases, the swept-up mass at this transition phase is adapted slightly around 1Mej; see also Appendix B.
At Sedov phase, to solve the SNR evolution in an inhomogeneous but spherically symmetric circumstellar medium, a thin-shell approximation of a SNR evolution was derived in Ostriker & McKee (1988) and Bisnovatyi-Kogan & Silich (1995). From momentum conservation and ignoring the pressure in the circumstellar medium, Ptuskin & Zirakashvili (2005) derived the following: ![Mathematical equation: \begin{eqnarray*} v_{\mathrm{SNR}}(R_{\mathrm{SNR}})&=&\frac{\gamma_{\mathrm{ad}}+1}{2}\Bigg[ \frac{12(\gamma_{\mathrm{ad}}-1)E_{\mathrm{ej}}}{(\gamma_{\mathrm{ad}} +1)M^{2}(R_{\mathrm{SNR}})R_{\mathrm{SNR}}^{6(\gamma_{\mathrm{ad}} -1)/(\gamma_{\mathrm{ad}}+1)}} \\ &&\qquad \qquad \qquad \times\int_{0}^{R_{\mathrm{SNR}}}{\rm d}rr^{6\left( \frac{\gamma_{\mathrm{ad}}-1}{\gamma_{\mathrm{ad}}+1}\right) -1}M(r)\Bigg] ^{1/2},\; \\ &&t(R_{\mathrm{SNR}})=\int_{0}^{R_{\mathrm{SNR}}}\frac{{\rm d}r}{v_{\mathrm{SNR}}(r)}, \end{eqnarray*}](/articles/aa/full_html/2016/07/aa28505-16/aa28505-16-eq62.png) where γad = 4/3 is the ratio of the specific heats (adiabatic index),
where γad = 4/3 is the ratio of the specific heats (adiabatic index),  is the total mass confined by the shock of radius RSNR, Mej is the ejected mass, and ρ is the density of the ambient gas.
With the shock speed vSNR and the density of the nearby circumstellar medium obtained, the CRs acceleration processes can be calculated through the nonresonant acceleration theory from Zirakashvili & Ptuskin (2008). Inside the upstream acceleration region with thickness about 5−10% RSNR (Zirakashvili & Ptuskin 2012), the magnetic turbulence is amplified by accelerated CRs, which finally increases the escape energy Emax. We adopt the concept of an absorption boundary with position L = tSNRvSNR from Zirakashvili & Ptuskin (2008). The parameter L is measured from the shock position RSNR in radial direction outward and is set to the scale where CRs at the high-energy cutoff Emax cross the boundary and escape into the surrounding medium with a flux J(E) (the number of particles crossing the absorption boundary per unit time and unit surface area). The parameter L is of similar order as RSNR.
From the acceleration region R ~ 1.1 RSNR to the absorption boundary R = RAbs = RSNR + L is the region where the escaping CRs drive streaming instabilities before the shock arrives. Zirakashvili & Ptuskin (2008) provide an analytical approximation for calculating Emax along with the CR density at the shock front N0(E) and the escaping CR flux J(E), where N0(E) follows a power law with index Γ = 2 in Sect. 3.1. We adopt these prescriptions for the work presented here. More details about the acceleration model can be found in Appendix A.
2.4. CRs outside of the SNR
2.4.1. Analytical diffusion model
CRs escape the SNR starting from the absorption boundary which is assumed to be a spherically symmetric surface surrounding the SNR. In a homogeneous environment, the final CR density at distance R from the SNR center and SNR age tage can simply be written as
 where
where ![Mathematical equation: \hbox{$G(E,r,t)=1/8(\pi t D)^{-3/2} \exp[-r^2/(4 tD)] \ \ ( \int_0^\infty {\rm d}r 4\pi r^2 G=1)$}](/articles/aa/full_html/2016/07/aa28505-16/aa28505-16-eq82.png) is theGreen’s function solution for the diffusion equation in homogeneous environments (D = const.); see, e.g., Aharonian & Atoyan (1996).
is theGreen’s function solution for the diffusion equation in homogeneous environments (D = const.); see, e.g., Aharonian & Atoyan (1996). ![Mathematical equation: \hbox{$R'=\sqrt{[R-(R_{\rm{Abs}}-R_{\rm{Abs}}\cos\theta)]^2 + (R_{\rm{Abs}}\sin\theta)^2}$}](/articles/aa/full_html/2016/07/aa28505-16/aa28505-16-eq84.png) is the distance from a certain point on the absorption boundary to the diffusion target (e.g., the nearby molecular clouds), RAbs = RSNR + L is the radius of the absorption boundary, and
is the distance from a certain point on the absorption boundary to the diffusion target (e.g., the nearby molecular clouds), RAbs = RSNR + L is the radius of the absorption boundary, and  1 is the escaping CR flux at different times along the SNR evolution history.
2.4.2. Monte Carlo diffusion model
The diffusion coefficient is usually assumed to be a power law function of energy, D(E) = D10(E/ 10 GeV)δ. Under realistic conditions, both D10 and δ depend on the environment, for example, in the MS wind bubble or in irregularly shaped MCs. Thus, we use Monte Carlo simulations to divide the particle diffusion process into small steps. During a short period Δt, CRs can be considered to diffuse inside a homogeneous environment. For each step, particles are assumed to be scattered by turbulent magnetic fields to a random direction, and along this direction they travel the mean diffusion distance  . We derived the coefficient 2.5 by matching results from the Monte Carlo method with the corresponding analytical expressions for a homogeneous environment; a similar result (
 ) is obtained when integrating the Green’s function.
Each step should be much smaller than the size of the molecular clouds used in the simulated environment, Δr ≪ RMC. In our work, the step size is set to Δr = 1 pc.
For simplicity, the environment for CR particle diffusion is divided into three domains with different diffusion coefficients: the MS bubble (including the RSG or eventually the WR wind region as well as the temporally expanding SNR region, all set to have the same diffusion coefficient), the MC clumps region, and the ICM region. An impact of the different diffusion coefficients on the shock acceleration efficiency, for example, through returning CRs, is estimated to be minor and is ignored in the simulations.
2.4.3. The nearby molecular clouds
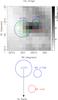 |
Fig. 1 The top image shows in grayscale the molecular gas density along the line of sight to HESS J1731-347 in a distance interval 2.5−4.0 kpc, derived by integrating the |
As discussed in the introduction, the goal of this work is to explore if a scenario is feasible in which the TeV-emitting region HESS J1729-345 can be explained by CRs that escape the young SNR HESS J1731-347 and are currently diffusing away from the SNR. To that extent, we therefore constructed a simplified molecular cloud setup that is consistent with the current molecular line observations and can explain the boost of TeV emission toward HESS J1729-345 through π0-decay of CRs interacting with the dense gas.
The gas of the molecular clouds shown in Fig. 1 is likely concentrated in relatively dense clumps and filaments with sizes ≲ 10 pc. The most simplified representation of the overall molecular cloud structure that satisfies our goal consists of two spherical, homogeneously filled clumps: one corresponding to the HESS J1729-345 region (MC-J1729; radius 7.8 pc, see small blue circle in Fig. 1) and a second corresponding to the densest molecular cloud core region (MC-core; centered at RA 17h30m36s, Dec. − 34°43′0′′, and with an ad-hoc set radius of 7.2 pc; see red circle in Fig. 1). To translate the measured CO intensity of these two clumps into corresponding gas density, we adopt the CO-to-H2 mass conversion factor 1.8 × 1020 cm-2 K-1 km-1 s (Dame et al. 2001), and obtain mean densities of 367 H2 cm-3 (MC-core, total mass 2.84 × 10⁴M⊙) and 240 H2 cm-3 (MC-J1729, 2.36 × 10⁴M⊙).
As can be seen in the top panel of Fig. 1,the gas density and the TeV observational image are not a very good match. In our setup, this is a consequence of the nonuniform density of the CRs injected by the SNR, following the injection and diffusion history over the lifetime of the SNR. Putting MC-J1729 closer in space to the SNR than the bulk of the gas material (represented in our setup by MC-core) will result in a TeV emissivity dominated by MC-J1729. MC-J1729 is set to be at the minimum possible distance, i.e., the projected 30.7 pc distance to the SNR, while MC-core is placed at a distance of 100 pc in the foreground of the SNR.
In our work, we simplify the hadron collisions between CRs and target atoms (e.g., in the MC) to proton-proton (pp) collisions only.The cross-section table of the pp collision was obtained from Kachelrieß & Ostapchenko (2012).
3. Results
3.1. HESS J1731-347 still residing inside the main-sequence bubble
In Table 1 we present the parameters for four representative core-collapse SN scenarios (progenitor mass 8M⊙, 15M⊙, 20M⊙, and 25M⊙). The environments for the SNR evolution are adapted as discussed in Sect. 2.2. Under these conditions, the CR escape and diffusion process is calculated to explain the TeV image and spectrum of HESS J1729-345; see Figs. 2 and 3. In the following, we show detailed results for the 20M⊙ scenario alone. The 8M⊙ and 15M⊙ are unlikely to be realised,mainly because of the shock speed that is at present already low and is in conflict with the hard X-ray spectrum. Under certain simplifications, a 25M⊙ scenario can also be constructed that satisfies our requirements, but a detailed discussion is beyond the scope of this paper.
SNR evolution of different scenarios.
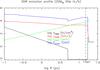 |
Fig. 2 Evolution profiles of the SNR of the SNe IIL/b scenario: density of the circumstellar medium (black), shock velocity (red), age of the SNR (green) and escape energy (blue) along with SNR radius. The SNR size (15 pc) is indicated with a dashed line. The time, velocity, and escape energy profiles are cut off when shock speed drops significantly (vSNR ≪ 1000 km s-1). |
More than half of all recorded core-collapse SNe are of type IIP, and their progenitor star masses range from 8 M⊙ to ~ 25 M⊙ (Smartt 2009). In agreement with the lack of high mass RSGs > 15 M⊙ exploding as Type IIP SNe (the RSG problem; Smartt 2009), we choose progenitor stars with masses 8 M⊙ and 15 M⊙ for our first two scenarios. In the 8 M⊙ scenario, the progenitor star produces almost no MS wind bubble or RSG wind bubble, thus the SNR expands directly into the ICM. In the 15 M⊙ scenario, after the SNR forward shock passes the RSG bubble, which only contains ~ 0.2 M⊙ gas, it continues its ejecta-dominated phase through the whole MS-wind bubble without speed loss. Once the SNR sweeps into the shell of the MS wind bubble, which contains ~ 500 M⊙ gas, the shock speed drops significantly. Both SNe IIP scenarios (with 8 and 15 M⊙, respectively) fail to maintain a high shock velocity until today. More details about these two scenarios can be found in Appendix B.
Indeed, the MS bubble size is the key parameter to maintain a high shock speed until today. As long as the SNR is still expanding inside its progenitor MS bubble, the swept-up material is limited and a fast shock speed vSNR> 1000 km s-1 can easily be obtained. The bubble size of the progenitor of HESS J1731-347 is unknown, as it is for most OB stars in our galaxy because of absorption. Therefore, we adopt the linear relationship between progenitor mass and MS bubble size from Chen et al. (2013). Their work is based on 15 well-observed OB stars (8−72 M⊙) and yields ![Mathematical equation: \hbox{$p_5^{1/3}R_\mathrm{b}=\left[\alpha\left(M/ {M_\odot} \right)-\beta\right] \rm{pc},$}](/articles/aa/full_html/2016/07/aa28505-16/aa28505-16-eq160.png) where α = 1.22 ± 0.05 and β = 9.16 ± 1.77. This relationship is also consistent with the theory that a maximum bubble radius Rb is obtained for pressure equilibrium between bubble and its surroundings, assuming a constant ICM pressure p/k ≈ 105 cm-3 K,i.e., p5 ≈ 1 (Chevalier 1999). The progenitor star should have an initial mass of ≳ 20 M⊙ to confine the observed SNR into a correspondingly larger MS bubble.
where α = 1.22 ± 0.05 and β = 9.16 ± 1.77. This relationship is also consistent with the theory that a maximum bubble radius Rb is obtained for pressure equilibrium between bubble and its surroundings, assuming a constant ICM pressure p/k ≈ 105 cm-3 K,i.e., p5 ≈ 1 (Chevalier 1999). The progenitor star should have an initial mass of ≳ 20 M⊙ to confine the observed SNR into a correspondingly larger MS bubble.
Stars with progenitor masses that are above ~ 17 M⊙ can end as SNe IIL/b, which represent only ~ 10% of the total recorded core collapse SNe (Smartt 2009). Here we choose 20 M⊙ to make sure the MS-wind bubble (~18 pc) just exceeds the observed SNR radius. As shown in Fig. 2, the SNR enters its Sedov phase in less than 100 yr after the SN explosion, when the forward shock is still inside the RSG bubble. With almost no speed loss while moving through the MS-wind bubble, the shock is still a very active acceleration engine at present time (vSNR> 2000 km s-1).
At the early stage of its evolution, despite the young age of the SNR, the escape energy can easily be as high as Emax ~ 100−1000 TeV because of the high shock speed and dense RSG wind that the SNR encounters.
A progenitor star with much larger mass (≳ 25 M⊙) develops into a Wolf-Rayet phase after the RSG phase. The ongoing WR phase is characterized by strongly nonuniform, turbulent spatial distribution of the wind material. Indeed, the X-ray morphology of the SNR, as shown in Abramowski et al. (2011) and Bamba et al. (2012), might be indicative of such a phase. Since we only model structures in one (radial) dimension, such a turbulent configuration cannot be accommodated for in our model. Nevertheless, no matter what kind of structure the wind bubble has, the total mass confined inside the MS wind bubble mainly comes from the progenitor star and, therefore, is very limited. Thus, when the SNR shock is sweeping inside the MS wind bubble, it can also maintain a relatively fast speed just as the SNR in the 20 M⊙ scenario does. Ultimately, the WR wind blows away the dense RSG wind material into the MS bubble, as discussed in Sect. 2.2,leaving a bubble that is filled with a tenuous (n ≈ 0.02 H cm-3) but roughly homogeneous gas. Such a configuration can be simulated in our framework (see Table 1); the results confirm the high shock speed and a rough consistency with the TeV spectrum of HESS J1729-347.
As discussed in Sect. 2.4, we use Monte Carlo simulations withregional diffusion coefficients that depend on the location where the CRs are moving.We use the Ansatz that the diffusion coefficient D at 10 GeV corresponds to the average Galactic value (D10 = 1028 cm2/ s) everywhere. But at higher energies, which are, in fact, relevant for our work here, we introduce differences by choosing different values of δ in D(E) = D10(E/ 10 GeV)δ. The values of δ = 0.3,0.5 are still in the range of Galactic diffusion coefficients (D10 = 1028 cm2/ s,δ = 0.3 ~ 0.6, Berezinskii et al. 1990; Ptuskin 2006). Table 2 lists the values for δ that have been explored.
Observationally, the diffusion coefficient in high-density molecular clouds is not well constrained. For instance, CRs could be trapped by a lower diffusion coefficient. For example, Gabici et al. (2010) argued that to explain the TeV emission of the molecular clouds near the SNR W 28, an average diffusion coefficient around 10% of the Galactic standard diffusion coefficient is required, albeit not only in the molecular clouds but everywhere around the SNR. Crutcher (2012) found that the maximum strength of the interstellar magnetic field stays constant at ~ 10 μG up to densities nH ~ 300 cm-3, and above 300 cm-3 it increases following a power law with exponent ≈ 2/3. If one assumes that the magnetic turbulent strength in MC clumps is of order ~ 10 μG as well, with a Kolmogorov-type power law for the magnetic turbulent power spectrum and the size of the MC clumps ~1 pc as the maximum wavelength, one can obtain a much lower diffusion coefficient in dense clump regions with ≲ 1% Galactic standard for 1−1000 TeV CRs (e.g., Fatuzzo et al. 2010). On the other hand, diffusion in dense molecular clouds could be even much faster than Galactic owing to damping of the turbulent magnetic field in the high-density environment. The values chosen in our work (δ = 0.5 and δ = 0.3 as shown in Table 2) correspond to a range of the diffusion coefficient of 1−10 TeV protons with a mild factor of only ~ 3 between minimum and maximum. More extreme values are currently not compatible with our model.
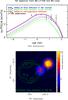 |
Fig. 3 Predictions for the TeV γ-ray emission from the escaping CRs in the 20 M⊙ progenitor mass scenario, which are derived using Monte Carlo simulations for the CR diffusion into the inhomogeneous medium. In the top panel, predictions for the TeV spectrum at MC-J1729 (solid lines) and MC-core (dashed lines) are shown, for different diffusion scenarios (red, green, and blue) corresponding to the parameters that are given in Table 2. The bottom panel sky image shows the predicted 1 TeV image for the “slow diffusion in MC” scenario (blue lines in the top panel). Green contours correspond to the TeV image from Abramowski et al. (2011); the large and small dashed circles represent the locations of HESS J1731-345 and HESS J1729-347, respectively. |
As introduced in Sect. 2.4.3, we place MC-J1729 at the shortest possible distance to the SNR (30.7 pc), while MC-core is located at the foreground of the SNR, 100 pc away. Figure 3 shows the simulated TeV spectra for the different assumed diffusion coefficient setups, and a simulated TeV sky map for the “slow diffusion in MC” parameters. The simulated spectra peak around an average Emax ≈ 30 TeV, and a rough match with the measured spectrum of HESS J1729-345 can be achieved with the two models that use the low diffusion coefficient in the MC clumps of δ = 0.3. The simulated sky map illustrates that the expected TeV emission from MC-core is substantially suppressed with respect to the MC-J1729 emission, and thus remains undetectable in the measured TeV sky map due to the dominance of the emission from the SNR itself.This suppression of TeV emission from MCs other than MC-J1729 was indeed one main boundary condition for the choice of the model setup parameters in this work. The emission from the SNR itself is likely dominated by IC emission from CR electrons, given the low gas density inside the wind bubble in which the forward shock still resides.
Several of the free parameters of our model are obviously correlated. First, the difference between the CR density at MC-core and MC-J1729 can be increased by lowering the ICM diffusion coefficient at the relevant high energies. In turn, if we use a higher ICM diffusion coefficient than the galactic standard value (δ> 0.5), we would have to put MC-core even further away from the SNR. Second, with a lower diffusion coefficient in MC clumps like MC-J1729, more CRs will be trapped there, while the CR density at MC-J1729 is not sensitive to the diffusion coefficient in the ICM. For our scenario, the lower diffusion coefficient inside the MC clumps (by choosing δ = 0.3 as in “homogeneous diffusion” or “slow diffusion in MC”) matches the measured TeV spectrum reasonably well; see Fig. 3.Nevertheless, the “fast diffusion in MC” setup could be modified to match the TeV data as well, either by increasing Eej or ηesc to generate more CRs from the SNR. And third, the CRs that have diffused to the MC clumps have a particle energy spectrum that peaks near the average Emax. To move the peak (and thus also the corresponding TeV γ-ray peak) to lower energies, the acceleration efficiency can be lowered or the diffusion coefficient in the ICM can be increased. The distance between MC-J1729 and the SNR cannot be lowered below 30.7 pc, since this already corresponds to the minimum possible distance.
In summary, the model is in general sensitive to the choice of diffusion coefficients in the medium. However, the TeV brightness contrast between MC-J1729 and MC-core (in the foreground of the SNR) can be kept such that it does not violate the TeV data by adjusting several parameters that are not strongly constrained. Therefore, no conclusion regarding the actual diffusion coefficients in the different media can be drawn in the framework of the presented model.
3.2. HESS J1731-347 evolving into the main-sequence bubble shell
SNR evolution when SNR evolving into the MS bubble shell.
In the 20 M⊙ scenario described in the previous Sect. 3.1, the shock front is still located inside the MS progenitor wind bubble. With such a low density of target gas material for π0-induced γ-ray production, the TeV emission from the SNR itself cannot be explained in a hadronic emission scenario. As shown in Abramowski et al. (2011), the target gas density has to be of order 1 cm-3 to reach the observed γ-ray emissivity in a hadronic scenario with a still reasonable fraction of SN energy (~ 0.5 × 1051erg) going into CRs.
It is, however, also possible in a similar ~ 20 M⊙ (~ 25 M⊙) progenitor star scenario as the one above that the shock has just recently entered the dense shell swept up by the MS wind. This would permit us to maintain a high shock speed vSNR> 1000 km s-1 and at the same the shock is right now embedded in high circumstellar medium density with n ≫ 0.1 cm-3, providing thus dense target material for hadronic γ-rays. Under these well-adjusted conditions, the GeV-TeV spectrum may contain a sizeable fraction of π0-induced γ-rays.To explore such a scenario, we introduced two additional, “in-shell” scenarios, the 20 M⊙ and 25 M⊙ in-shell scenarios, as shown in Table 3. We use the same configuration for these two scenarios as used in the 20 M⊙ and 25 M⊙ scenarios above except that we adopt a different initial SN energy and a different MS bubble size with an exponential gas density profile at the shell. This density profile was used byBerezhko & Völk (2006) and Berezhko et al. (2009) for the case of RX J1713.7-3946 and Vela Jr., with n(r) = nb + (r/Rb)3(σsh−1)nsh, where nsh = σshnICM is the maximum density of the shell at the outer boundary of the shell. In our work, we set σsh = 5. The density profile in the RSG bubble and outside of the MS bubble remains the same as in Sect. 3.1.
As shown in Fig. 4, we try to fit the spectrum of both HESS J1731-347 and HESS J1729-345 assuming as in Sect. 3.1 that MC-J1729 is located 30 pc away from the CCO. The total SN energy for both scenarios are set higher than in Sect. 3.1 (to 2 × 1051 erg) to obtain a higher shock speed when the SNR shock hits the MS bubble shell. As shown in Table. 3, in the 20 M⊙ in-shell scenario (25 M⊙ in-shell), the MS bubble size is set just such that the SNR keeps a fast enough shock speed of 1150 (1170) km s-1 at present time.
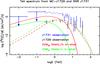 |
Fig. 4 TeV spectra resulting from hadronic CR-gas interactions, from CRs trapped inside the downstream of shock region of SNR HESS J1731-347 (solid lines) and from CRs interacting with MC-J1729 (dashed lines). Red/green lines represent the 20 M⊙ in-shell and 25 M⊙ in-shell scenarios shown in Table 3. Adopting a Galactic standard diffusion coefficient D10 = 1028 cm2 s-1,δ = 0.5 over the entire space, we fitted the spectrum of MC-J1729 (at 30 pc distance from the center of the SNR). Observational data from Abramowski et al. (2011) and Acero et al. (2015) for HESS J1731-347 and HESS J1729-345 are shown as blue stars and black circles, respectively. |
Compared to the 25 M⊙ in-shell scenario, more mass has been swept up in the 20 M⊙ in-shell scenario at an early phase of the SNR evolution because of the dense RSG wind bubble. This is equivalent to the SNR having a much higher ejecta mass. Consequently, the shock can enter deeper into the MS bubble shell with high velocity, with a density at the present shock position of nend = 0.58 cm-3, compared to only nend = 0.35 cm-3 for the 25 M⊙ in-shell scenario. Most of the CRs inside the SNR are confined at the acceleration region downstream of the shock. Zirakashvili & Ptuskin (2008) provide the CR density N0(E) at the shock front as discussed in Sect. 2.3, see also Appendix A. Here, we roughly assume 0.1RSNR (Zirakashvili & Ptuskin 2012) as the size of the region between shock and contact discontinuity. The CRs (with density N0) are assumed to be evenly distributed in this region. The total CR energy trapped in this downstream acceleration region can be calculated with  . The total swept-up gas at present can be assumed to be confined inside this region, with ~ 60 M⊙ and 30 M⊙ for scenario 20 M⊙ in-shell and 25 M⊙ in-shell, respectively. Upstream of the shock, the CRs are mainly confined inside the acceleration region with size ~ 0.05 RSNR, where the magnetic turbulence is amplified by the CRs. This region has a much lower CR pressure (~10 times lower) than the downstream region (Zirakashvili & Ptuskin 2012). For the γ-ray spectrum, we therefore did not include the upstream contribution from hadronic interactions, although the total target gas mass here is higher (~2 times higher in our scenarios) than in the downstream area. In our model, the estimate of the CR density distribution near the shock is consistent with the acceleration theory in Zirakashvili & Ptuskin (2008, 2012); see, e.g., the CR distribution in Fig. 2 (shock speed 3300 km s-1) and Fig. 4 (shock speed 660 km s-1) in Zirakashvili & Ptuskin (2012).
Table 3 lists the parameters for our optimized model scenarios. We introduce a very hard CR spectrum at the shock, N0 ∝ E-1.5, to be compliant with the Fermi-LAT upper limit of the SNR (Acero et al. 2015). In Fig. 4, the resulting γ-ray spectra are compared to the observational data from HESS J1731-347 and HESS J1729-345. The spectrum of HESS J1729-345 is fitted well in both scenarios with a diffusion coefficient D10 = 1028 cm2 s-1,δ = 0.5 set over the entire space, but the 20 M⊙ in-shell and 25 M⊙ in-shell scenarios would need CRsdensities or swept-up masses about 3 and 8 times higher, respectively, to fit the spectrum of the SNR itself. For these scenarios, the swept-up gas mass is constrained by the requirement of maintaining a high shock speed, and the downstream CR density is constrained mainly by the total CR energy content generated by the SNR, ECR,end + ECR,sh ≲ 0.1 Eej. An acceptable fit to the data both for HESS J1731-347 and for MC-J1729 could be achieved (not shown) only when we substantially violated these limits and increased the diffusion coefficient above Galactic standard.
In summary, for the presented shock “in-shell” scenarios with approximate estimates of the CR population and gas densities downstream and upstream of the shock, the corresponding hadronic γ-ray emission is well below the measured TeV emission from HESS J1731-347. This is in agreement with the conclusions by Acero et al. (2015) concerning the dominant leptonic nature of the γ-ray emission from the SNR. There are however additional processes that still may contribute significantly to the γ-ray emission in direction of HESS J1731-347. For example, some of the observed TeV emissioninside the SNR region can be caused by hadronic γ-ray emission in molecular clouds located far from the SNR but still along the line of sight of the SNR. The corresponding spectral component would resemble that expected from MC-J1729 (cf. Fig.3) with a peak at high energies. Since the measured TeV morphology of HESS J1731-347 is shell-like, a dominant contribution of this effect is not very likely. Another possibility is that molecular cloud clumps may have survived the MS wind. As they were embedded inside the MS bubble, the forward shock of SNR could have passed around these clumps. Such molecular cloud clumps can easily provide 102 ~ 4M⊙ target material for hadronic CR-induced γ-ray emission inside the SNR. Observational evidence may come from the detection of molecular clumps with strong velocity dispersion within the SNR with more detailed CO or CS data; compare, for example, to the SNR CTB 109 (Sasaki et al. 2006).
Recently, Fukuda et al. (2014) suggested that HESS J1731-347 could be associated with gas located in the 3 kpc arm of our galaxy, using data from Nanten and HI data at − 90 km s-1 to − 75 km s-1. In this scenario, the SNR would have a distance to Earth of ~ 5.2 kpc and a radius of ~ 25 pc. A hadronic origin of the TeV γ-ray emission was argued to be likely under these circumstances. Here, we note that such a setting could also be accommodated for in our model scenarios, if we artificially increase the MS bubble to a size Rb> 25 pc. Then, a SNR with 20 M⊙ progenitor mass and a SN kinetic energy of 2 × 1051 erg can maintain a shock speed ~2000 km s-1 after ~8000 yr when the SNR shock expands to 25 pc.
3.3. On the isotropic diffusion assumption
The presented work has shown that the γ-ray luminosity of HESS J1729-345 can be explained through escaping CRs from the SNR HESS J1731-347 without invoking an order of magnitude lower than Galactic CR diffusion speed in the vicinity of the SNR. MC-J1729 can dominate the TeV emission outside the SNR assuming isotropic diffusion by adopting a reasonable three-dimensional molecular cloud structure. There is no need to invoke anisotropic CR diffusion (Jokipii 1966; Nava & Gabici 2013; Malkov et al. 2013; Giacinti et al. 2013) to boost the CR density in a particular direction.
Nevertheless, a diffusive transport of CRs is necessary to transform a distribution of CRs at escape time, that is in energy space narrowly peaked around Emax, into a sufficiently widened particle spectrum that is after γ-ray emission broadly compatible with the measured TeV spectrum.
However, the assumption of diffusive CR propagation on scales where cross-field diffusion of particles is not a dominant process may not necessarily be justified. On short scales, high energy CR particles are rather traveling along magnetic flux tubes as bulk movement (e.g., Giacinti et al. 2013) with corresponding decoherence lengths of ~ 100 pc. In the most extreme case, a monoenergetic particle distribution injected near the SNR could be preserved until the CRs hit a nearby molecular cloud. Such a scenario would be incompatible with the TeV γ-ray spectrum of HESS J1729-345. We have to assume that MC-J1729 is irradiated by CRs after an effective diffusion length of 30 pc, while particles may have traveled on more extended scales before returning to the cloud. Therefore, we also did not consider modifications on the γ-ray emissivity in the line of sight to the observer that result from an anisotropic CR momentum distribution, occurring initially in magnetic flux tube bulk movement as in pure ballistic particle propagation (Prosekin et al. 2015). The evaluation of possible consequences of this assumption is deferred to future work.
4. Conclusion
Through exploring the SNR evolution history with different scenarios (8 M⊙, 15 M⊙, 20 M⊙, and 25 M⊙ progenitor masses), we found that the SNR HESS J1731-347 is most likely still expanding inside its progenitor main-sequence wind bubble. With 20 M⊙ and 25 M⊙ progenitor mass scenarios, we successfully reproduce relatively fast shocks of > 2000 km s-1 at present time (~ 6 kyr and ~ 3 kyr after the SN explosion), which is required by the nonthermal X-ray emission detected from the SNR.
One of our main goals was to verify whether the TeV emission from the nearby source HESS J1729-345 can be explained by γ-ray emission from runaway CRs that have been accelerated in HESS J1731-347 and presently illuminate molecular clouds near the SNR. To this extent, a simplified three-dimensional molecular cloud geometry near the SNR was constructed in accordance with existing 12CO data. Adopting the CR acceleration model of nonresonant streaming instability from Zirakashvili & Ptuskin (2008), the CR injection into the surroundings of the SNR was calculated throughout the different simulated SNR evolutions. Diffusion of the CR particles into the inhomogeneous surrounding medium was simulated by means of a Monte Carlo transport code. By placing HESS J1729-345 30 pc away from the center of the SNR, its spectrum can be reproduced in scenarios with 20 M⊙ and 25 M⊙ progenitor masses, with a diffusion coefficient of D10 = 1028 cm2 s-1, δ = 0.3, inside the molecular cloud clumps.
The following key features of our simulationsare basically driven by the young age of the SNR in our model scenario:
-
The escaped CRs concentrate in one energy band at relativelyhigh energies. The simulated TeV γ-ray spectrum of HESS J1729-347 peaks at ~ 1 TeV. Thus no detection from Fermi is expected in our model. Future HESS-II or CTA observationswith high sensitivity around 100 GeV may also provide key evidence for our model.
-
The CR density drops very fast with increasing distance from the SNR. Inside the 20 M⊙ progenitor mass scenario, we also explored the parameter space by adopting different diffusion coefficients at the ICM or inside MC clumps. The observed TeV image can be explained well assuming a Galactic diffusion coefficient in the ICM (D10 = 1028 cm2 s-1,δ = 0.3−0.5). Assuming that HESS J1729-345 is ~30 pc away from the center of the SNR, γ-rays from hadronic interactions from the corresponding molecular cloud can very well dominate the TeV emission outside the SNR, when the densest MC region is placed at a larger distance ~100 pc from the SNR.
Although the GeV upper limits from Fermi-LAT favor a leptonic nature of the γ-ray emission from the SNR, we introduced two additional scenarios (20 M⊙ in-shell and 25 M⊙ in-shell) in which the SNR has at present started to evolve into the progenitor MS bubble shell. Also in these scenarios, the TeV γ-ray spectrum of HESS J1729-345 can be reproduced with hadronic emission from runaway CRs, when adopting a diffusion coefficient D10 = 1028 cm2 s-1,δ = 0.5 everywhere. Still, it seems that the hadronic contribution to the SNR γ-ray emission does not dominate also under such conditions either; the expected emission from the downstream region of the shock only provides ~ 30% and ~ 12% of the observed TeV emissionfor the two in-shell scenarios, respectively.
Here we use RSNR instead of RAbs, because J is calculated through a plane-parallel shock approximation.
Acknowledgments
We thank H. Völk for important suggestions on SNR evolution, CR acceleration, and CR diffusion. We thank V. Zirakashvili for extensive support on CR acceleration theory. We thank S. Ostapchenko for providing the proton-proton collision cross-section table. The work was supported by the German Science Foundation (DFG) in the DFG priority program SPP 1573 through grant PU 308/1-1.
References
- Abramowski, A., et al. (H.E.S.S. Collaboration) 2011, A&A, 531, A81 [NASA ADS] [CrossRef] [EDP Sciences] [Google Scholar]
- Abdo, A. A., Ackermann, M., Ajello, M., et al. 2010, ApJ, 718, 348 [NASA ADS] [CrossRef] [Google Scholar]
- Acero, F., Lemoine-Goumard, M., Renaud, M., et al. 2015, A&A, 580, A74 [NASA ADS] [CrossRef] [EDP Sciences] [Google Scholar]
- Aharonian, F. 2004, 22nd Texas Symposium on Relativistic Astrophysics, 43 [Google Scholar]
- Aharonian, F. A., & Atoyan, A. M. 1996, A&A, 309, 917 [NASA ADS] [Google Scholar]
- Aharonian, F. A., & Atoyan, A. M. 1999, A&A, 351, 330 [NASA ADS] [Google Scholar]
- Aharonian, F., Akhperjanian, A. G., Bazer-Bachi, A. R., et al. 2008a, A&A, 481, 401 [NASA ADS] [CrossRef] [EDP Sciences] [MathSciNet] [PubMed] [Google Scholar]
- Aharonian, F., Akhperjanian, A. G., Barres de Almeida, U., et al. 2008b, A&A, 477, 353 [NASA ADS] [CrossRef] [EDP Sciences] [Google Scholar]
- Bamba, A., Pühlhofer, G., Acero, F., et al. 2012, ApJ, 756, 149 [NASA ADS] [CrossRef] [EDP Sciences] [Google Scholar]
- Bell, A. R. 2004, MNRAS, 353, 550 [Google Scholar]
- Berezhko, E. G., & Völk, H. J. 2000, A&A, 357, 283 [NASA ADS] [Google Scholar]
- Berezhko, E. G., & Völk, H. J. 2006, A&A, 451, 981 [NASA ADS] [CrossRef] [EDP Sciences] [Google Scholar]
- Berezhko, E. G., Pühlhofer, G., & Völk, H. J. 2003, A&A, 400, 971 [NASA ADS] [CrossRef] [EDP Sciences] [Google Scholar]
- Berezhko, E. G., Pühlhofer, G., & Völk, H. J. 2009, A&A, 505, 641 [NASA ADS] [CrossRef] [EDP Sciences] [Google Scholar]
- Berezinskii, V. S., Bulanov, S. V., Dogiel, V. A., & Ptuskin, V. S. 1990, Astrophysics of Cosmic Rays, ed. V. L. Ginzburg (Amsterdam: North-Holland) [Google Scholar]
- Bisnovatyi-Kogan, G. S., & Silich, S. A. 1995, Rev. Mod. Phys., 67, 661 [NASA ADS] [CrossRef] [Google Scholar]
- Chen, Y., Zhou, P., & Chu, Y.-H. 2013, ApJ, 769, L16 [NASA ADS] [CrossRef] [Google Scholar]
- Chevalier, R. A. 1982, ApJ, 259, 302 [NASA ADS] [CrossRef] [Google Scholar]
- Chevalier, R. A. 1999, ApJ, 511, 798 [NASA ADS] [CrossRef] [Google Scholar]
- Chevalier, R. A. 2005, ApJ, 619, 839 [NASA ADS] [CrossRef] [Google Scholar]
- Crutcher, R. M. 2012, ARA&A, 50, 29 [NASA ADS] [CrossRef] [Google Scholar]
- Dame, T. M., Hartmann, D., & Thaddeus, P. 2001, ApJ, 547, 792 [NASA ADS] [CrossRef] [Google Scholar]
- Fatuzzo, M., Melia, F., Todd, E., & Adams, F. C. 2010, ApJ, 725, 515 [NASA ADS] [CrossRef] [Google Scholar]
- Fukuda, T., Yoshiike, S., Sano, H., et al. 2014, ApJ, 788, 94 [NASA ADS] [CrossRef] [Google Scholar]
- Gabici, S., & Aharonian, F. A. 2007, ApJ, 665, L131 [NASA ADS] [CrossRef] [Google Scholar]
- Gabici, S., Aharonian, F. A., & Casanova, S. 2009, MNRAS, 396, 1629 [NASA ADS] [CrossRef] [Google Scholar]
- Gabici, S., Casanova, S., Aharonian, F. A., & Rowell, G. 2010, SF2A-2010: Proceedings of the Annual meeting of the French Society of Astronomy and Astrophysics, 313 [Google Scholar]
- Giacinti, G., Kachelrieß, M., & Semikoz, D. V. 2013, Phys. Rev. D, 88, 023010 [NASA ADS] [CrossRef] [Google Scholar]
- Han, J. L., Ferriere, K., & Manchester, R. N. 2004, ApJ, 610, 820 [NASA ADS] [CrossRef] [Google Scholar]
- Jokipii, J. R. 1966, ApJ, 146, 480 [Google Scholar]
- Kachelrieß, M., & Ostapchenko, S. 2012, Phys. Rev. D, 86, 043004 [NASA ADS] [CrossRef] [Google Scholar]
- Klochkov, D., Pühlhofer, G., Suleimanov, V., et al. 2013, A&A, 556, A41 [NASA ADS] [CrossRef] [EDP Sciences] [Google Scholar]
- Klochkov, D., Suleimanov, V., Pühlhofer, G., et al. 2015, A&A, 573, A53 [NASA ADS] [CrossRef] [EDP Sciences] [Google Scholar]
- Li, H., & Chen, Y. 2010, MNRAS, 409, L35 [NASA ADS] [CrossRef] [Google Scholar]
- Li, H., & Chen, Y. 2012, MNRAS, 421, 935 [NASA ADS] [CrossRef] [Google Scholar]
- Malkov, M. A., Diamond, P. H., & Sagdeev, R. Z. 2005, ApJ, 624, L37 [NASA ADS] [CrossRef] [Google Scholar]
- Malkov, M. A., Diamond, P. H., Sagdeev, R. Z., Aharonian, F. A., & Moskalenko, I. V. 2013, ApJ, 768, 73 [NASA ADS] [CrossRef] [Google Scholar]
- Maxted, N., Rowell, G., de Wilt, P., et al. 2015, ArXiv e-prints [arXiv:1503.06717] [Google Scholar]
- Nadezhin, D. K. 1985, Ap&SS, 112, 225 [NASA ADS] [CrossRef] [Google Scholar]
- Nava, L., & Gabici, S. 2013, MNRAS, 429, 1643 [NASA ADS] [CrossRef] [Google Scholar]
- Ohira, Y., Murase, K., & Yamazaki, R. 2011, MNRAS, 410, 1577 [NASA ADS] [Google Scholar]
- Ostriker, J. P., & McKee, C. F. 1988, Rev. Mod. Phys., 60, 1 [NASA ADS] [CrossRef] [Google Scholar]
- Parker, E. N. 1958, ApJ, 128, 664 [Google Scholar]
- Prosekin, A. Y., Kelner, S. R., & Aharonian, F. A. 2015, Phys. Rev. D, 92, 083003 [NASA ADS] [CrossRef] [Google Scholar]
- Ptuskin, V. 2006, J. Phys. Conf. Ser., 47, 113 [NASA ADS] [CrossRef] [Google Scholar]
- Ptuskin, V. S., & Zirakashvili, V. N. 2005, A&A, 429, 755 [NASA ADS] [CrossRef] [EDP Sciences] [MathSciNet] [PubMed] [Google Scholar]
- Sasaki, M., Kothes, R., Plucinsky, P. P., Gaetz, T. J., & Brunt, C. M. 2006, ApJ, 642, L149 [NASA ADS] [CrossRef] [Google Scholar]
- Smartt, S. J. 2009, ARA&A, 47, 63 [NASA ADS] [CrossRef] [Google Scholar]
- Tian, W. W., Leahy, D. A., Haverkorn, M., & Jiang, B. 2008, ApJ, 679, L85 [NASA ADS] [CrossRef] [Google Scholar]
- Vink, J. 2012,A&ARv, 20, 49 [Google Scholar]
- Vink, J. 2013, in 370 Years of Astronomy in Utrecht, ASP Conf. Ser., 470, 269 [NASA ADS] [Google Scholar]
- Weaver, R., McCray, R., Castor, J., Shapiro, P., & Moore, R. 1977, ApJ, 218, 377 [NASA ADS] [CrossRef] [Google Scholar]
- Yang, R.-z., Zhang, X., Yuan, Q., & Liu, S. 2014, A&A, 567, A23 [NASA ADS] [CrossRef] [EDP Sciences] [Google Scholar]
- Zirakashvili, V. N., & Ptuskin, V. S. 2008, ApJ, 678, 939 [NASA ADS] [CrossRef] [Google Scholar]
- Zirakashvili, V. N., & Ptuskin, V. S. 2012, Astropart. Phys., 39, 12 [NASA ADS] [CrossRef] [Google Scholar]
- Zirakashvili, V. N., Ptuskin, V. S., Völk, H. J. 2008, ApJ, 678, 255 [NASA ADS] [CrossRef] [Google Scholar]
Appendix A: The acceleration theory of Zirakashvili & Ptuskin (2008)
The momentum distribution of CRs at the shock front can be written as: 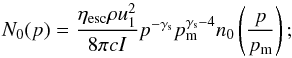 (A.1)where u1 = vSNR is the shock speed, ρ is the density of the ambient gas, p (pmax) is the momentum (maximum momentum) of the CRs. The parameter I is a normalization factor, for γs = 4 (as used in Sect. 3.1) I = 1/4;
  is the ratio between the energy flux of escaping CRs and the kinetic energy flux of the upstream medium that is approaching the shock, and
 ![Mathematical equation: \appendix \setcounter{section}{1} \begin{equation} n_0 (s)= \exp\left[ -\gamma_\mathrm{s} \int_0^s \frac{{\rm d}s_1/s_1}{\exp(s_1^{-2})-1} \right] \cdot \label{equ:n_0} \end{equation}](/articles/aa/full_html/2016/07/aa28505-16/aa28505-16-eq273.png) (A.2)Beyond an absorption boundary, CR particles are assumed to travel freely into space. The absorption boundary is set to L = tSNRvSNR, where L is measured from the shock position RSNR in radial direction outward. The flux of escaping particles at the absorption boundary can be written as follows:
(A.2)Beyond an absorption boundary, CR particles are assumed to travel freely into space. The absorption boundary is set to L = tSNRvSNR, where L is measured from the shock position RSNR in radial direction outward. The flux of escaping particles at the absorption boundary can be written as follows:  (A.3)In Zirakashvili & Ptuskin (2008) and the presented work, the momentum distribution of particles is used, which can be transformed to an energy distribution through f(E)dE = 4πp2f(p)dp, E = pc.
To obtain the escape energy pmc, one needs to know the size of the absorption boundary, the shock speed u1, the density of the incoming gas from upstream nH, and the amplified magnetic field Br. Zirakashvili & Ptuskin (2008) provide an approximated analytical solution. ![Mathematical equation: \appendix \setcounter{section}{1} \begin{equation} p_\mathrm{m}c=\frac {\eta _\mathrm{esc}qu_1^2B_0L}{4cV_\mathrm{A}} \left\{ \begin{array}{ll} \ln ^{-1}\left( \frac {2B_0u_1^2}{B_\mathrm{b}u_*^2}\right) , u_1<u_*\\ \left[ \ln \left( \frac {2B_0}{B_\mathrm{b}}\right) -1 +\left( 2\frac {u_1^4}{u_*^4}-1\right) ^{1/4} \right] ^{-1}, \ u_1>u_* \end{array} \right. \end{equation}](/articles/aa/full_html/2016/07/aa28505-16/aa28505-16-eq281.png) (A.4)where the velocity
(A.4)where the velocity  , and the Alfvén velocity
  .
.
The value B0 is the original unamplified magnetic field in the upstream region, and Bb is the initial value of magnetic fluctuations in the upstream region, which is set to ln(2B0/Bb) = 5.
One important caveat is that in the CR acceleration model as elaborated in Zirakashvili & Ptuskin (2008), nonresonant instabilities only become efficient when the shock speed is high enough, vsh> (1340 km s-1)(VA/ 10 km s-1)2/3(ηesc/ 0.05)− 1/3.
Appendix B: The SNR evolution histories for all modeled scenarios
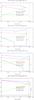 |
Fig. B.1 Evolution profile of the SNR with the shock velocity vSNR (red), the age of the SNR tSNR (green), and the CR particle escape energy Emax (blue) plotted against the SNR radius. Also shown is the density of the circumstellar medium nISM (black) out to 25 pc distance. From top to bottom are four different scenarios: 8 M⊙ SN IIP, 15 M⊙ SN IIP, 20 M⊙ SN IIL/b, and 25 M⊙ SN Ib/c. The current SNR size (15 pc) is indicated with a dashed line. The time, velocity and escape energy profiles are cut off when the shock speed is too low (vSNR ≪ 1000 km s-1) for applying the prescriptions of Zirakashvili & Ptuskin (2008) to compute a CR particle escape energy. See detailed parameters in Table 1. |
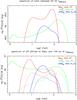 |
Fig. B.2 Top panel: particle spectra of all CRs released from the SNR, integrated from the time of the SN explosion to tSNR,end. The SNR ages at tSNR,end are 15.5 kyr, 5.8 kyr, 6.1 kyr, and 2.9 kyr corresponding to the 8 M⊙ SN IIP (red), 15 M⊙ SN IIP (green), 20 M⊙ SN IIL/b (blue), and 25 M⊙ SN Ib/c (cyan) scenarios. Bottom panel: the particle spectra of CRs that have diffused in a homogeneous environment from the SNR to 30 pc (solid lines) and 100 pc (dashed lines) distance. These spectra are obtained by multiplying the CR density at 30 pc and 100 pc with the volume of MC-J1729 (4/3πR3,R = 7.8 pc) and the volume of MC-core (R = 7.2 pc), respectively. |
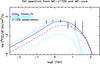 |
Fig. B.3 Simulated γ-ray spectra from hadronic collisions of CRs inside MC-J1729 (solid lines) and MC-core (dashed lines). The spectra are obtained through multiplication of the simulated CR density at 30 pc (100 pc) with the total mass of MC-J1729 (MC-core) for the 20 M⊙ SN IIL/b (blue) and the 25 M⊙ SN Ib/c (cyan) scenarios. Observational data from Abramowski et al. (2011) for HESS J1729-345 are shown as black circles. |
The SNR evolution histories of all four SN scenarios discussed in Sect. 3.1 are represented in Fig. B.1, the parameters used here are those from Table 1. Our SNR models need to evolve inside different regions with significant density changes of the circumstellar medium. For the Sedov phase, the thin-shell approximation solution can naturally cover those density changes, but for the ejecta-dominated phase, each scenario is treated individually.
-
In the 8 M⊙ scenario, the SNR radius first follows RSNR ∝ t4/7 during the ejecta-dominated phase; after the SNR has swept up ~ 1.5 Mej of ICM at around 800 yr, it enters the Sedov phase.
-
In the 15 M⊙ scenario, inside the RSG bubble the SNR evolution follows RSNR ∝ t7/8; once the SNR reaches the empty MS wind bubble, we simply assume that the shock velocity remains constant. Right after the SNR reaches the MS wind bubble shell at ~ 2000 yr, the SNR quickly enters the Sedov phase in less than 100 yr.
-
In the 20 M⊙ scenario, the SNR radius first follows RSNR ∝ t7/8 during the ejecta-dominated phase. At ~ 30 yr, when the SNR is still inside the RSG bubble, the SNR has swept up ~ 0.4 Mej and enters the Sedov phase.
-
In the 25 M⊙ scenario, the SNR radius first follows RSNR ∝ t4/7 during the ejecta-dominated phase. At ~ 1700 yr, the SNR has swept up ~ 1.6 Mej and enters the Sedov phase.
In Figs. B.2 and B.3, a homogeneous diffusion coefficient (D10 = 1028 cm2/ s,δ = 0.3) is adopted over the entire place, which means that we can directly obtain the density of the diffusing CRs at 30 pc and 100 pc distance from the SNR at present time tend through an analytical diffusion solution. To roughly estimate the final simulated TeV spectrum as shown in Fig. B.3, the CR density at the clouds is multiplied with the masses of MC-J1729 and MC-core, respectively.
All Tables
All Figures
|
Fig. 1 The top image shows in grayscale the molecular gas density along the line of sight to HESS J1731-347 in a distance interval 2.5−4.0 kpc, derived by integrating the |
| In the text | |
|
Fig. 2 Evolution profiles of the SNR of the SNe IIL/b scenario: density of the circumstellar medium (black), shock velocity (red), age of the SNR (green) and escape energy (blue) along with SNR radius. The SNR size (15 pc) is indicated with a dashed line. The time, velocity, and escape energy profiles are cut off when shock speed drops significantly (vSNR ≪ 1000 km s-1). |
| In the text | |
|
Fig. 3 Predictions for the TeV γ-ray emission from the escaping CRs in the 20 M⊙ progenitor mass scenario, which are derived using Monte Carlo simulations for the CR diffusion into the inhomogeneous medium. In the top panel, predictions for the TeV spectrum at MC-J1729 (solid lines) and MC-core (dashed lines) are shown, for different diffusion scenarios (red, green, and blue) corresponding to the parameters that are given in Table 2. The bottom panel sky image shows the predicted 1 TeV image for the “slow diffusion in MC” scenario (blue lines in the top panel). Green contours correspond to the TeV image from Abramowski et al. (2011); the large and small dashed circles represent the locations of HESS J1731-345 and HESS J1729-347, respectively. |
| In the text | |
|
Fig. 4 TeV spectra resulting from hadronic CR-gas interactions, from CRs trapped inside the downstream of shock region of SNR HESS J1731-347 (solid lines) and from CRs interacting with MC-J1729 (dashed lines). Red/green lines represent the 20 M⊙ in-shell and 25 M⊙ in-shell scenarios shown in Table 3. Adopting a Galactic standard diffusion coefficient D10 = 1028 cm2 s-1,δ = 0.5 over the entire space, we fitted the spectrum of MC-J1729 (at 30 pc distance from the center of the SNR). Observational data from Abramowski et al. (2011) and Acero et al. (2015) for HESS J1731-347 and HESS J1729-345 are shown as blue stars and black circles, respectively. |
| In the text | |
|
Fig. B.1 Evolution profile of the SNR with the shock velocity vSNR (red), the age of the SNR tSNR (green), and the CR particle escape energy Emax (blue) plotted against the SNR radius. Also shown is the density of the circumstellar medium nISM (black) out to 25 pc distance. From top to bottom are four different scenarios: 8 M⊙ SN IIP, 15 M⊙ SN IIP, 20 M⊙ SN IIL/b, and 25 M⊙ SN Ib/c. The current SNR size (15 pc) is indicated with a dashed line. The time, velocity and escape energy profiles are cut off when the shock speed is too low (vSNR ≪ 1000 km s-1) for applying the prescriptions of Zirakashvili & Ptuskin (2008) to compute a CR particle escape energy. See detailed parameters in Table 1. |
| In the text | |
|
Fig. B.2 Top panel: particle spectra of all CRs released from the SNR, integrated from the time of the SN explosion to tSNR,end. The SNR ages at tSNR,end are 15.5 kyr, 5.8 kyr, 6.1 kyr, and 2.9 kyr corresponding to the 8 M⊙ SN IIP (red), 15 M⊙ SN IIP (green), 20 M⊙ SN IIL/b (blue), and 25 M⊙ SN Ib/c (cyan) scenarios. Bottom panel: the particle spectra of CRs that have diffused in a homogeneous environment from the SNR to 30 pc (solid lines) and 100 pc (dashed lines) distance. These spectra are obtained by multiplying the CR density at 30 pc and 100 pc with the volume of MC-J1729 (4/3πR3,R = 7.8 pc) and the volume of MC-core (R = 7.2 pc), respectively. |
| In the text | |
|
Fig. B.3 Simulated γ-ray spectra from hadronic collisions of CRs inside MC-J1729 (solid lines) and MC-core (dashed lines). The spectra are obtained through multiplication of the simulated CR density at 30 pc (100 pc) with the total mass of MC-J1729 (MC-core) for the 20 M⊙ SN IIL/b (blue) and the 25 M⊙ SN Ib/c (cyan) scenarios. Observational data from Abramowski et al. (2011) for HESS J1729-345 are shown as black circles. |
| In the text | |
Current usage metrics show cumulative count of Article Views (full-text article views including HTML views, PDF and ePub downloads, according to the available data) and Abstracts Views on Vision4Press platform.
Data correspond to usage on the plateform after 2015. The current usage metrics is available 48-96 hours after online publication and is updated daily on week days.
Initial download of the metrics may take a while.