Fig. 3
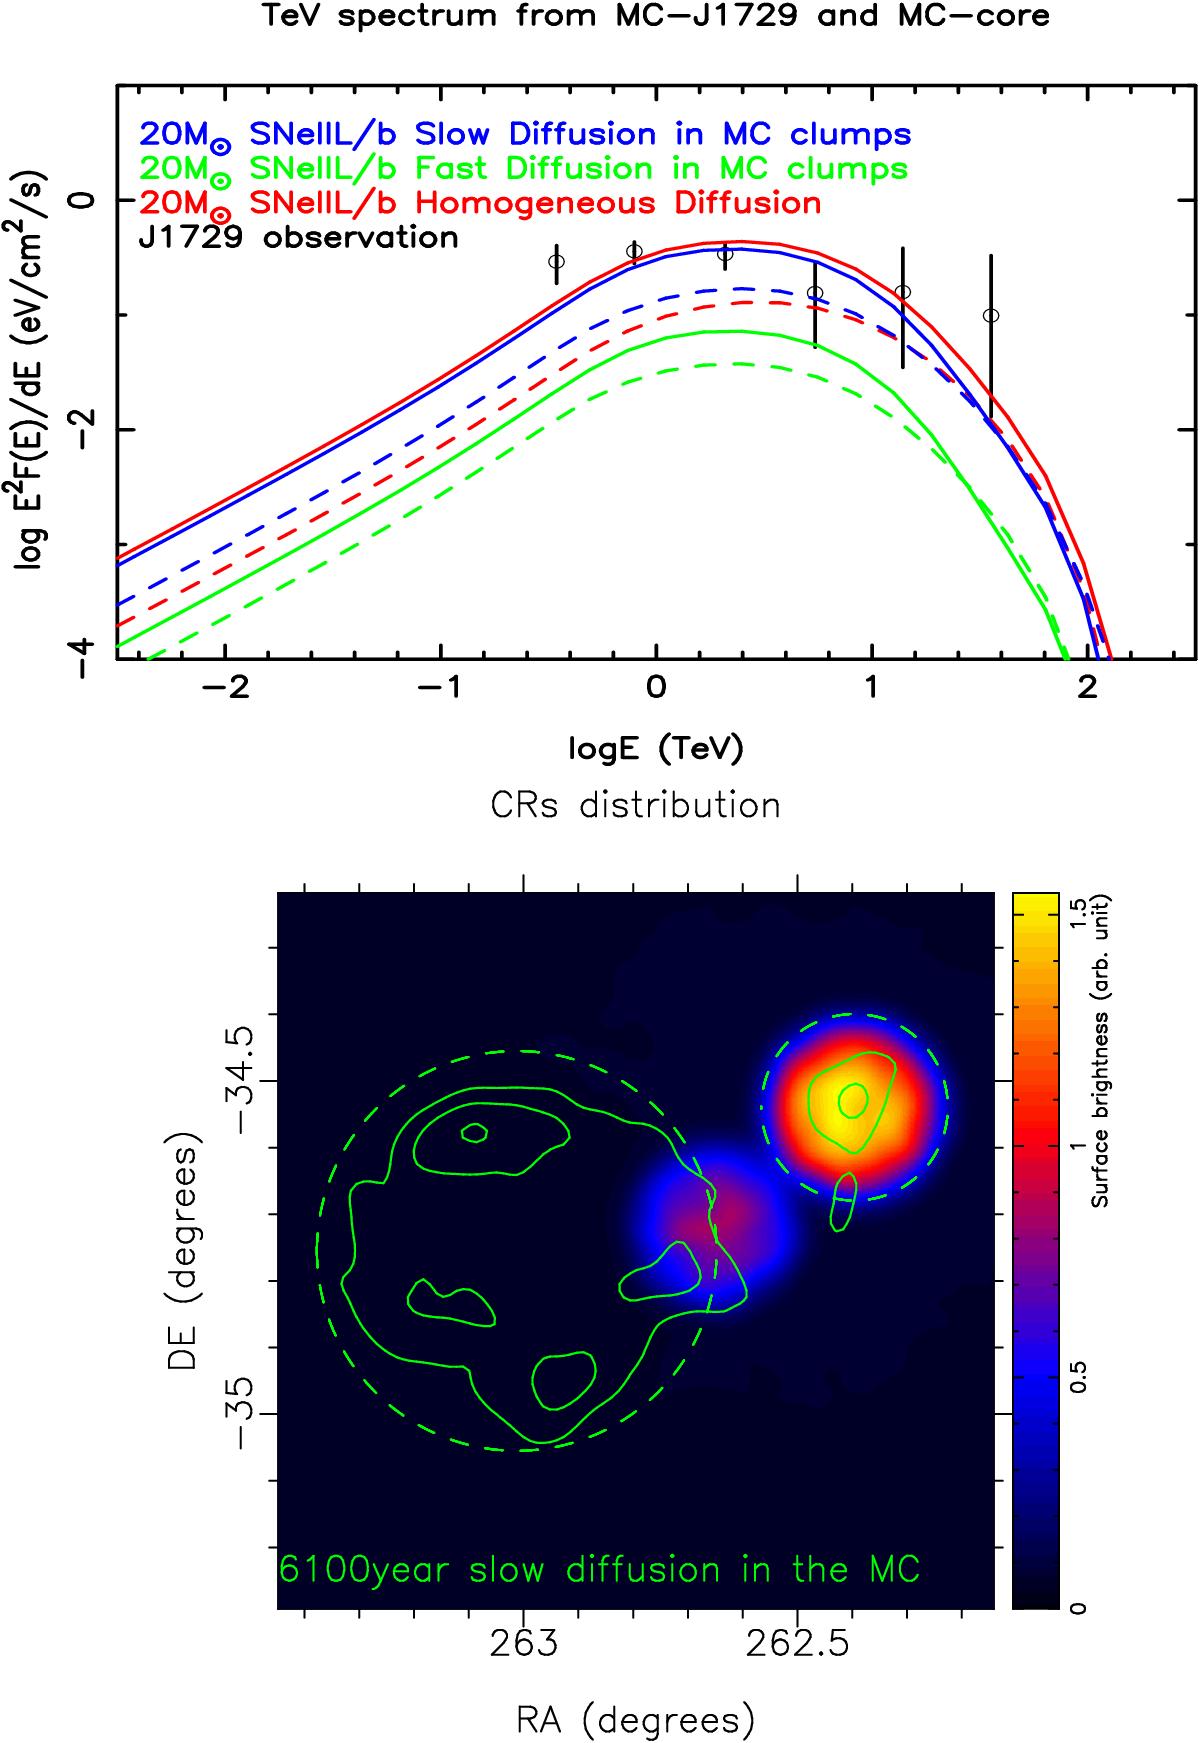
Predictions for the TeV γ-ray emission from the escaping CRs in the 20 M⊙ progenitor mass scenario, which are derived using Monte Carlo simulations for the CR diffusion into the inhomogeneous medium. In the top panel, predictions for the TeV spectrum at MC-J1729 (solid lines) and MC-core (dashed lines) are shown, for different diffusion scenarios (red, green, and blue) corresponding to the parameters that are given in Table 2. The bottom panel sky image shows the predicted 1 TeV image for the “slow diffusion in MC” scenario (blue lines in the top panel). Green contours correspond to the TeV image from Abramowski et al. (2011); the large and small dashed circles represent the locations of HESS J1731-345 and HESS J1729-347, respectively.
Current usage metrics show cumulative count of Article Views (full-text article views including HTML views, PDF and ePub downloads, according to the available data) and Abstracts Views on Vision4Press platform.
Data correspond to usage on the plateform after 2015. The current usage metrics is available 48-96 hours after online publication and is updated daily on week days.
Initial download of the metrics may take a while.