Fig. 1
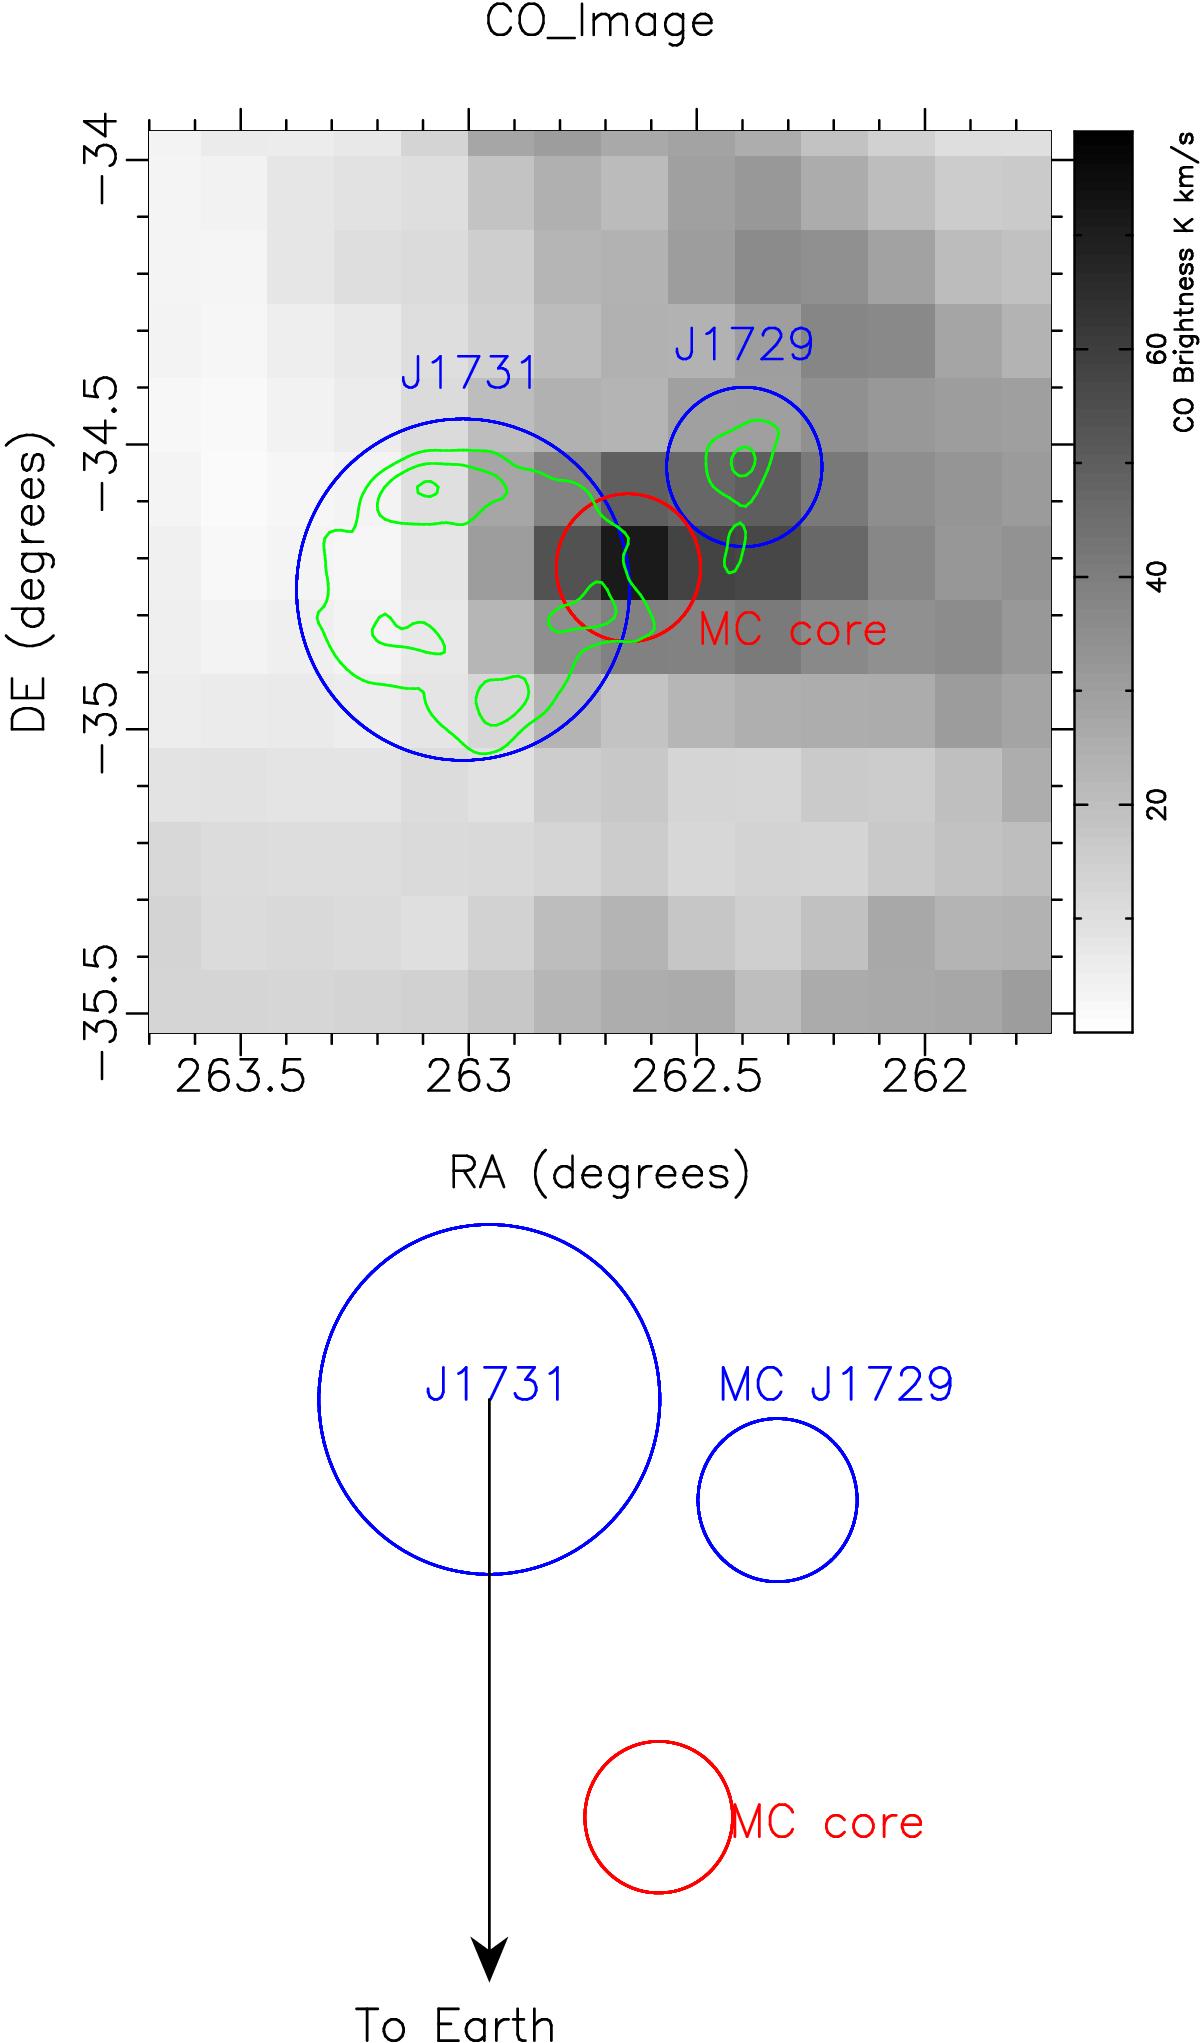
The top image shows in grayscale the molecular gas density along the line of sight to HESS J1731-347 in a distance interval 2.5−4.0 kpc, derived by integrating the ![]() emission from the CfA CO survey from − 13 km s-1 to − 25 km s-1 (same interval as used in Abramowski et al. 2011). The large and small blue circles represent the regions from where the observational spectra of HESS J1731-347 and HESS J1729-345 were obtained in Abramowski et al. (2011), respectively. The red circle represents the position of the densest core of the modeled molecular cloud. The bottom sketch depicts the modeled geometry with a view from above the Galactic plane.
emission from the CfA CO survey from − 13 km s-1 to − 25 km s-1 (same interval as used in Abramowski et al. 2011). The large and small blue circles represent the regions from where the observational spectra of HESS J1731-347 and HESS J1729-345 were obtained in Abramowski et al. (2011), respectively. The red circle represents the position of the densest core of the modeled molecular cloud. The bottom sketch depicts the modeled geometry with a view from above the Galactic plane.
Current usage metrics show cumulative count of Article Views (full-text article views including HTML views, PDF and ePub downloads, according to the available data) and Abstracts Views on Vision4Press platform.
Data correspond to usage on the plateform after 2015. The current usage metrics is available 48-96 hours after online publication and is updated daily on week days.
Initial download of the metrics may take a while.