| Issue |
A&A
Volume 580, August 2015
|
|
|---|---|---|
| Article Number | A11 | |
| Number of page(s) | 18 | |
| Section | Extragalactic astronomy | |
| DOI | https://doi.org/10.1051/0004-6361/201425077 | |
| Published online | 20 July 2015 | |
Subaru and e-Merlin observations of NGC 3718
Diaries of a supermassive black hole recoil?⋆,⋆⋆
1 I. Physikalisches Institut, Universität zu Köln, Zülpicher Str. 77, 50937 Köln, Germany
e-mail: This email address is being protected from spambots. You need JavaScript enabled to view it.
2 Max-Planck-Institut für Radioastronomie, Auf dem Hügel 69, 53121 Bonn, Germany
3 Jodrell Bank Centre for Astrophysics, School of Physics and Astronomy, The University of Manchester, Oxford Road, Manchester M13 9P, UK
4 Miyagi University of Education, Sendai, Miyagi 980-0845, Japan
5 Göttingen eResearch Alliance, State and University Library Göttingen, Papendiek 14, 37073 Göttingen
Received: 29 September 2014
Accepted: 13 April 2015
Abstract
NGC 3718 is a low-ionization nuclear emission line region (LINER) L1.9 galaxy, lying at a distance of about ~17.4 Mpc from the Earth; its similarities with NGC 5128 often award it the name northern Centaurus A. The presence of a compact radio source with a candidate jet structure, a prominent dust lane, and a strongly warped molecular and atomic gas disk are indications that NGC 3718 has undergone some sort of a large-scale gravitational interaction sometime in the recent past, which channeled gas towards the center, feeding the black hole and igniting the central engine. One proposed scenario involves an encounter with the close neighboring galaxy NGC 3729, while other authors favor a merging event with mass ratio ≥(3−4):1 as the origin of NGC3718. We use high angular resolution (~100 mas) e-Merlin radio and Subaru near-IR (NIR) (~170 mas) data to take a detailed view of the processes taking place in its central region. In order to preserve some objectivity in our interpretation, we combine our results with literature values and findings from previous studies. Our NIR maps suggest, on the one hand, that towards the stellar bulge there are no large-scale absorption phenomena caused by the apparent dust lane and, on the other, that there is a significant (local) contribution from hot (~1000 K) dust to the nuclear NIR emission. The position where this takes place appears to be closer to the offset compact radio emission from our e-Merlin 6 cm map and is offset by ~4.25 pc from the center of the underlying stellar bulge. The shape of the radio map suggests the presence of one (or possibly two, forming an X-shape) bipolar structure(s) ~1 (~0.6) arcsec across, which combined with the balance between the gas and the stellar velocity dispersions and the presence of hard X-ray emission, point towards effects expected by AGN feedback. We also argue that NGC 3718 has a core in its surface brightness profile, although it is a gas-rich galaxy and we discuss its mixed photometric and spectroscopic characteristics. These characteristics combined with the observed spatial NIR and radio emission offsets, the relative redshift between the broad and the narrow Hα line, the limited star formation activity, and AGN feedback strongly imply the existence of a supermassive black hole recoil. Finally, we discuss a possible interpretation that could naturally incorporate all these findings into one physically consistent picture.
Key words: galaxies: kinematics and dynamics / galaxies: evolution / galaxies: active / galaxies: formation / galaxies: photometry
Appendices are available in electronic form at http://www.aanda.org
Based on data collected at Subaru Telescope, which is operated by the National Astronomical Observatory of Japan.
© ESO, 2015
1. Introduction
Knowledge of the circumnuclear activity in active galaxies is essential for understanding the fueling of the central engine. Our understanding of the underlying physical processes that contribute to the nuclear activity is, however, still far from being complete and conclusive. While on large scales (≥ ~ 3 kpc) the picture is clearer – because large-scale dynamical perturbations, i.e. galaxy collisions, mergers (e.g. Toomre & Toomre 1972), etc., have been proposed as the mechanisms responsible for removing angular momentum from the gas, driving it towards the central region – the corresponding processes at smaller scales (sub-kpc) are not very well understood. Mechanisms ranging from nested bars (e.g. Shlosman et al. 1989) and spirals (e.g. Martini & Pogge 1999) to warped nuclear disks (Schinnerer et al. 2000b,a) and m = 1 instabilities (Kormendy & Bender 1999; García-Burillo et al. 2000) have been proposed over the years to explain the smaller-scale phenomena; however, the discussion is still open.
An ideal laboratory for trying to shed light on some of these important questions is NGC 3718 (Fig. 1). NGC 3718 and its (assumed) companion NGC 3729 belong to the loose Ursa Major group, with NGC 3718 being one of the largest galaxies in the group. It is unclear, however, whether these two galaxies interact gravitationally and to what extent (Tully et al. 1996). Karachentsev et al. (2013) find that both galaxies belong to the subgroup NGC 3992 (named after the gravitationally dominant member), which is one of the most massive subgroups of Ursa Major. They also note that velocities within the NGC 3992 subgroup do not show any visible correlation with distances, indicating a non-virialized system. Morphologically, NGC 3718 was classified as an SB(s)a pec by de Vaucouleurs et al. (1991), mainly because of its prominent – “spiral-arm” ending – dust lane, which was considered indicative of the presence of a bar. Holmberg (1958) have classified NGC 3718 as an S0p, whereas other authors (e.g. Whitmore et al. 1990; Reshetnikov & Combes 1994), have classified it as a polar ring galaxy, confusing our understanding of its true morphology.
The distinguishing features of NGC 3718 are the prominent dust lane, which runs across the entire stellar bulge, and its strongly warped molecular and atomic gas disk. Several authors have extensively studied the gas dynamics of NGC 3718. Schwarz (1985) studied the HI dynamics and found that the atomic gas distribution forms a 3D warped structure, which could be described by tilted but concentric rings, orbiting from nearly edge-on at smaller radii to nearly face-on at larger radii. Pott et al. (2004) and Krips et al. (2005) studied the molecular gas distribution using CO(1 → 0), CO(2 → 1) and HCN(1 → 0) as tracers. They successfully fitted tilted rings on NGC 3718 and found that the molecular gas motion generally follows that of the HI gas, but that the warp continues down to scales of ~250 pc. Sparke et al. (2009) re-mapped the HI distribution using higher-resolution VLA data and confirmed (though with slightly different parameters) the tilted ring models of the aforementioned studies. They show that the outer gas orbits extend to ~35−42 kpc and they estimate its age at ~2−3 Gyr, whereas the inner gas orbits are nearly polar and are still under formation. Finally, they do not see any HI gas in the plane of rotation of the stellar disk and they argue in favor of the classification of NGC 3718 as a polar ring galaxy, invoking differential precession in order to account for the warp.
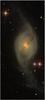 |
Fig. 1 9.5 × 4.5 arcmin SDSS gri composite image of NGC 3718. |
Some of these features are also present in NGC 5128, host of the famous Centaurus A radio source. A similar dust lane (Dufour et al. 1979) and a warp in the gas disk (e.g. Wild et al. 1997; Sparke 1996), along with the presence of radio emission (though more dominant) from the nucleus, are common properties which often lead to the characterization of NGC 3718 as the northern Centaurus A.
NGC 3718 is also one of the NUGA sources, a survey aimed at the study of nearby low-luminosity active galactic nuclei (LLAGNs; García-Burillo et al. 2003). Spectroscopically, it is classified as a low-ionization nuclear emission line region (LINER) L1.9 galaxy (Ho et al. 1997b). A weak broad Hα emission component with FWHMHα,Broad ≈ 2350 km s-1 is detected, originating from the nucleus. Additionally, the presence of strong [OI] λλ6300Å with FWHM[OI] ≈ 570 km s-1 is indicative of a hidden AGN (Filippenko & Sargent 1985). Krips et al. (2007) detect a candidate jet structure in an 18 cm Merlin radio map, lying NW of the nucleus and stretching to ~0.5 arcsec. They also measure the bolometric luminosity of ~1041 erg s-1, which implies a sub-Eddington system.
Chitre & Jog (2002) treat ARP214 (an alternative name for NGC 3718) as an advanced merger remnant, while Jog & Chitre (2002) discuss its mixed characteristics. Photometrically, it shows an exponential light profile (like a spiral galaxy), but kinematically it is mainly supported by pressure from the random motion of stars (like an elliptical galaxy), as indicated by the  within the inner few kpc. Bournaud et al. (2005) simulated galaxy mergers with mixed photometric and kinematic characteristics through N-body simulations and they find that such objects could result from mergers with mass ratios ≥(3−4.5):1.
This paper is organized as follows. In Sect. 2 we present the data and data reduction; in Sect. 3 we describe the pre-processing and alignment procedures; in Sect. 4 we present the NIR maps, we attempt a light decomposition, and we present the 6 cm e-Merlin radio map; in Sect. 5 we discuss the scaling relations, the classification, and the observed mixed characteristics of NGC 3718; in Sect. 6 we present additional observational evidence regarding the presence or not of a supermassive black hole (SMBH) recoil; and in Sect. 7 we try to put all the pieces together in order to get a physically consistent picture. Finally, in Appendices A–C, we provide additional information for the various arguments we present in this paper.
Throughout this paper we adopt the following. In all images north is up and east is left. The cosmology values used are ΩM = 0.27, ΩΛ = 0.73, and H0 = 67.8 km s-1, with a redshift of z = 0.003927 corrected to the reference frame defined by the 3K CMB1. These suggest a distance modulus μ = 31.2 and a distance D = 17.4 Mpc for NGC 3718. The cosmological scale for the adopted cosmology at this distance is 84  . We also use the mass-to-light ratio from Bell et al. (2003) for all the conversions from light to mass. The general form of their
  ratio in the NIR and optical (B−V) colors is
 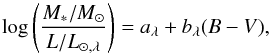 (1)with aλ and bλ being aJ = −0.261,aH = −0.209,aK = −0.206,bJ = 0.433,bH = 0.210, and bK = 0.135. For NGC 3718 this value is
  , using
  mag and
  mag, magnitudes corrected for extinction and K-corrections, taken from NASA/IPAC Extragalactic Database (NED)1.
2. Observation and data reduction
2.1. Subaru data
The data set used for the analysis of NGC 3718 consists of AO assisted near-IR (NIR) data in J (5), H (11), and KS (12) bands (number of images), taken on 17 May, 2012, with the Subaru telescope at Mauna Kea, Hawaii, using the HiCIAO (Suzuki et al. 2010) instrument, operating in the Direct Imaging Mode. The individual frame exposure time for all bands is  s, with the total duration of the observations being ~1h 40m. During this time, the total variation of airmass is ~0.082. The AO188 AO system is used (Hayano et al. 2010). It is equipped with a 188-element wavefront curvature sensor with photon counting APD modules and a 188-element bimorph mirror, installed at the IR Nasmyth platform of the Subaru telescope, which for this data set operates in self reference mode on the core of NGC 3718. As a result, the angular resolution of the data is ~170 mas. The 2048 × 2048 pixel2 Hawaii-IIRG HgCdTe detector provides a pixel scale of 0.010
 , with a field of view (FoV) of 20 × 20 arcsec2.
No reduction package was available for HiCIAO, so a pipeline was developed from scratch in order to correct for the high-frequency 32-strip artifact noise, introduced by the 32 readout channels of the detector. All images were dithered and have undergone the usual bad pixel correction, flat-fielding (dome-flat), alignment (based on ellipse fitting), and median coadd treatment. The final images allow us to generate sky frames for each band from the data themselves by clipping them near the modal background value and adding a high-frequency layer on top2 (Fig. 2). The data with the sky subtracted are shown in Fig. 3.
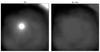 |
Fig. 2 KS band before sky subtraction (left) and the sky frame extracted from the KS image (right). Similar sky frames were created and subtracted from the J and H bands as well. |
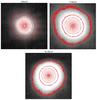 |
Fig. 3 J (top left), H (top right), and KS (bottom middle) ready-for-science images. |
2.2. e-Merlin data
The e-MERLIN synthesis telescope is a seven-element interferometer, with baselines of up to 217 km and connected by a new optical fiber network to Jodrell Bank Observatory near Manchester, UK. An inhomogeneous array, e-MERLIN is comprised of the 76 m Lovell telescope, a 32 m dish at Cambridge, and the following 25 m antennas: Mark II, Knockin, Defford, Pickmere, and Darnhall.
The data in this work were taken during the commissioning phase of e-MERLIN with only the five 25 m dishes, resulting in a primary beam of 10′, a maximum baseline of 133.7 km (between Pickmere and Defford), and a minimum baseline of 11.2 km (between Pickmere and Mark II). The final, fully expanded array will have a bandwidth of 2 GHz, providing more than ten times the continuum sensitivity as the original MERLIN. NGC 3718 was observed at 5 GHz for 10 h by e-MERLIN on the 3 August, 2011, with four 128 MHz sub-bands of 512 spectral channels each, yielding a total bandwidth of 512 MHz. The observations did not include baselines to Cambridge. The final angular resolution we obtain is ~100 mas.
Data were reduced and analyzed using the National Radio Astronomy Observatory’s (NRAO) Astronomical Image Processing System (AIPS). Data were initially edited with SPFLG and IBLED, averaged to 64 channels per intermediate frequency (IF) channel and concatenated with DBCON before further editing was conducted. FRING was used to derive delay and rate corrections for the calibrator sources, while CALIB was used to derive time-dependent phase and then amplitude and phase solutions. Flux calibration was performed using short observations of 3C 286 at the beginning and end of each run, and the flux density scale was calculated with SETJY (Perley & Butler 2013). The flux density for each IF was then reduced by 4% in order to account for the resolution of the e-MERLIN shortest spacing (see the MERLIN User Guide). Bandpass and phase calibration was performed using the bright point sources. Absolute calibration is expected to be accurate to about ~10% for commissioning data.
The quoted positional errors, associated with phase transfer errors from phase reference to target source (for a typical 3° separation), are ~1 mas. This assumes six stations including Cambridge and online L-band link corrections. The phase reference source used in our e-Merlin observations is J1146+5356 and we have referenced our observations to the coordinates given in the VLBA calibrator list, namely α2000 = 11:46:44.204328 and δ2000 = + 53:56:43.08356. This places J1146+5356 about 2.28° away from NGC 3718. Taking into account the lower resolution of these data without Cambridge, and making some allowance for known small phase corrections for the L-band link transmission delays around our observational epoch, we conservatively estimate the phase transfer errors to be around ~4 mas. The phase reference source position from the VLBA Calibrator list quoted formal positional uncertainty errors of 0.35 mas and 1.17 mas in RA and Dec, respectively. The formal measurement error from the peak of the e-Merlin image will be 100/2Q mas with a restoring beam of 100 mas and a peak signal-to-noise ratio in the image of Q, which is better than 60 in our case. Hence the total estimate of the positional uncertainties results in a value of ~4.1 mas.
3. Data processing
3.1. Centering
The first step of our Subaru data analysis is to align the J,H, and KS images. In the absence of secondary sources in our FoV, we choose an alignment based on ellipses-on-isophote contours fitting. For this purpose we use IRAF’s3 task ellipse, which fits ellipses to iso-intensity contours of a galaxy’s light distribution. We plot the Xcenter and Ycenter coordinates indicated by each fitted ellipse versus its semi-major axis (SMA), as shown in Fig. 4.
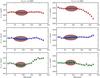 |
Fig. 4 X (left column) and Y (right column) central coordinates of each fitted ellipse versus its SMA for the KS (red/top), H (blue/middle), and J (green/bottom) bands. The shaded ellipses indicate the most prominent stable values used to derive the first order approximation photocenters. |
Apart from the Xcenter coordinate of the J band and the Ycenter coordinate of the KS band, the rest of the curves behave relatively normally4. The behavior of the J band can be attributed to the lower (with respect to the H and KS bands) total flux, FJ (FKS ~ 3FJ and FH ~ 2.5FJ, respectively). This is partly due to the lower integration time (tJ = 300 s, tH = 660 s and tKS = 720 s), but it mainly indicates that the stellar flux is of the order of what is expected from an evolved stellar population of K/M type stars5. The lower flux results in noisier isophote contours and, consequently, in higher uncertainties. The dust lane of NGC 3718 does not seem to affect the light distribution in the NIR to a large extent, mainly because it lies far enough away (see Sect. 4 and Appendix A). Moreover, the dominant component, both in terms of structural size and illumination, should be the stellar bulge of the galaxy. The absence of large-scale contour deformations and the general contour shape6 indicate a largely relaxed stellar component in all three NIR bands.
We therefore consider that the average of the most prominent stable values of the (Xcenter, Ycenter) coordinate pairs (points within the shaded ellipses of Fig. 4) should act as a very good first order approximation of the photocenter (i.e. center of the stellar bulge) for each band. The uncertainty of each ( ,
,  ) pair, is considered to be the quadratic addition of the standard deviation of the most prominent stable values used for each band with their average fitting uncertainties (
 ,
,  ) as computed by the ellipse task itself. The suggested photocenters and their corresponded uncertainties are displayed in Table 1.
First order approximation photocenters.
3.2. Pivot and subtract
Having arrived at a first order approximation of the center of the stellar bulge, the next question is: what could be the cause of the deviation in the central coordinates of the KS band? The light distribution of a clean bulge should have a nice symmetrical bell-shaped structure (i.e. a Sersic profile), as are all spherical/elliptical shapes that are projected on a 2D surface. This should lead to co-centered isophotes and, therefore, to co-centered fitted ellipses.
So we consider the following scheme: A theoretical perfectly symmetrical 3D structure should look the same either under any rotation around the perpendicular to the X–Y plane axis, if we have a spherical shape, or, at least, under n × π rotation (with n being an integer), if we have an elliptical shape. So if one was to subtract a 2D projection of this structure (a bell-shaped curve) from a rotated (around its center) copy of itself, one should receive 0 as a result. Following this scheme for a perfectly symmetrical, isolated, and undistorted bulge, if one rotates and subtracts its 2D projection from itself, one should not receive any obvious residual pattern apart from random noise. In the case of NGC 3718 we have an elliptically projected bulge, so this scheme is valid only under n × π rotation around the first order approximation photocenters, derived from the curves of Fig. 4, with n = 1,2,3,...n.
The pivot (π rotation) and subtract operation reveals strong residuals, especially in the KS and H bands (Fig. 5), whereas in the J band the residuals are considerably noisier.
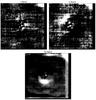 |
Fig. 5 J (top left), H (top right), and KS (bottom middle) residual images from the pivot and subtract operation, smoothed with a 10-pixel Gaussian kernel. The residual mean peak fluxes, expressed as percentages of NGC 3718’s mean peak fluxes, are ~4.5% (J), ~3.0% (H), and ~3.4% (KS), respectively. |
3.3. Evaluating the centering
Although the uncertainties implied are of the order of a few mas (see Table 1), we test the robustness of our initial center estimations by shifting the pivot point in all bands by (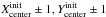 ) and (
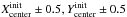 ) and repeating the pivot and subtract operation. In this way we test a series of sixteen alternative pivot points, arranged in a rectangular (2 pixels per side) pattern around the initial center estimations. If the mean central (300 × 300 pixel2) residual produced by a candidate (
 ) is smaller than the mean residual of the (
 ), then it is adopted as a better center estimation and the process is iterated until the minimum mean residual is reached.
Our initial center estimations proved to be quite accurate, at least within ± 0.5 pixels (± 5 mas) per coordinate, since these are the pivot points that produce the minimum mean residuals. This is slightly larger than the statistical uncertainties of Table 1, and we adopt them as a more conservative approach. An example of the above process for the H band is shown in Fig. 6. In general, the residuals produced by the alternative pivot points are a much less well defined, especially in the central region. The brighter central features that appear are indicative of the deliberately incorrect pivot points used. The extended light excess towards the NE from the center is largely unaffected, so the larger scale asymmetries can still be traced and removed.
 |
Fig. 6 Examples of the H band smoothed residual images after a rotation around incorrect pivot points by ( |


We remove the residuals of Fig. 5 from the images of Fig. 3 in order to clear the light distribution from all the asymmetries, as shown in Fig. 7. The symmetrical light images in all bands are clearly rounder and generally, better defined.
We note that the residual images show asymmetries between diametrically opposite parts of the light distribution. In the presence of inclination and/or tilt, the farther we move from the center, the line-of-sight light path (and therefore the brightness) difference between diametrically opposite parts of the galaxy becomes increasingly larger, so that any large-scale asymmetries cannot be simply treated as light over-densities with a physical meaning. As we approach the center however, these effects become increasingly smaller, so that in small scales the observed asymmetries should mainly represent true light (and therefore mass) over-densities7. This suggests that we can safely use the residual maps and the symmetrical light images to extract physically robust quantities, as long as we restrict ourselves to small scales8.
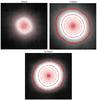 |
Fig. 7 J (top left), H (top right), and KS (bottom middle) symmetrical light images after the removal of the residuals. |
3.4. Angular resolution matching and flux calibration
After making an accurate center estimation, we align our images with respect to the J band. We match the angular resolution of our images by convolving the better seeings (H and KS) to the worst one (J) using the FWHMs as measured from our point-spread-function (PSF-)reference stars in each band. The Gaussian kernel used equals the quadratic difference of the smaller from the larger FWHM, as follows: ![Mathematical equation: \begin{eqnarray} &&\delta_{{\textit{FWHM}}}(H) = \sqrt[]{[{\textit{FWHM}({J})^2} - {\textit{FWHM}({H})^2}]} \approx 9.8 \\ &&\delta_{{\textit{FWHM}}}(K_{\rm S}) = \sqrt[]{[{\textit{FWHM}({J})^2} - {\textit{FWHM}({K}_{\rm S})^2}]} \approx 10.3. \end{eqnarray}](/articles/aa/full_html/2015/08/aa25077-14/aa25077-14-eq106.png) Flux calibration was performed, using our standard stars, to derive Zero Points for each band according to
Flux calibration was performed, using our standard stars, to derive Zero Points for each band according to ![Mathematical equation: \begin{equation} m_i = \mathrm{ZP_i} - 2.5 \log([\mathrm{counts_i}/\mathrm{Exp.Time_i}]). \end{equation}](/articles/aa/full_html/2015/08/aa25077-14/aa25077-14-eq107.png) (4)
(4)
3.5. Coordinate uncertainties
In order to translate the relative into an absolute coordinate system, the following method is used. We align our Subaru J band with a re-sampled and re-scaled9 version of the SDSS z band image in order to astrometrically calibrate it. We choose the SDSS z band because its central wavelength (0.9134 μm) is the nearest to our J band (1.220 μm), so the centroids of similar, old stellar populations are expected to coincide in the NIR (see Appendix B and footnote 5), and also because the SDSS is the most accurate (in astrometric terms) survey currently available (Pier et al. 2003). The total intrinsic SDSS astrometric uncertainties were calculated following the instructions described in the SDSS online documentation. The resulting values for our entire uncertainty budget are shown in Table 2.
Astrometric uncertainties and coordinates.
4. NIR color maps
Having aligned and calibrated our NIR images, we proceeded by producing the J−H and H−KS NIR color maps. NIR color maps are an important tool as they provide vital information about the color distribution of a galaxy, such as whether reddening affects the colors and whether light comes purely from an “ordinary” stellar component or if it contains a contribution from a nuclear component as well (Glass & Moorwood 1985). The colors of ordinary galaxies are J−H = 0.78 and H−K = 0.22 (Glass 1984). Light captured by the J band is produced mainly from stars, whereas in KS light can come from both stars and hot dust. A blackbody with a temperature below the sublimation temperature of dust (~1500 K) will radiate at λ ≳ 1.9μm, mainly affecting the KS band, but also potentially affecting the H band (λcentral = 1.63μm) to some extent. In this context, J−H is mostly indicative of extinction, as dust is already evaporated, and is acting as a scattering source, while H−KS, is indicative of hot dust emission. The NIR color maps are shown in Fig. 8.
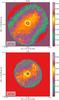 |
Fig. 8 H−KS (top) and J−H (bottom) NIR color maps. |
Our J−H map is fairly symmetric. An approximately elliptical red excess can be seen surrounding the nuclear region extending from SE to NW. This could be interpreted as local extinction since there is no apparent large-scale constant color gradient, which would indicate that the dust lane (lying to the SW and outside the borders of the light distribution, see Appendix A) extends all the way to the projection of the center of the bulge. The H−KS map also shows a similar, but better defined, elliptical red excess around the center (sharing the same orientation with the excess in the J−H map), indicative of the presence of hot dust emission.
The overall symmetry of the NIR color maps can be more clearly seen on the radial profile plots of Fig. 9. In the four different directions of measurement (see caption of Fig. 9), the plots do not show any sign of a large-scale constant color gradient, which would appear as an asymmetry with respect to the center and would indicate the presence of foreground dust10. The only asymmetry that can be seen is between the blue and red profiles outside of ~0.5 arcsec because the directions of measurement are perpendicular to each other and cross the center along the major and the minor axis of the red elliptical excess, respectively. Both components, however, are highly symmetrical with respect to the center.
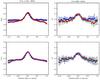 |
Fig. 9 Radial profiles of the H−KS (left column) and J−H (right column) NIR color maps derived from two sets of perpendicular directions measured counterclockwise from the north. These are 120°/ 210° (blue/red points, respectively) in the upper row and 170°/ 260° (green/magenta points, respectively) in the lower row. Negative→positive relative offset reflects a S(E,W)→N(W,E) direction. |
The most interesting feature of the H−KS map, however, is that the center of the red blob (i.e. the peak of the H−KS map) is slightly offset from the center of the stellar bulge by ~50 mas. For this to be more clearly seen, we produce the symmetrical H−KS map (using the H and KS images of Fig. 7) and we over-plot its peak contours (i.e. the center of the stellar bulge) alongside the peak contours of our normal H−KS map in Fig. 10. We also manage to extract the same offset length, along the same orientation, by applying a high pass filter directly on the reduced KS image, a result free from any geometric transformation uncertainties. The corresponding central astronomical positions for the stellar bulge and the offset red blob are shown in Table 2.
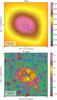 |
Fig. 10 Top: H−KS closeup. The red blob contours (red) are offset from the symmetrical light image’s peak contours (i.e. the center of the stellar bulge, in blue). Bottom: KS band high pass filtered image closeup. The peak flux is offset from the photocenter of the KS band. In both images, the red circle indicates the position of the peak value of the offset red blob, while the blue circle indicates the position of the center of the stellar bulge, as derived from our contour analysis. Their radii indicate the positional uncertainty of each position, which is ~7 mas. The yellow (top)/cyan(bottom) line is the length of the offset, namely ~50 mas. |
4.1. Light decomposition
Following Glass & Moorwood (1985), we use their Fig. 7 (see caption of Fig. 11 for an explanation), of theoretical loci for mixtures of ordinary galaxy colors and blackbodies of various temperatures constrained on the color-color diagram of their sample, in order to decompose the light of NGC 3718. An azimuthal average, binned in 5 equally spaced (~50 mas step) radius bins, of the innermost 0.5 arcsec of the nucleus of NGC 3718, can be seen in (the zoomed-in section of) Fig. 11. A decline, from a 50% stellar −50% dust (at T100 ~ 1000 K) light mixture in the innermost ~ 100 mas, to a 60% stellar −40% dust (at T200 ~ 800 K) in the innermost ~200 mas, which drops even further to a 65% stellar −35% dust (at T300−500 ~ 700−500 K) in the innermost ~ 300−500 mas, can be clearly seen in this plot. This indicates the presence of significant contribution from hot dust in the central region of NGC 3718, suggesting an environment ideal for SMBH accretion.
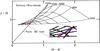 |
Fig. 11 Glass & Moorwood (1985) two color diagram. Moving away from the ordinary galaxy colors (black circle at J−H = 0.78 and H−K = 0.22) and along the horizontal lines in the loci of mixtures, there is an increasing percentage (10% per vertical line) of contribution from hot dust emission, while moving along the vertical lines, the temperature of this dust component increases (T ~ 500−1500 K). |
4.2. Over-plotting the e-Merlin radio map
The high angular resolution (~100 mas) 6 cm radio e-Merlin map, with a pointing accuracy of ~4 mas (see Sect. 2.2), is shown in Fig. 12. The outer contours are set to ~ 4σ sigma above the background, so we consider the flux density enclosed within these contours to be a true detection of extended radio emission, at least in the position angle shown by the red dashed line in Fig. 12.
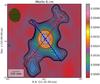 |
Fig. 12 e-Merlin 6 cm radio map. The outer contours are set to ~4σ above the background where the flux is ~2 orders of magnitude less than the peak flux. The third inner contour is ~40−50% of the peak flux. The red and blue dashed lines represent the position angle of the SE–NW and the NE–SW candidate small-scale bipolar extended structures, respectively. The beam is shown in the upper left corner. |
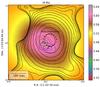 |
Fig. 13 Same as the upper image of Fig. 10, but with the radio contours over-plotted (in the position quoted in Table 2. The same image with the equivalent to the Krips et al. 2007 position is shown in Fig. C.1). The blue and red circle radii indicate the positional uncertainty of each position, namely ~7 mas. The black dashed ellipse indicates the total coordinates uncertainty of Table 2. |
Over-plotting the radio map on our H−KS NIR map reveals that the radio emission appears to originate from a position closer to the offset red blob than to the center of the stellar bulge (Fig. 13). This is yet another very interesting result because it could indicate that the SMBH does not lie exactly at the center of the bulge, but is offset by ~50 mas. This, at a distance of ~17.4 Mpc, yields a projected offset of ~4.25 pc. The presence of radio emission is expected, since NGC 3718 is a LLAGN, so the closer proximity of the radio emission to the offset red blob implies that the SMBH accretes matter normally, but it does so slightly away from the center of the stellar bulge. The coordinate uncertainties, however (see Table 2), are of the order of the offset, though a little smaller. This suggests that a potential coincidence of the radio emission with the offset red blob is reasonably likely to be true. The astronomical position of the peak radio flux is shown in Table 2.
Spatial offsets, potentially coincident with AGN offsets, are predicted by current theory. A possible interpretation could be that this is the case of a SMBH recoil (e.g. Komossa 2012; Sijacki et al. 2011). In short, in the case of a merger the SMBHs present in the centers of the merging galaxies will form a binary (Begelman et al. 1980) that will eventually coalesce as a result of anisotropic emission of gravitational waves (e.g. Bekenstein 1973). We need more evidence, however, to favor such a view of NGC 3718, and we resume the discussion of this subject later on.
We also confirm the presence of the ~0.5 arcsec NW candidate jet component, that Krips et al. (2007) see in their Merlin 18 cm map. Moreover, we detect a second ~0.5 arcsec extension that is located diametrically opposite towards the SE. This could be considered as a possible counterpart to that jet since both lie along the same orientation and are of the same length. Finally, a less extended but brighter structure towards the SW11 and a fainter tail-like one towards the NE, both of ~0.3 arcsec in length and sharing the same orientation, could be potentially indicative of a small-scale X-shaped radio structure often associated with “spin-flip” processes in SMBH recoils (e.g. Merritt & Ekers 2002; Liu et al. 2012) or with the two jet emitting members of a close SMBH binary (Lal & Rao 2007).
For the 6 cm e-Merlin radio flux of NGC 3718, we measure a peak flux of 8.85 ± 0.07 mJy and an integrated flux of 9.97 ± 0.08 mJy, both of which are larger than the values published by Krips et al. (2007), namely 5.3 ± 0.1 mJy and 6.1 ± 0.3 mJy, respectively. This reflects an increase in peak flux of ~67% and in integrated flux of ~63%, indicating that NGC 3718 is a variable radio source, a picture consistent with an accreting SMBH.
5. Scaling relations and classification
5.1. To bulge or not to bulge?
The most famous scaling relations between a host galaxy and its SMBH are the MBH−L and MBH−σ, relating the luminosity and the stellar velocity dispersion of the bulge, respectively, with the mass of the SMBH.
We can estimate the absolute magnitude MKS,bulge of NGC 3718 from our data. Given that we do not perform any decomposition into different components (disk, bulge, etc.), the contaminated bulge magnitude we derive should provide an upper limit for the estimation of the MBH. We perform aperture photometry on our KS band images (Figs. 3 and 7) of NGC 3718, using three different aperture sizes, from 3−5σ above the background, with an average aperture of raper. ~ 3 arcsec12. We average the flux of those measurements and we use a (rather large) 0.2 mag assumed13 error. The KS band absolute magnitude of NGC 3718 is  For the velocity dispersion, however, we will need spectroscopic information. Luckily, NGC 3718 is a very well studied object. Ho et al. (1997a), in their Palomar AGN spectroscopic survey, were able to extract several useful parameters, including the FWHM [NII] = 371 km s-1 line. Assuming a Gaussian distribution and using
 ![Mathematical equation: \hbox{$\textit{FWHM} = 2\sqrt[]{(2{\rm ln}(2))} \sigma \approx 2.355 \sigma$}](/articles/aa/full_html/2015/08/aa25077-14/aa25077-14-eq151.png) , we can get an estimation for the velocity dispersion of σ ≈ 157 km s-1. However, [NII] λλ6583 Å is considered to be a better tracer for the ionized gas motion. A number of authors have suggested that the gas may rotate at a different speed than the stars (e.g. Pignatelli et al. 2001; Caldwell et al. 1986). Ho (2009) combined gas and stellar velocity dispersion measurements and they conclude that σ⋆ and σgas correlate well. Ho et al. (2009) calculate a velocity dispersion for NGC 3718 of σ = 158.1 ± 9.6 km s-1, using the Ca + Fe absorption feature at 6495 Å, a value that we adopt. This suggests a
, we can get an estimation for the velocity dispersion of σ ≈ 157 km s-1. However, [NII] λλ6583 Å is considered to be a better tracer for the ionized gas motion. A number of authors have suggested that the gas may rotate at a different speed than the stars (e.g. Pignatelli et al. 2001; Caldwell et al. 1986). Ho (2009) combined gas and stellar velocity dispersion measurements and they conclude that σ⋆ and σgas correlate well. Ho et al. (2009) calculate a velocity dispersion for NGC 3718 of σ = 158.1 ± 9.6 km s-1, using the Ca + Fe absorption feature at 6495 Å, a value that we adopt. This suggests a  for NGC 3718. The author argues that “as the gas derives principally from mass loss from bulge stars, its kinematics should generally track the kinematics of the stars. But because the gas is collisional and experiences hydrodynamical drag against the surrounding hot medium, we expect it to be kinematically slightly colder than the stars. In the absence of additional energy input from other sources, we anticipate
  , as observed. As additional energy is injected into the system, for example from activation of the central black hole, the gas gains energy, to the point that σgas approaches or even overtakes σ⋆”. This picture is consistent with the fact that NGC 3718 is indeed an LLAGN. This could be considered as an indirect indication that NGC 3718’s central engine provides enough AGN feedback to heat up the gas and cause this strong agreement between σgas and σ⋆, information that will be used later on.
Having made an estimation of both of these quantities, we use the MBH−MKS,bulge and MBH−σ relations from Kormendy & Ho (2013), namely: 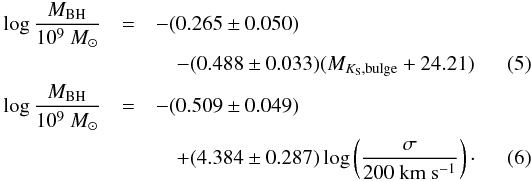 Equation (5)suggests an SMBH mass of
 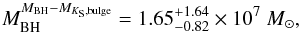 whereas Eq. (6)suggests a mass of
 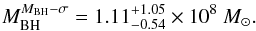 Equations (5)and (6), although they are derived from the same sample by Kormendy & Ho (2013), differ by almost an order of magnitude in terms of MBH. Adopting
  , as a more robust result and calculating the magnitude that the bulge should have to justify this mass, we find a minimum difference of
  or, in other words, NGC 3718 should be at least ~4.8 times brighter.
But what can cause such a disagreement between the two scaling relations in the case of NGC 3718? A first approach could be that this is not a bulge but a pseudo-bulge14, so these equations do not apply (Kormendy et al. 2011). NGC 3718 is currently classified as an SB(s)a pec, meaning that it has a bar and, according to Kormendy & Kennicutt (2004), barred galaxies preferably have pseudo-bulges.
On the contrary, several authors (e.g. Pott et al. 2004; Krips et al. 2005; Sparke et al. 2009) have studied the gas dynamics and have successfully fitted tilted rings on NGC 3718. They all agree that the gas orbits are nearly edge-on near the center. Sparke et al. (2009) suggest that the classification as a barred galaxy is misleading. They see the apparent nuclear bar, as a projection effect of the prominent dust lane of NGC 3718, which is the result of looking through a disk/ring of dusty gas on polar orbit around the nearly face-on stellar disk. They also report that the stellar disk must be substantially free of cool gas since they do not detect any HI emission on its plane of rotation, a characteristic of lenticular galaxies. Additionally, the L1.9 spectral classification (Ho et al. 1997b) means that broad line Hα emission is detected, suggesting that our line of sight provides a direct view towards the nucleus of the host galaxy which, consequently, has to be closer to face-on. Sparke et al. (2009) conclude that NGC 3718 is a polar ring galaxy, a rare class of objects often hosting a lenticular galaxy, which is an early-type object and shares many kinematic and other properties with elliptical galaxies. Our data also favor this picture, since we do not see any traces of a nuclear bar. The elliptical region around the nucleus (H−KS map of Fig. 8) looks more like an almost face-on disk rather than a bar.
Moreover, NGC 3718 does not fulfill at least three of the criteria of Kormendy & Kennicutt (2004) for classifying a bulge as a pseudo-bulge:
-
1.
Following Kormendy & Bender (2013),we calculate the Faber-Jackson correlation forcoreless and core ellipticals respectively, usingLV = 1.20 × 10¹⁰L⊙, namely
 NGC 3718’s kinematic properties (Jog & Chitre 2002) imply the presence of a random motion supported bulge and its velocity dispersion (Ho et al. 2009) seems to be in good agreement with both versions of the Faber-Jackson correlation (given their large scatter), although it is a closer match to that of a coreless elliptical (Eq. (7)). In any case, the observed σ is not much smaller than the σ predicted by these relations, which would be indicative of a rotationally supported pseudo-bulge. As pointed out by Kormendy & Ho (2013), “classical bulges are essentially equivalent to coreless ellipticals”, a picture consistent with the classification of NGC 3718 as a lenticular galaxy.
 -
2.
We do not detect any signs of a nuclear bar.
-
3.
There is no sign of significant star formation15 (Sparke et al. 2009),
which allows us to assume that NGC 3718 behaves as an elliptical galaxy and, therefore, it should follow the host galaxy − SMBH mass scaling relations. But why do the MBH−MKS,bulge and MBH−σ relations point towards different MBH?
5.2. Light “deficit” or σ “surplus”?
Given that Eqs. (5)and (6)are calibrated against the same galaxy sample by Kormendy & Ho (2013), we can safely assume that they should more or less agree. As previously noted (Sect. 5.1), we consider σ to be more accurately determined than MKS,bulge since, as it is measured from two different linewidths and the Faber-Jackson relation, it shows surprisingly good consistency.
Our first choice therefore, is to examine the robustness of MKS,bulge. In order to better understand our light distribution, we produce the surface brightness profile of NGC 3718 from a joined data set consisting of our Subaru16 and 2MASS17KS data against the radius. For this we use IRAF’s task ellipse once again, which returns an azimuthally averaged surface brightness profile, as shown in Fig. 14. Many authors (e.g. Graham et al. 2003; Kormendy et al. 2009) argue that fitting a Sersic profile to larger radii of an elliptical galaxy and then extrapolating it inwardly is an accurate way to describe the surface brightness profile.
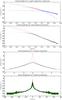 |
Fig. 14 First figure: surface brightness in the KS band versus log (R) in pc. The blue dashed line represents the inwardly extrapolated Sersic profile of the bulge, while the black dashed line represents the dual exponential disk profile. The blue points represent the 2MASS KS data, while red points represent our Subaru KS data. Second figure: Same as the first figure, but with the different components added. Here the red dashed line represents the fitted model, whereas the black points represent the complete joined data set. Third figure: surface brightness in the KS band versus R (in arcsec) of the innermost ~3 arcsec. The red dashed line represents the fitted model, while black points represent (up to ~2.5 arcsec) our Subaru KS data. Fourth figure: same as the third figure, but plotted for the complete data range (~70 arcsec). The green lines represent the uncertainties of the data points. |
Following this scheme, we fit our combined Subaru and 2MASS KS data set of NGC 3718. Our best fit consists of a Sersic profile for the bulge with an index n = 4.85 combined with a dual exponential disk component with scale lengths  arcsec and
  arcsec, respectively, as presented in Fig. 14. We choose the lower limit of our fitting range (~50 arcsec) based on the uncertainties of the 2MASS data points (at ~50 arcsec the flux is ~ 2σ above the background). The upper limit is then determined through χ2 minimization for that given lower limit, in the range between the (candidate) upper limit and ~20 arcsec in order to minimize the fit with respect to the higher signal-to-noise data points (at ~20 arcsec the flux is ~6σ above the background). Our best fit has a χ2 ~ 2, for a data range between ~ 1.5−50 arcsec (~500 data points). Our modeled bulge magnitude estimation is MKS,bulge ~ −22.85 magn (mKS,bulge ~ 8.35). When put into Eq. (5), this “recovered” magnitude, suggests an MBH of the order of
 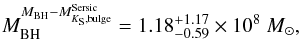 which, surprisingly enough, covers the gap between the MBH−L and MBH−σ relations (Sect. 5.1) almost perfectly.
A similar result was previously noted by Dong & De Robertis (2006), who used 2MASS data of NGC 3718 along with the bulge/disk decomposition algorithm GALFIT in order to separate the bulge from the disk and obtain magnitudes for both. Their best fit consists of a Sersic bulge profile of index n = 5.5 with  magn (
 ) and a disk with scale length
  arcsec. This magnitude estimation is almost identical to ours. In this case, Eq. (5)then gives
 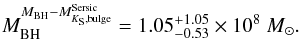 What both of these fits reveal is very interesting since, instead of a Sersic profile near the center, we get a plateau. The fit describes the surface brightness profile very well at radii ≥1−1.5 arcsec, but it fails near the center, where the model suggests that an amount of “missing light” is present, seen as the difference between the fitted and the observed curves. Kormendy et al. (2009) suggest that a surface brightness profile of this kind is a characteristic seen in core galaxies.
In short, a “core” is an elliptical galaxy whose measured surface brightness profile shows a break towards a shallower light profile when compared to an inward extrapolation of its outer Sersic fit, revealing an amount of light deficit. The opposite stands for coreless galaxies. These are objects whose measured surface brightness profiles show a break towards a steeper light profile with respect to their, inwardly extrapolated, outer Sersic fit, revealing an amount of light surplus.
So, as our analysis suggests, the light deficit is, most likely, the source of the disagreement between the MBH−L and MBH−σ relations18,19. As discussed by several authors (e.g. Kormendy et al. 2009; Kormendy & Ho 2013; Gualandris & Merritt 2008), such a light deficit20 could be indicative of co-evolution driven by a combination of SMBH binaries followed by SMBH recoils. The light deficit, can be retrieved by the difference between the observed and the expected brightness (Fig. 14, Graham 2004). In our case, it translates to an  and a
and a  . When put onto the Mdef versus MBH plot of (Kormendy & Ho 2013, their Fig. 30), it falls to the left of and away from the main distribution (Mdef ~ 5MBH), but well within the observed upper limit of Mdef ~ 50MBH. Moreover, if NGC 3718 is viewed as an advanced merger (Chitre & Jog 2002), then it falls much closer to the main distribution when compared to NGC 4486B, the only other ongoing merger on this plot, with a
  . Additionally, for a real(istic) core, a mass deficit of ≤1% of the total galaxy mass is expected (e.g. Hopkins et al. 2008). Using
  from Schwarz (1985) and calculating the percentage, we get an
  , which is well within the realistic limits. These considerations make NGC 3718’s relatively large Mdef appear physically plausible, at the very least.
Finally, our fit is consistent with previous studies. Chitre & Jog (2002) and Jog & Chitre (2002) studied 2MASS and kinematic data of NGC 3718, for which they find elliptical-like kinematics mixed with spiral-like photometry. Bournaud et al. (2005) attributes the “transitional” nature of these objects as the result of mergers with mass ratios ≥(3−4.5):1, remnants which closely resemble the properties of lenticular galaxies. The fact that we see, as Dong & De Robertis (2006) do, both the exponential disk and the random motion supported bulge in the surface brightness profile means that NGC 3718 should be classified as a lenticular galaxy, which, consequently, strongly implies that NGC 3718 is a merger remnant.
The mass deficit and the indications of a merger are compatible with the evidence we have so far, that NGC 3718 might host an actual SMBH recoil. We discuss this subject further in Sect. 7. For now, we adopt the average value of Eqs. (5)(ours and Dong & De Robertis 2006) and 6 for the rest of our calculations as a good estimation for the MBH, namely 
5.3. Core or coreless?
As we have seen so far, NGC 3718 appears to show properties that belong to both core and coreless ellipticals. For example, its velocity dispersion fits more to that of a coreless galaxy, whereas the presence of missing light is a characteristic usually seen in core galaxies. It is reasonable, therefore, to investigate further similarities and differences with either of these categories. The classification criteria of the E–E dichotomy21 have been discussed by many authors (e.g. Emsellem et al. 2007; Thomas et al. 2005; Cappellari et al. 2007) and the most updated classification criteria for core and coreless elliptical galaxies are presented by Kormendy (2009).
Supporting a classification as a coreless object is the visual magnitude mag, which is fainter by almost an order of magnitude than the MV ~ −21.5 mag, the border22 of the E–E dichotomy, lying on the bright end of the coreless side (see Fig. 2 of Kormendy 2009). Additionally, the presence of weak/non-dominant radio emission, as we show in the e-Merlin 6 cm map (Fig. 12) and as measured by Krips et al. (2007) and by us (see Sect. 4.2), along with NGC 3718’s kinematic properties (Jog & Chitre 2002), are characteristics usually seen in coreless objects.
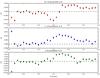 |
Fig. 15 A4 parameter versus radius for NGC 3718. From top to bottom, A4 parameter for the KS (red/top), H (blue/middle), and J (green/bottom) bands, respectively, versus R in arcsec. In all plots the dashed black line represents the border between a disky and a boxy object. |
On the other hand, the most obvious observational evidence to support a classification as a core object, is the missing light that we observe in the surface brightness profile. The fact that the Sersic profile has an index of n> 4 and the presence of moderate to low hard X-ray emission (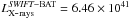 erg s-1 from Tueller et al. 2010) may further strengthen a classification as a core object.
Regarding the isophote contours shape of the images of Fig. 3, we see the same general trend in all bands as we present in Fig. 15. The A4 parameter23 is mostly negative up to a radius of ~1−1.5 arcsec (essentially, the radius of the core we observe), consistent with a “boxy” (core) object, while farther out it steadily rises above zero and drops again, but remains on the positive side, up to a radius of ~3 arcsec, consistent with a “disky” (coreless) object. This could be indicative of an inside-out transformation of NGC 3718 from a coreless to a core galaxy. The available classification criteria are summarized in Table 3.
E–E dichotomy parameters.
The picture we get from the above discussion is that NGC 3718 is most likely an intermediate (between core and coreless) galaxy, a fact that makes the attempt of a possible interpretation of the results more complex. It provides, however, an additional piece of evidence in favor of a view of NGC 3718, as the “smoking gun” of a past/ongoing merger, in the sense that the E–E dichotomy refers to early-type objects, believed to have formed in mergers.
6. Electromagnetic signatures of an SMBH recoil
So far, the observations imply that NGC 3718 is a merger remnant, with a core in its surface brightness profile combined with a spatial and a potentially coincident AGN offset, all of which are compatible with SMBH recoils.
If this is indeed the case, according to Komossa (2012), we should expect to see some characteristic electromagnetic signatures. The most prominent of these would be a velocity shift between the broad and the narrow component of a given line. Briefly, the idea is that a region of the order of the size of the broad line region (BLR) should be gravitationally bound to the recoiled SMBH, resulting in a relative motion of the BLR with respect to the much larger narrow line region (NLR). Ho et al. (1997b) fit a narrow and a broad component to the Hα line and they find that the centroid of the broad Hα is redshifted with respect to its narrow counterpart by 430 km s-1 (their Fig. 10e). If we also account for systematic offsets of the order of 50−100 km s-1, between broad and narrow line components (Peterson 1997), we adopt a kick velocity of the order of 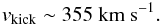 Based on the vkick and
  estimations, we can calculate the gravitationally bound radius, according to the relation (Merritt et al. 2006; Komossa 2012)
 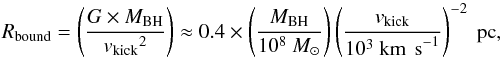 (9)which results in an Rbound ~ 3.53 pc. Because the gravitationally bound radius is inversely proportional to the vkick24 and because of the large uncertainties of the , this should be viewed as an indicative, yet relatively uncertain, estimation. With this in mind, we can estimate the size of the BLR, using the relation from Zhang et al. (2007),
 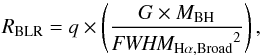 (10)which, depending on the adopted value of q, gives an RBLR ~ 0.06−0.12 pc (q = 0.75−1.33), using FWHMHα,Broad ≈ 2350 km s-1 for NGC 3718 from Ho et al. (1997a). One last quantity to estimate is the sphere of influence of the SMBH, given by the relation
 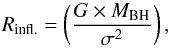 (11)which equals Rinfl. ~ 19.1 pc for the values we have adopted so far in this paper. The latter is ~5 times smaller than the core radius, i.e. ~100 pc.
These values are useful in order to better understand the nuclear dynamics of the system. Specifically, the RBLR and the Rbound strongly suggest that a BLR of the predicted size would likely be entirely gravitationally bound to a recoiled SMBH.
For our final calculation, we use the images of Fig. 7 and we measure values below the resolution limit. The fact that these images have not been extensively tested for their scientific accuracy makes them useful only for rough (order of magnitude) estimations (see Sect. 3.3).
With this in mind, the presence of a hyper compact stellar system (HCSS) is expected around an SMBH recoil. According to Komossa (2012), an HCSS should be found within an Rbound and its total luminosity should be of the order of the luminosity of a globular cluster. We attempt to measure this by measuring the KS band fluxes of Figs. 7 and 3 at the position of the offset red blob within an Rbound and taking the difference. These two images differ only by the presence of the offset red blob in that region. The rest of the emission through this column should be a good approximation of the foreground and background emitting sources, with respect to the center. This luminosity difference is  whereas this converted to mass (see Sect. 1), yields
  which is within the predicted luminosity and mass range for a globular cluster.
These findings further strengthen the possibility that an SMBH recoil is indeed present in NGC 3718, since the observations appear to be compatible with key aspects of the current theoretical view around SMBH recoils (e.g. Komossa 2012; Sijacki et al. 2011).
7. Discussion
Summarizing the results, the observations suggest that NGC 3718 appears to have a spatial offset that potentially coincides with a radio emission offset, a relative redshift between its broad and narrow Hα lines, and the presence of a core in its surface brightness profile, all compatible with the presence of an SMBH recoil. Moreover, the strong indications that NGC 3718 is a merger remnant, including spiral-like photometry mixed with elliptical-like kinematics and properties that belong to both core and coreless ellipticals, fulfil the prerequisite for an SMBH recoil, in the sense that merging is the current theoretical mechanism for the formation of an SMBH binary that can lead to an SMBH recoil. Some of these indications, however, could also be viewed to contradict each other. Thus, a very important question is the following: is there a theoretical framework that could incorporate all the potentially contradictory characteristics into one physically consistent scheme?
7.1. Formation of cores and galaxy evolution
Attempting to give a decent answer to this question requires us to briefly review what we know so far about the two relevant subclasses of the elliptical galaxies family. In recent years, it has become widely accepted that, within the ΛCDM cosmology, structures grow hierarchically in the Cosmos (e.g. White & Rees 1978). Within this picture, classical bulges and elliptical galaxies are formed in major mergers, resulting in the common properties observed in these objects. Moreover, elliptical galaxies define a trend of increasing dissipation with decreasing mass (Kormendy 2009). This means that later-type, fainter ellipticals, being “first stage” merger products of gas-rich spiral galaxies, have more gas to dissipate through “wet” merging (Hopkins et al. 2009a), whereas earlier type giant ellipticals, being the products of the subsequent merging of gas-poor fainter ellipticals, were formed in “dry” mergers (Hopkins et al. 2009b).
An immediate effect of wet mergers is that older stars (formed in the progenitors before merging) relax violently at larger radii (giving rise to a Sersic law profile), while new stars are formed mainly in a central intense starburst as a result of dissipation. As the cold gas experiences tidal torques due to the violence of a major merger, it is channeled towards the central region, triggering SMBH growth, SMBH feedback, and an intense nuclear starburst (Hopkins et al. 2008). The nuclear starburst forms the extra light component in these objects, which is observationally recognizable as a break towards a steeper inner surface brightness profile when compared to an inward extrapolation of the outer profile’s Sersic fit (e.g. Hopkins et al. 2009a,b; Kormendy & Ho 2013). During this process the SMBH accretes until the energy feedback from the AGN is large enough (~0.5−1% of the energy output of an AGN is coupled to the infalling gas) to blow away the residual gas, stopping the BH growth and quenching the star formation in the central region (e.g. Ostriker & Ciotti 2005). SMBH recoils are still expected to occur, since merging is a prerequisite of the process of elliptical galaxies formation. The presence of gas, however, helps the SMBH recoil to return to the center more quickly (e.g. Blecha et al. 2011; Sijacki et al. 2011), stopping any core scouring and replacing the missing light with newly formed stars in the central starburst (Kormendy & Ho 2013), which in turn, consumes the larger fraction of the available gas (Hopkins et al. 2008). During this process, the AGN operates in quasar mode.
However, dry mergers, as a product of merging of fainter gas-poor extra light ellipticals, lack the intense central starburst. The old violently relaxed stellar populations of the progenitors will again violently relax at larger radii in the newly formed system, whereas the extra light components will end up near the center and be preserved in the form of a more compact stellar distribution in the central region (Hopkins et al. 2009b). Although tidal forces will channel the little remaining gas towards the center, the newly formed giant elliptical is massive enough to hold onto enough amounts of X-ray emitting gas, which ensures that any cold gas reaching the nuclear region will be heated up, preventing any star formation (Nipoti & Binney 2007). The AGN in this case operates in the so-called maintenance mode, which further helps the gas to remain hot, making the nuclear star formation even more difficult and, eventually, keeping the merger dry (Kormendy & Ho 2013). Because of the absence of gas, SMBH recoils, are able to “stay on duty” for a longer time, acting mainly on a spatial range of the order of the preserved extra light fossil in the newly formed remnant, scouring the core and creating what appears as missing light or, in other words, a break towards a shallower inner surface brightness profile when compared to an inward extrapolation of the outer profile’s Sersic fit.
7.2. Formation of polar ring galaxies
As we extensively discuss in Sect. 5.1, the observations support NGC 3718’s classification as a polar ring galaxy suggested by Sparke et al. (2009). But how are polar ring galaxies formed?
There are two candidate formation mechanisms. The first is the merging scenario, proposed by Bekki (1997, 1998), suggesting formation through a head-on collision between two orthogonally placed spiral galaxies, the intruder and the victim (left panel of their Fig. 1). After the merging the intruder becomes the host galaxy (often an S0), whereas the victim becomes the polar ring. The second is the accretion scenario. Supported by a number of authors (e.g. Reshetnikov & Sotnikova 1997), it explains polar ring galaxy formation through gas accretion from a donor galaxy, as a result of tidal gravitational interactions due to a close encounter. Subsequent merging of the two galaxies is not necessary for the formation of a ring, but it is not physically prohibited.
Bournaud & Combes (2003) simulated both of these ideas, using the same numerical model. They found that both mechanisms successfully reproduce many of the observed properties of polar ring galaxies such as a) early-type host galaxies; b) stable nearly polar ring structures (some of their runs are evolved for 8−10 Gyr with a typical formation time for a polar ring galaxy of ~3 Gyr); and c) warps/spiral-arm like structures when these objects are viewed from specific lines of sight (edge-on/face-on for the ring/host galaxy, respectively). All of these properties have been observed to be present in NGC 3718 by a number of independent studies (e.g. Pott et al. 2004; Krips et al. 2005; Sparke et al. 2009).
A few properties, however, differentiate the two proposed scenarios. Firstly, in the merging scenario the host galaxy has to be substantially free of gas (which is the case of NGC 3718 according to Sparke et al. 2009), whereas in the case of the accretion scenario the host galaxy can also be a gas-rich object. Secondly, the merging scenario is expected to form a faint, spherical, diffuse stellar halo, consisting of the stars of the victim galaxy and surrounding both the host galaxy and the polar ring. Such a faint diffuse stellar component can be seen in Fig. 1 of NGC 3718, nearly engulfing the edge-on ring and the host galaxy. However, in the accretion scenario, instead of such a component, a donor galaxy has to be identified in relatively close proximity, which in this case could be the close neighboring galaxy NGC 3729 or a similar galaxy that has already been cannibalized by NGC 3718. Lastly, the merging scenario appears to be more consistent in (inefficiently) transferring gas towards the central region (~10−25% in most of their runs) than the accretion scenario. Bournaud & Combes (2003) quote that the gas infall is not as large and as general in the accretion scenario as it is in the merging scenario. They conclude that the accretion scenario is the most likely formation mechanism for the majority of the cases without, however, ruling out the merging mechanism based on some physical explanation, but rather through statistical argumentation, leaving space for it to actually occur in nature.
To the extent that a subsequent merging, after a possible accretion of gas into polar orbit, is not a common process, our analysis tends to favor the merging scenario for the formation of NGC 3718. The reason for this is mainly the observational evidence we present throughout this work for the presence of an SMBH recoil, which requires a merger to occur. Moreover, the low star formation activity (also seen by Sparke et al. 2009) and the detection of rapidly rotating molecular gas within the central ~700 pc seen by (Krips et al. 2005, through their position-velocity diagrams) also favor the merging scenario since the gas inflow predicted by this appears to be consistent with these observations. Finally, if the dust component traces the kinematics of the gas (a reasonable assumption since gas and dust are mixed in the apparent polar ring), then the contribution from hot dust to the KS band emission that we detect (see Sect. 4.1) serves as an additional indirect tracer for the aforementioned gas inflow.
The accretion scenario can also, in principal, explain these phenomena. Provided that a subsequent merging is a common outcome of this scenario, then this could be viewed as a merging event of different orbital configurations. So, when we refer to a “merging event”, we do mean either of the aforementioned polar ring galaxy formation scenarios, as long as the merging of SMBHs is guaranteed, in order to explain the indicated SMBH recoil and the observed core.
7.3. Putting the pieces together
The inefficient transport of gas towards the nucleus, however, might be the key to providing a robust physical explanation for the core that we see in the surface brightness profile of Fig. 14. A working scheme could be the following:
If NGC 3718 is viewed as a gas-rich25 merger remnant, one would expect to see signs of the intense nuclear starburst in the form of an extra light component, as described by e.g. Kormendy & Ho (2013), Hopkins et al. (2008, 2009a), instead of the observed core. The suggested absence of sufficient amounts of nuclear gas, however, lead naturally to the limited star formation observed. This, combined with the fact that in the absence of sufficient amounts of gas the time scale for which an SMBH recoil “stays on duty” is prolonged (Sijacki et al. 2011), provides a physically consistent framework for the formation of the observed core. Put more simply, the gas exists in the galaxy, but it is “locked up” in (the stable) polar orbit (Bournaud & Combes 2003; Bekki 1997, 1998), which reduces the available gas that can flow towards the center, triggering the necessary star formation that could “fill the gap” created by SMBH scouring.
Additionally, the behavior of the A4 parameter (Fig. 15), indicative of an inside-out transformation from a disky to a boxy object, fits naturally in this framework. Boxyness is present in objects that lack the intense central starburst, either because of limited amounts of nuclear cold gas and/or star formation quenching due to AGN feedback (Kormendy & Ho 2013). Such an environment seems ideal for an SMBH recoil to excavate a core. This process appears to be connected with the isophote contours shape behavior in the case of NGC 3718, since the transition from boxy to disky occurs roughly in the spatial scales of the observed core.
In this framework, the presence of energetic X-ray emission (14−195 Kev) reported by Tueller et al. (2010) also fills a gap. Provided that it is associated with AGN feedback, it makes the star formation quenching mechanism applicable in this case. The very good agreement between the velocity dispersion measured by the gas emission and the stellar absorption features (Ho et al. 2009;  is ~1 see Sect. 5.1), could be considered as the observational consequence of this process.
Any apparent contradictions originate from the fact that all these processes do not take place in a “red and dead” giant elliptical (for which they were originally proposed) but, circumstantially, because of the limited gas inflow attributed to the nature of the dynamics of this (rare) merger case, in a gas-rich system.
The last of NGC 3718’s properties that we have to incorporate into this scheme is its spectral classification. NGC 3718 is classified as a LINER galaxy (Ho et al. 1997b) and it is also part of the NUGA sources, a survey aimed at the study of nearby LLAGNs (García-Burillo et al. 2003). This is also consistent with the inefficient transport of gas towards the center, in the sense that it affects the accretion rate by reducing the available gas reservoir. This absence of sufficient amounts of nuclear gas is also implied by the fact that NGC 3718 appears to be a sub-Eddington system with  (Krips et al. 2007), indicating that the accretion rate onto the central engine is far from efficient.
7.4. SMBH recoil
The last question within the scope of this study is, perhaps, the most prevalent one, albeit a very difficult one to answer: Is this indeed a case of a true SMBH recoil? An attempt to qualitatively answer this question requires us to further discuss the compatibility of an SMBH recoil with other observational findings for NGC 3718.
The near-the-center position of the offset red blob allows space for two different scenarios: It could either represent the beginning of an SMBH displacement or the “capture” of an ongoing SMBH recoil in one of its pericentric passages.
At first, if the age of ~2−3 Gyr of NGC 3718’s gas disk, suggested by Sparke et al. (2009), traces roughly the age of the merger, then it is in excellent agreement with the results of the simulations of Bournaud & Combes (2003), where a stable polar ring and a warp is formed within ~ 2−3 Gyr, from mergers with mass ratios of ~(1−4):1. Blecha et al. (2011) simulated recoils in galaxy mergers and they find that for mergers with mass ratios ~(1−2):1 and gas content of 10−30%, the coalescence of the SMBHs often occurs at ~2 Gyr. For such systems and for kick velocities of vkick ≤ 0.7vesc, the trajectories of the kicked SMBHs are often confined within ~1 kpc with setback times of the order of ~1 Gyr. So, time wise, it seems plausible that either a new or an ongoing SMBH recoil exists in NGC 3718 and that it would be observable.
Moreover, assuming that our current view of the formation of cores is attributed mainly to SMBH binaries and the subsequent recoils (e.g. Kormendy & Ho 2013), then the rather large Mdef ~ 19MBH (see Sect. 5.2) needs to be addressed. Such a large Mdef could be partly attributed to accumulated errors from uncertainties in the fit, uncertainties in the relation, and/or the large intrinsic scatter of the scaling relations. Such large mass deficits, however, could also imply that pre-existing cores in the progenitor galaxies have been inherited by NGC 3718. Gualandris & Merritt (2008) simulated kicks and the mass deficits that these can produce. They find that a combination of a pre-coalesced binary (Merritt 2006) followed by a subsequent recoil, can excavate as much as ~5MBH per merger. The fact that the light profiles are (more or less) preserved in dissipationless mergers (e.g. Hopkins et al. 2009b) is what leads several authors to the conclusion that large mass deficits could be indicative of different core excavation events following sequential mergers. It therefore seems possible that a large Mdef can co-exist with either a new or an ongoing SMBH recoil.
NGC 3718’s radio emission, however, may help us draw a line between a new and an ongoing SMBH recoil. To the extent that NGC 3718 is indeed an X-shaped source, it could be the host of a recently recoiled SMBH that has undergone a reorientation of its jet (Liu et al. 2012). In this case, the inheritance of a core of the observed size (~200 pc across) is considered necessary since a just recently recoiled SMBH would not have the time to excavate such a large (both spatially and in terms of Mdef) core (Merritt 2006). If, on the contrary, the secondary extensions on the radio map are not attributed to a second jet-fossil, then an ongoing SMBH recoil that accretes during one of its pericentric passages (Blecha et al. 2011) could produce a single bipolar jet structure. In this case, the inheritance of a core of the observed size is not necessary (but, partly, not prohibited either). So, in principal, a core could be excavated in one go, provided that the Mdef is considerably overestimated owing to the aforementioned uncertainties.
To conclude this work, we have presented much independent evidence, which, along with our measurements on the Subaru and e-Merlin data, suggest that it is reasonable to treat NGC 3718 as a very good candidate host galaxy of an SMBH recoil. Therefore, an interesting question arises: is the presence of SMBH recoils in mergers a standard process in galaxy evolution? If, as the observations suggest, NGC 3718 is indeed a polar ring galaxy, and polar ring galaxies make up ~5% of the lenticular and early-type galaxies in the local universe (Whitmore et al. 1990), then the detection of an SMBH recoil in such a rare object may, by itself, suggest an affirmative answer to the above question. In any case, this is as far as our data allow us to go in interpretation terms. Our limited knowledge on the exact behavior of recoiled SMBHs, our incomplete understanding of the precise mechanism(s) that are responsible for the formation of cores, and the limited resolution of the current observations, allow space only for general qualitative, and therefore highly speculative, interpretations. Certainly though, better quality future observations combined with higher-resolution simulations, are necessary in order to answer the above questions in a more robust, quantitative way. In all, NGC 3718 turns out to be an object full of wonderful surprises with, possibly, many more that are yet to be revealed.
8. Summary
We have extensively studied NGC 3718 using NIR Subaru and 6 cm e-Merlin radio data as well as previously published results. Our findings are summarized as follows:
-
1.
Our NIR color maps do not show any signs of a large-scale constant color gradient, indicating that our view towards the nucleus of NGC 3718 is unaffected by extinction.
-
2.
An offset red blob is detected in our NIR color maps, being displaced by ~4.25 pc from the center of the underlying stellar bulge. The radio emission appears to originate from a position closer to the offset red blob than to the center of the stellar bulge.
-
3.
A light decomposition reveals a contribution (up to ~50%) from a hot (up to ~1000 K) dust component to the incoming light from the central ~0.5 arcsec, indicative of the presence of gas in that region.
-
4.
An extended elongated structure ~1 arcsec across is detected in the e-Merlin radio map, probably indicative of a small-scale bipolar jet. A second smaller one ~0.6 arcsec across lies almost perpendicular to the first one, suggesting a possible X-shaped radio source. However, these extended structures may also contain a contribution from supernova remnant (SNR) related non-thermal emission.
-
5.
A disagreement between the MBH−L and MBH−σ scaling relations when NGC 3718’s measured values are used and the shape of the surface brightness profile reveal an amount of missing light in the form of a scoured core of ~200 pc across. This light deficit translated to mass, reflects an Mdef ~ 19MBH.
-
6.
NGC 3718 shows mixed characteristics in two ways. It has spiral-like photometry (seen in the surface brightness profile as a dual disk component) combined with elliptical-like kinematics (seen in the surface brightness profile as a bulge component with Sersic index n> 4). Furthermore, NGC 3718 shows characteristics that belong to both fainter, more rotationally supported, disky, coreless ellipticals, as well as to giant, less rotationally supported, boxy, core ellipticals. These strongly imply that NGC 3718 is the result of a merger.
-
7.
Finally, NGC 3718 appears to be the host of an SMBH recoil. Evidence for this include an offset NIR red blob with a potentially coincident offset radio emission, the presence of a core in the surface brightness profile, a relative redshift between the broad and narrow Hα emission lines, and the indication of the presence of a hyper compact stellar system surrounding the offset NIR red blob.
Online material
Appendix A: Influence of the dust lane
Appendix A provides additional evidence to that discussed in Sect. 4 regarding the potential influence of the dust lane on our view towards NGC 3178’s nucleus.
For this reason we present Fig. A.1, where the 2MASS KS band image of NGC 3718 is shown. What can be noted in Fig. A.1 is that the 2MASS KS band contours (in red) appear to be almost entirely unaffected by the presence of the dust lane. They appear to be significantly rounder and better defined, especially when compared to the SDSS r band contours (in green), which are severely deformed by the presence of foreground dust in the region. Additionally, our Subaru KS band contours (in yellow) appear to be more of a smaller scale inward extrapolation of the 2MASS KS band contours (as expected), rather than of the visible light, heavily, distorted contours. Moreover, the innermost ~4 arcsec of our Subaru KS band are located ~1.5 arcsec from the region where the contour deformation in the optical becomes catastrophic, which naturally coincides approximately with the projected beginning of the dust lane (white dashed box).
We consider it safe, therefore, to treat the central region of NGC 3718 in the NIR, as being unaffected by the presence of the dust lane when we attempt to interpret our NIR color maps.
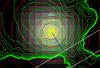 |
Fig. A.1 2MASS KS band image of NGC 3718. Over-plotted can be seen 1) 2MASS KS band contours (red); 2) SDSS r band (~0.6 μm) contours (green); 3) Subaru KS band contours (yellow), and 4) distance (blue dashed line length ~3.5 arcsec) of the optical and NIR peak flux positions to the approximate beginning of the dust lane (outlined with the white dashed box). |
Appendix B: The z-J bands alignment
Appendix B focuses on the validity of the coordinates calibration method used on the Subaru data, described in Sect. 3.5.
For this reason we present Fig. B.1, where the SDSS z band image of NGC 3718 is displayed. In this image, the black dashed ellipse has a major axis of ~4 arcsec, while the blue dashed line indicates that this is, approximately, the radial distance where the SDSS z band contours begin to deviate from being symmetric with respect to the peak flux positions. What can be seen is that the SDSS z band contours are well defined, relatively round, and, more importantly, symmetric within this region. Especially when compared to the SDSS r band contours (green contours in Fig. A.1), they seem to be almost entirely unaffected by the presence of dust within the region of interest and we consider them to be suitable for use,
for an accurate estimation of the photocenter of NGC 3718 in this band. Moreover, our J band contours appear to be similar to the SDSS z band contours, i.e. in terms of similar roundness. The z band ellipticities range between ~0.13−0.15, while in J band they range between ~0.09−0.12 in the radial interval ~0.5−1.5 arcsec, indicating that, at least to a large extent, both bands appear to be similarly unaffected by the presence of foreground dust.
We consider, therefore, that the aforementioned symmetry of the SDSS z band contours in the central ~4 arcsec of NGC 3718, as well as their similarity to the J band contours, safely allow us to apply the centering method described in Sect. 3.1. The derived photocenters are used to align the SDSS z band with our Subaru J, H, and KS bands in order to astrometrically calibrate them.
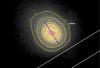 |
Fig. B.1 SDSS z band image of NGC 3718. Over-plotted can be seen: 1) the SDSS z band contours (yellow) and 2) the Subaru J band contours (red). The black dashed ellipse and the blue dashed line show the symmetry of the SDSS z band contours within the central ~4 arcsec of NGC 3718. |
Appendix C: The e-Merlin radio map position
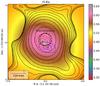 |
Fig. C.1 Same as Fig. 13, but with the radio map position dictated by the old phase reference source position. This is the equivalent position to the one reported by Krips et al. (2007), namely RA: 11:32:34.8534 ± 0.0005, Dec: +53:04:04.523 ± 0.004. |
Perhaps a more correct term would be a “background” subtraction, but in the NIR most of the background contamination refers to the sky component. We create our “sky” frame(s) by keeping values lower than the mode of the image(s), which should be a good approximation of the sky contamination. On top of that, we add a layer obtained by applying a high pass filter on the image(s) in order to account for the pixel-to-pixel variations.
IRAF is distributed by the National Optical Astronomy Observatories, which are operated by the Association of Universities for Research in Astronomy, Inc., under cooperative agreement with the National Science Foundation.
In the absence of asymmetries in the light distribution, the plots of Fig. 4 are expected to be close to horizontal lines, i.e. all the fitted ellipses should point towards a common center.
The V−K color of NGC 3718 is ~3 (NED), suggesting a dominant stellar population with Teff ~ 4000 K, consistent with K/M type stars (Ridgway et al. 1980).
The NIR ellipticities range between ~0.09−0.12 in J band, ~0.07−0.09 in H band, and ~0.03−0.07 in Ks band, in the radial interval between ~0.5−1.5 arcsec.
As we approach the center, the brightness difference becomes increasingly smaller. When the residuals are minimal, with respect to neighboring pivot points, they should represent, to a first order, actual light density variations.
Following Ockham’s razor, however, throughout this paper we try to restrict the use of either of these to minimum for the sake of credibility.
We magnify a 51 × 51 pixel2 (FoV 20 × 20 arcsec2) part of the SDSS z band centered on the nucleus of NGC 3718 by a factor of ~40, equal to the scale ratio of the SDSS and Subaru data (namely ~0.4 and ~0.01  , respectively). The new 2040 × 2040 pixel2 SDSS z band replica is then aligned with our Subaru J(H and KS, trimmed to 2040 × 2040 pixel2) band(s), following the method described in Sect. 3.1.
A non-uniform, progressively thinner, dust extension northward of the dust lane, would translate into progressively excessive dust towards the S/SW in comparison to the N/NE. This would lead to excessive reddening, resulting in an asymmetry in the Fig. 9 plots, in the form of: progressively more dust → progressively increasing reddening → progressively fainter J(H) → progressively larger J−H (H−KS) towards the S/SW. A uniformly distributed foreground dust extension, however, could be present, but in this case the reddening should be uniform as well, a fact that would not affect (at least) the (qualitative) interpretation of our results.
In the position angle of the blue dashed line, which could be identified as the westward candidate jet component, that Krips et al. (2007) see in their EVN 6 cm map. The same structure also aligns with the jet-like structure seen at arcmin scales by the VLA at 1.49 GHz in C/D-array configuration by Condon (1987).
To account for the statistical deviation of the measurements, for systematic uncertainties in the calibration process, etc.
A pseudo-bulge is a central high-density stellar region similar to a classical bulge, but with properties closer to disk-like objects (e.g. supported mainly from rotation rather than from pressure due to the random motions of stars). Their formation mechanisms are believed to be different than the ones that formed classical bulges.
We support the view of Sparke et al. (2009). We examine GALEX near and far UV images and we find that NGC 3718’s UV flux is ~1 order of magnitude less than the flux of the starburst galaxy NGC 4449, which indicates some amount of star formation, but at the same time this is not high enough to be characterized as a starburst.
Sample in the inner ~2.5 arcsec.
Sample between ~2.5 and ~70 arcsec.
We agree with Hopkins et al. (2008) on the danger of doing three component fits. Our fit is indeed very sensitive to the adopted lower and upper limits. This is the reason why we resort to trusting the statistical robustness of our sample and set statistical, yet as physical as possible, constraints. The fact that we confirm, more or less, the fit of Dong & De Robertis (2006) indicates some consistency. Moreover, we know that light is missing from the central region since the published aperture photometry values for NGC 3718 on NED are closer to our Subaru measurement than to the recovered magnitudes. We cannot, however, rule out the case of a slightly different Sersic index with a small extra light component near the position of the transition from the disk to the bulge dominated component (log (R) ~ 2−2.5 pc in Fig. 14). Such a transition would be very difficult, if not impossible, to distinguish, in this case because of the presence of the disk. Provided that NGC 3718 is a merger remnant, the low star formation activity is expected to have created an amount of post merging stars that could, in principal, have resembled an extra light component. We think that this would not change dramatically our overall view, especially regarding the amount of the missing light, which seems to be quite dominant.
The sensitivity issue on the adopted upper and lower limits is also mentioned by Jog & Chitre (2002) and they decide not to make such a fit. Our Subaru data, however, resolve the innermost ~2.5 arcsec of NGC 3718 more accurately, providing us with a richer data sample to work with.
Observed mostly on bright giant ellipticals.
Elliptical galaxies form two distinct categories, each one defined by specific fundamental properties such as core or coreless, boxy or disky, etc.
The E–E dichotomy border is calculated for H0 =72 km s-1. For this value the absolute magnitude of NGC 3718 becomes  mag.
mag.
A4 Fourier coefficient indicating the deviation from an ellipse. Boxy objects have a A4 < 0, whereas disky objects have a A4 > 0.
This velocity shift represents the projected kick velocity, so it may only serve as a lower limit of the true kick velocity and this should be accounted for in all subsequent calculations.
Sparke et al. (2009) measures MHI ~ 8 × 10⁹M⊙, a value ~2 times larger than the Milky Way, while Krips et al. (2005) measures ~2.4 × 10⁸M⊙ of molecular gas through CO observations, values that can characterize NGC 3718 as a gas-rich galaxy.
Acknowledgments
We thank Prof. David Merritt, for the enlightening discussions that helped us forge a better understanding of the nuclear dynamics. We would also like to thank the anonymous referees, for the fruitful comments that helped clarify the description of the methods we used in this work. The Subaru telescope operation team as well as the HiCIAO instrument team for their generous support. MERLIN is a National Facility operated by the University of Manchester at Jodrell Bank Observatory on behalf of STFC. This work was supported by the Max Planck Society and the University of Cologne through the International Max Planck Research School (IMPRS) for Astronomy and Astrophysics as well as in part by the Deutsche Forschungsgemeinschaft (DFG) via grant SFB 956. We had fruitful discussions with members of the European Union funded COST Action MP0905: Black Holes in a violent Universe and the COST Action MP1104: Polarization as a tool to study the Solar System and beyond.
References
- Begelman, M. C., Blandford, R. D., & Rees, M. J. 1980, Nature, 287, 307 [NASA ADS] [CrossRef] [Google Scholar]
- Bekenstein, J. D. 1973, ApJ, 183, 657 [NASA ADS] [CrossRef] [Google Scholar]
- Bekki, K. 1997, ApJ, 490, L37 [NASA ADS] [CrossRef] [Google Scholar]
- Bekki, K. 1998, ApJ, 499, 635 [CrossRef] [Google Scholar]
- Bell, E. F., McIntosh, D. H., Katz, N., & Weinberg, M. D. 2003, ApJS, 149, 289 [NASA ADS] [CrossRef] [Google Scholar]
- Blecha, L., Cox, T. J., Loeb, A., & Hernquist, L. 2011, MNRAS, 412, 2154 [NASA ADS] [CrossRef] [Google Scholar]
- Bournaud, F., & Combes, F. 2003, A&A, 401, 817 [NASA ADS] [CrossRef] [EDP Sciences] [Google Scholar]
- Bournaud, F., Jog, C. J., & Combes, F. 2005, A&A, 437, 69 [NASA ADS] [CrossRef] [EDP Sciences] [Google Scholar]
- Caldwell, N., Kirshner, R. P., & Richstone, D. O. 1986, ApJ, 305, 136 [NASA ADS] [CrossRef] [Google Scholar]
- Cappellari, M., Emsellem, E., Bacon, R., et al. 2007, MNRAS, 379, 418 [NASA ADS] [CrossRef] [Google Scholar]
- Chitre, A., & Jog, C. J. 2002, A&A, 388, 407 [NASA ADS] [CrossRef] [EDP Sciences] [Google Scholar]
- Condon, J. J. 1987, ApJS, 65, 485 [NASA ADS] [CrossRef] [Google Scholar]
- de Vaucouleurs, G., de Vaucouleurs, A., Corwin, Jr., H. G., et al. 1991, Third Reference Catalogue of Bright Galaxies, Vol. I: Explanations and references, Vol. II: Data for galaxies between 0h and 12h, Vol. III: Data for galaxies between 12h and 24h [Google Scholar]
- Dong, X. Y., & De Robertis, M. M. 2006, AJ, 131, 1236 [NASA ADS] [CrossRef] [Google Scholar]
- Dufour, R. J., Harvel, C. A., Martins, D. M., et al. 1979, AJ, 84, 284 [NASA ADS] [CrossRef] [Google Scholar]
- Emsellem, E., Cappellari, M., Krajnović, D., et al. 2007, MNRAS, 379, 401 [NASA ADS] [CrossRef] [Google Scholar]
- Filippenko, A. V., & Sargent, W. L. W. 1985, ApJS, 57, 503 [NASA ADS] [CrossRef] [Google Scholar]
- García-Burillo, S., Sempere, M. J., Combes, F., Hunt, L. K., & Neri, R. 2000, A&A, 363, 869 [NASA ADS] [Google Scholar]
- García-Burillo, S., Combes, F., Eckart, A., et al. 2003, Active Galactic Nuclei: From Central Engine to Host Galaxy, eds. S. Collin, F. Combes, & I. Shlosman, ASP Conf. Ser., 290, 423 [Google Scholar]
- Glass, I. S. 1984, MNRAS, 211, 461 [NASA ADS] [Google Scholar]
- Glass, I. S., & Moorwood, A. F. M. 1985, MNRAS, 214, 429 [NASA ADS] [CrossRef] [Google Scholar]
- Graham, A. W. 2004, ApJ, 613, L33 [NASA ADS] [CrossRef] [Google Scholar]
- Graham, A. W., Erwin, P., Trujillo, I., & Asensio Ramos, A. 2003, AJ, 125, 2951 [NASA ADS] [CrossRef] [Google Scholar]
- Gualandris, A., & Merritt, D. 2008, ApJ, 678, 780 [NASA ADS] [CrossRef] [Google Scholar]
- Hayano, Y., Takami, H., Oya, S., et al. 2010, SPIE Conf. Ser., 7736 [Google Scholar]
- Ho, L. C. 2009, ApJ, 699, 638 [NASA ADS] [CrossRef] [Google Scholar]
- Ho, L. C., Filippenko, A. V., & Sargent, W. L. W. 1997a, ApJS, 112, 315 [NASA ADS] [CrossRef] [Google Scholar]
- Ho, L. C., Filippenko, A. V., Sargent, W. L. W., & Peng, C. Y. 1997b, ApJS, 112, 391 [NASA ADS] [CrossRef] [Google Scholar]
- Ho, L. C., Greene, J. E., Filippenko, A. V., & Sargent, W. L. W. 2009, ApJS, 183, 1 [NASA ADS] [CrossRef] [Google Scholar]
- Holmberg, E. 1958, Meddelanden fran Lunds Astronomiska Observatorium Serie II, 136, 1 [Google Scholar]
- Hopkins, P. F., Hernquist, L., Cox, T. J., Dutta, S. N., & Rothberg, B. 2008, ApJ, 679, 156 [NASA ADS] [CrossRef] [Google Scholar]
- Hopkins, P. F., Cox, T. J., Dutta, S. N., et al. 2009a, ApJS, 181, 135 [NASA ADS] [CrossRef] [Google Scholar]
- Hopkins, P. F., Lauer, T. R., Cox, T. J., Hernquist, L., & Kormendy, J. 2009b, ApJS, 181, 486 [NASA ADS] [CrossRef] [Google Scholar]
- Jog, C. J., & Chitre, A. 2002, A&A, 393, L89 [NASA ADS] [CrossRef] [EDP Sciences] [Google Scholar]
- Karachentsev, I. D., Nasonova, O. G., & Courtois, H. M. 2013, MNRAS, 429, 2264 [NASA ADS] [CrossRef] [Google Scholar]
- Komossa, S. 2012, Adv. Astron., 2012, 364973 [NASA ADS] [CrossRef] [Google Scholar]
- Kormendy, J. 2009, Galaxy Evolution: Emerging Insights and Future Challenges, eds. S. Jogee, I. Marinova, L. Hao, & G. A. Blanc, ASP Conf. Ser., 419, 87 [Google Scholar]
- Kormendy, J., & Bender, R. 1999, ApJ, 522, 772 [NASA ADS] [CrossRef] [Google Scholar]
- Kormendy, J., & Bender, R. 2013, ApJ, 769, L5 [NASA ADS] [CrossRef] [Google Scholar]
- Kormendy, J., & Ho, L. C. 2013, ARA&A, 51, 511 [Google Scholar]
- Kormendy, J., & Kennicutt, Jr., R. C. 2004, ARA&A, 42, 603 [NASA ADS] [CrossRef] [Google Scholar]
- Kormendy, J., Fisher, D. B., Cornell, M. E., & Bender, R. 2009, ApJS, 182, 216 [NASA ADS] [CrossRef] [Google Scholar]
- Kormendy, J., Bender, R., & Cornell, M. E. 2011, Nature, 469, 374 [NASA ADS] [CrossRef] [Google Scholar]
- Krips, M., Eckart, A., Neri, R., et al. 2005, A&A, 442, 479 [NASA ADS] [CrossRef] [EDP Sciences] [Google Scholar]
- Krips, M., Eckart, A., Krichbaum, T. P., et al. 2007, A&A, 464, 553 [NASA ADS] [CrossRef] [EDP Sciences] [Google Scholar]
- Lal, D. V., & Rao, A. P. 2007, MNRAS, 374, 1085 [NASA ADS] [CrossRef] [Google Scholar]
- Liu, F. K., Wang, D., & Chen, X. 2012, ApJ, 746, 176 [NASA ADS] [CrossRef] [Google Scholar]
- Martini, P., & Pogge, R. W. 1999, AJ, 118, 2646 [NASA ADS] [CrossRef] [Google Scholar]
- Merritt, D. 2006, ApJ, 648, 976 [NASA ADS] [CrossRef] [Google Scholar]
- Merritt, D., & Ekers, R. D. 2002, Science, 297, 1310 [NASA ADS] [CrossRef] [PubMed] [Google Scholar]
- Merritt, D., Storchi-Bergmann, T., Robinson, A., et al. 2006, MNRAS, 367, 1746 [NASA ADS] [CrossRef] [Google Scholar]
- Nipoti, C., & Binney, J. 2007, MNRAS, 382, 1481 [NASA ADS] [Google Scholar]
- Ostriker, J. P., & Ciotti, L. 2005, Roy. Soc. London Philos. Trans. Ser. A, 363, 667 [NASA ADS] [CrossRef] [Google Scholar]
- Perley, R. A., & Butler, B. J. 2013, ApJS, 204, 19 [NASA ADS] [CrossRef] [Google Scholar]
- Peterson, B. M. 1997, An Introduction to Active Galactic Nuclei (Cambridge: Cambridge University Press), 1 [Google Scholar]
- Pier, J. R., Munn, J. A., Hindsley, R. B., et al. 2003, AJ, 125, 1559 [NASA ADS] [CrossRef] [Google Scholar]
- Pignatelli, E., Corsini, E. M., Vega Beltrán, J. C., et al. 2001, MNRAS, 323, 188 [NASA ADS] [CrossRef] [Google Scholar]
- Pott, J.-U., Hartwich, M., Eckart, A., et al. 2004, A&A, 415, 27 [NASA ADS] [CrossRef] [EDP Sciences] [Google Scholar]
- Reshetnikov, V. P., & Combes, F. 1994, A&A, 291, 57 [NASA ADS] [Google Scholar]
- Reshetnikov, V., & Sotnikova, N. 1997, A&A, 325, 933 [NASA ADS] [Google Scholar]
- Ridgway, S. T., Joyce, R. R., White, N. M., & Wing, R. F. 1980, ApJ, 235, 126 [NASA ADS] [CrossRef] [Google Scholar]
- Schinnerer, E., Eckart, A., & Tacconi, L. J. 2000a, ApJ, 533, 826 [NASA ADS] [CrossRef] [Google Scholar]
- Schinnerer, E., Eckart, A., Tacconi, L. J., Genzel, R., & Downes, D. 2000b, ApJ, 533, 850 [NASA ADS] [CrossRef] [Google Scholar]
- Schwarz, U. J. 1985, A&A, 142, 273 [NASA ADS] [Google Scholar]
- Shlosman, I., Frank, J., & Begelman, M. C. 1989, Nature, 338, 45 [NASA ADS] [CrossRef] [Google Scholar]
- Sijacki, D., Springel, V., & Haehnelt, M. G. 2011, MNRAS, 414, 3656 [NASA ADS] [CrossRef] [Google Scholar]
- Sparke, L. S. 1996, ApJ, 473, 810 [NASA ADS] [CrossRef] [Google Scholar]
- Sparke, L. S., van Moorsel, G., Schwarz, U. J., & Vogelaar, M. 2009, AJ, 137, 3976 [NASA ADS] [CrossRef] [Google Scholar]
- Suzuki, R., Kudo, T., Hashimoto, J., et al. 2010, SPIE Conf. Ser., 7735 [Google Scholar]
- Thomas, D., Maraston, C., Bender, R., & Mendes de Oliveira, C. 2005, ApJ, 621, 673 [NASA ADS] [CrossRef] [Google Scholar]
- Toomre, A., & Toomre, J. 1972, ApJ, 178, 623 [NASA ADS] [CrossRef] [Google Scholar]
- Tueller, J., Baumgartner, W. H., Markwardt, C. B., et al. 2010, ApJS, 186, 378 [NASA ADS] [CrossRef] [Google Scholar]
- Tully, R. B., Verheijen, M. A. W., Pierce, M. J., Huang, J.-S., & Wainscoat, R. J. 1996, AJ, 112, 2471 [NASA ADS] [CrossRef] [Google Scholar]
- White, S. D. M., & Rees, M. J. 1978, MNRAS, 183, 341 [NASA ADS] [CrossRef] [Google Scholar]
- Whitmore, B. C., Lucas, R. A., McElroy, D. B., et al. 1990, AJ, 100, 1489 [NASA ADS] [CrossRef] [Google Scholar]
- Wild, W., Eckart, A., & Wiklind, T. 1997, A&A, 322, 419 [NASA ADS] [Google Scholar]
- Zhang, X.-G., Dultzin-Hacyan, D., & Wang, T.-G. 2007, MNRAS, 374, 691 [NASA ADS] [CrossRef] [Google Scholar]
All Tables
All Figures
|
Fig. 1 9.5 × 4.5 arcmin SDSS gri composite image of NGC 3718. |
| In the text | |
|
Fig. 2 KS band before sky subtraction (left) and the sky frame extracted from the KS image (right). Similar sky frames were created and subtracted from the J and H bands as well. |
| In the text | |
|
Fig. 3 J (top left), H (top right), and KS (bottom middle) ready-for-science images. |
| In the text | |
|
Fig. 4 X (left column) and Y (right column) central coordinates of each fitted ellipse versus its SMA for the KS (red/top), H (blue/middle), and J (green/bottom) bands. The shaded ellipses indicate the most prominent stable values used to derive the first order approximation photocenters. |
| In the text | |
|
Fig. 5 J (top left), H (top right), and KS (bottom middle) residual images from the pivot and subtract operation, smoothed with a 10-pixel Gaussian kernel. The residual mean peak fluxes, expressed as percentages of NGC 3718’s mean peak fluxes, are ~4.5% (J), ~3.0% (H), and ~3.4% (KS), respectively. |
| In the text | |
|
Fig. 6 Examples of the H band smoothed residual images after a rotation around incorrect pivot points by ( |
| In the text | |
|
Fig. 7 J (top left), H (top right), and KS (bottom middle) symmetrical light images after the removal of the residuals. |
| In the text | |
|
Fig. 8 H−KS (top) and J−H (bottom) NIR color maps. |
| In the text | |
|
Fig. 9 Radial profiles of the H−KS (left column) and J−H (right column) NIR color maps derived from two sets of perpendicular directions measured counterclockwise from the north. These are 120°/ 210° (blue/red points, respectively) in the upper row and 170°/ 260° (green/magenta points, respectively) in the lower row. Negative→positive relative offset reflects a S(E,W)→N(W,E) direction. |
| In the text | |
|
Fig. 10 Top: H−KS closeup. The red blob contours (red) are offset from the symmetrical light image’s peak contours (i.e. the center of the stellar bulge, in blue). Bottom: KS band high pass filtered image closeup. The peak flux is offset from the photocenter of the KS band. In both images, the red circle indicates the position of the peak value of the offset red blob, while the blue circle indicates the position of the center of the stellar bulge, as derived from our contour analysis. Their radii indicate the positional uncertainty of each position, which is ~7 mas. The yellow (top)/cyan(bottom) line is the length of the offset, namely ~50 mas. |
| In the text | |
|
Fig. 11 Glass & Moorwood (1985) two color diagram. Moving away from the ordinary galaxy colors (black circle at J−H = 0.78 and H−K = 0.22) and along the horizontal lines in the loci of mixtures, there is an increasing percentage (10% per vertical line) of contribution from hot dust emission, while moving along the vertical lines, the temperature of this dust component increases (T ~ 500−1500 K). |
| In the text | |
|
Fig. 12 e-Merlin 6 cm radio map. The outer contours are set to ~4σ above the background where the flux is ~2 orders of magnitude less than the peak flux. The third inner contour is ~40−50% of the peak flux. The red and blue dashed lines represent the position angle of the SE–NW and the NE–SW candidate small-scale bipolar extended structures, respectively. The beam is shown in the upper left corner. |
| In the text | |
|
Fig. 13 Same as the upper image of Fig. 10, but with the radio contours over-plotted (in the position quoted in Table 2. The same image with the equivalent to the Krips et al. 2007 position is shown in Fig. C.1). The blue and red circle radii indicate the positional uncertainty of each position, namely ~7 mas. The black dashed ellipse indicates the total coordinates uncertainty of Table 2. |
| In the text | |
|
Fig. 14 First figure: surface brightness in the KS band versus log (R) in pc. The blue dashed line represents the inwardly extrapolated Sersic profile of the bulge, while the black dashed line represents the dual exponential disk profile. The blue points represent the 2MASS KS data, while red points represent our Subaru KS data. Second figure: Same as the first figure, but with the different components added. Here the red dashed line represents the fitted model, whereas the black points represent the complete joined data set. Third figure: surface brightness in the KS band versus R (in arcsec) of the innermost ~3 arcsec. The red dashed line represents the fitted model, while black points represent (up to ~2.5 arcsec) our Subaru KS data. Fourth figure: same as the third figure, but plotted for the complete data range (~70 arcsec). The green lines represent the uncertainties of the data points. |
| In the text | |
|
Fig. 15 A4 parameter versus radius for NGC 3718. From top to bottom, A4 parameter for the KS (red/top), H (blue/middle), and J (green/bottom) bands, respectively, versus R in arcsec. In all plots the dashed black line represents the border between a disky and a boxy object. |
| In the text | |
|
Fig. A.1 2MASS KS band image of NGC 3718. Over-plotted can be seen 1) 2MASS KS band contours (red); 2) SDSS r band (~0.6 μm) contours (green); 3) Subaru KS band contours (yellow), and 4) distance (blue dashed line length ~3.5 arcsec) of the optical and NIR peak flux positions to the approximate beginning of the dust lane (outlined with the white dashed box). |
| In the text | |
|
Fig. B.1 SDSS z band image of NGC 3718. Over-plotted can be seen: 1) the SDSS z band contours (yellow) and 2) the Subaru J band contours (red). The black dashed ellipse and the blue dashed line show the symmetry of the SDSS z band contours within the central ~4 arcsec of NGC 3718. |
| In the text | |
|
Fig. C.1 Same as Fig. 13, but with the radio map position dictated by the old phase reference source position. This is the equivalent position to the one reported by Krips et al. (2007), namely RA: 11:32:34.8534 ± 0.0005, Dec: +53:04:04.523 ± 0.004. |
| In the text | |
Current usage metrics show cumulative count of Article Views (full-text article views including HTML views, PDF and ePub downloads, according to the available data) and Abstracts Views on Vision4Press platform.
Data correspond to usage on the plateform after 2015. The current usage metrics is available 48-96 hours after online publication and is updated daily on week days.
Initial download of the metrics may take a while.