Fig. 11
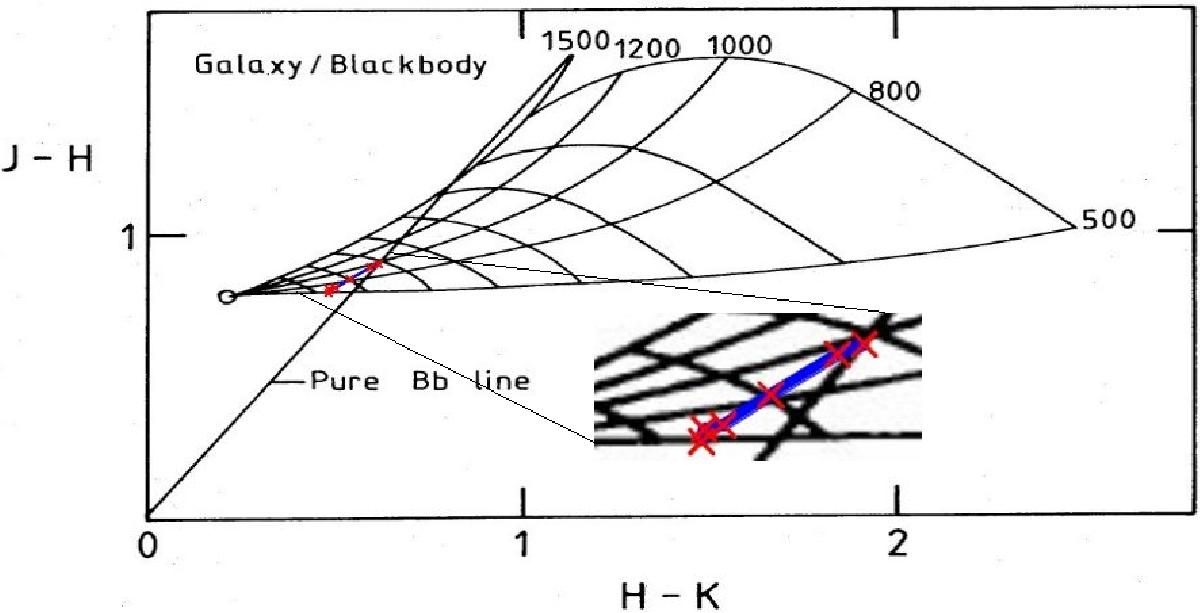
Glass & Moorwood (1985) two color diagram. Moving away from the ordinary galaxy colors (black circle at J−H = 0.78 and H−K = 0.22) and along the horizontal lines in the loci of mixtures, there is an increasing percentage (10% per vertical line) of contribution from hot dust emission, while moving along the vertical lines, the temperature of this dust component increases (T ~ 500−1500 K).
Current usage metrics show cumulative count of Article Views (full-text article views including HTML views, PDF and ePub downloads, according to the available data) and Abstracts Views on Vision4Press platform.
Data correspond to usage on the plateform after 2015. The current usage metrics is available 48-96 hours after online publication and is updated daily on week days.
Initial download of the metrics may take a while.