Fig. 13
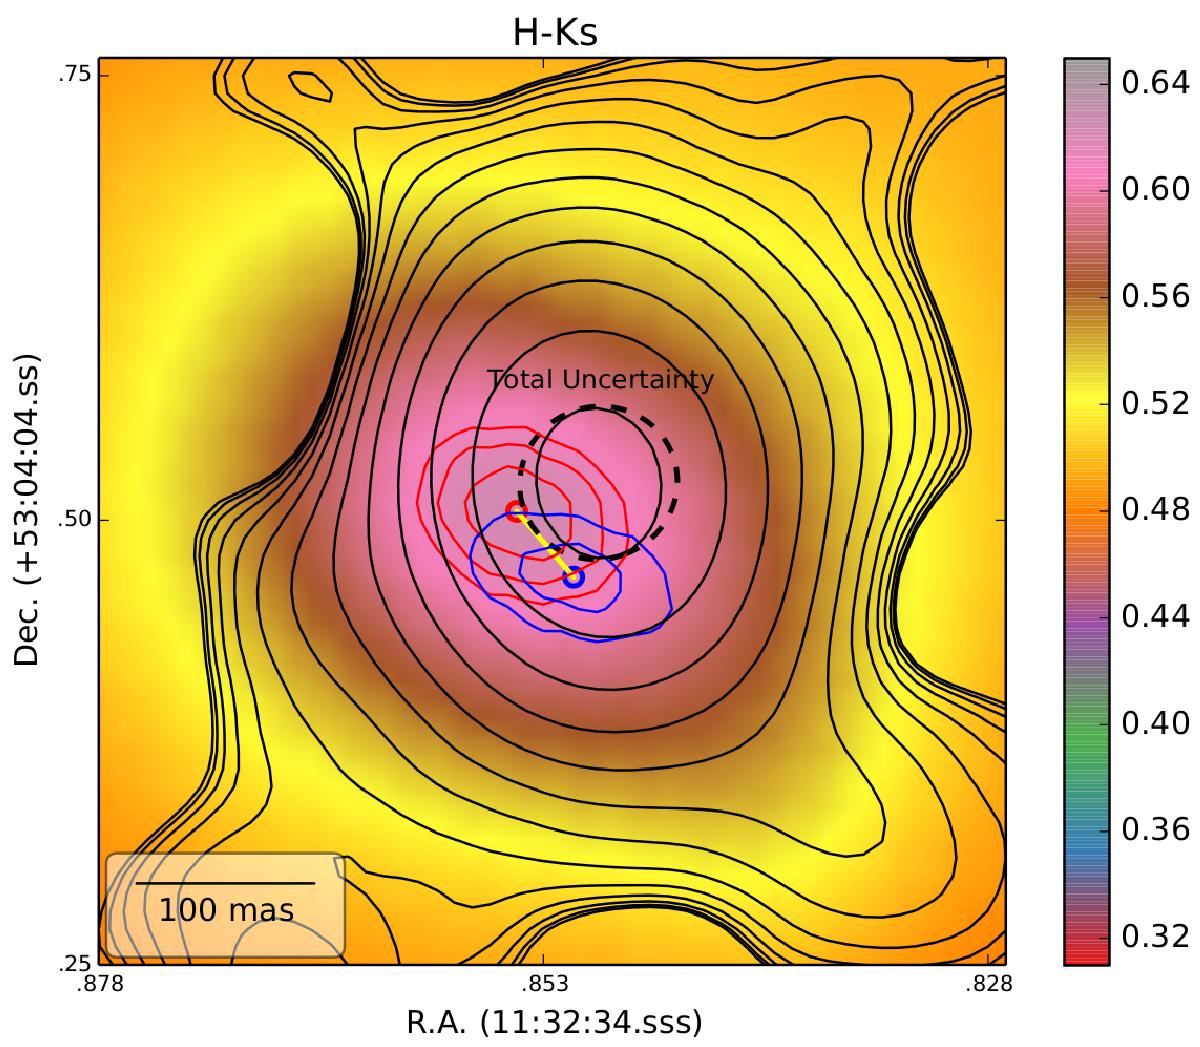
Same as the upper image of Fig. 10, but with the radio contours over-plotted (in the position quoted in Table 2. The same image with the equivalent to the Krips et al. 2007 position is shown in Fig. C.1). The blue and red circle radii indicate the positional uncertainty of each position, namely ~7 mas. The black dashed ellipse indicates the total coordinates uncertainty of Table 2.
Current usage metrics show cumulative count of Article Views (full-text article views including HTML views, PDF and ePub downloads, according to the available data) and Abstracts Views on Vision4Press platform.
Data correspond to usage on the plateform after 2015. The current usage metrics is available 48-96 hours after online publication and is updated daily on week days.
Initial download of the metrics may take a while.