Fig. 10
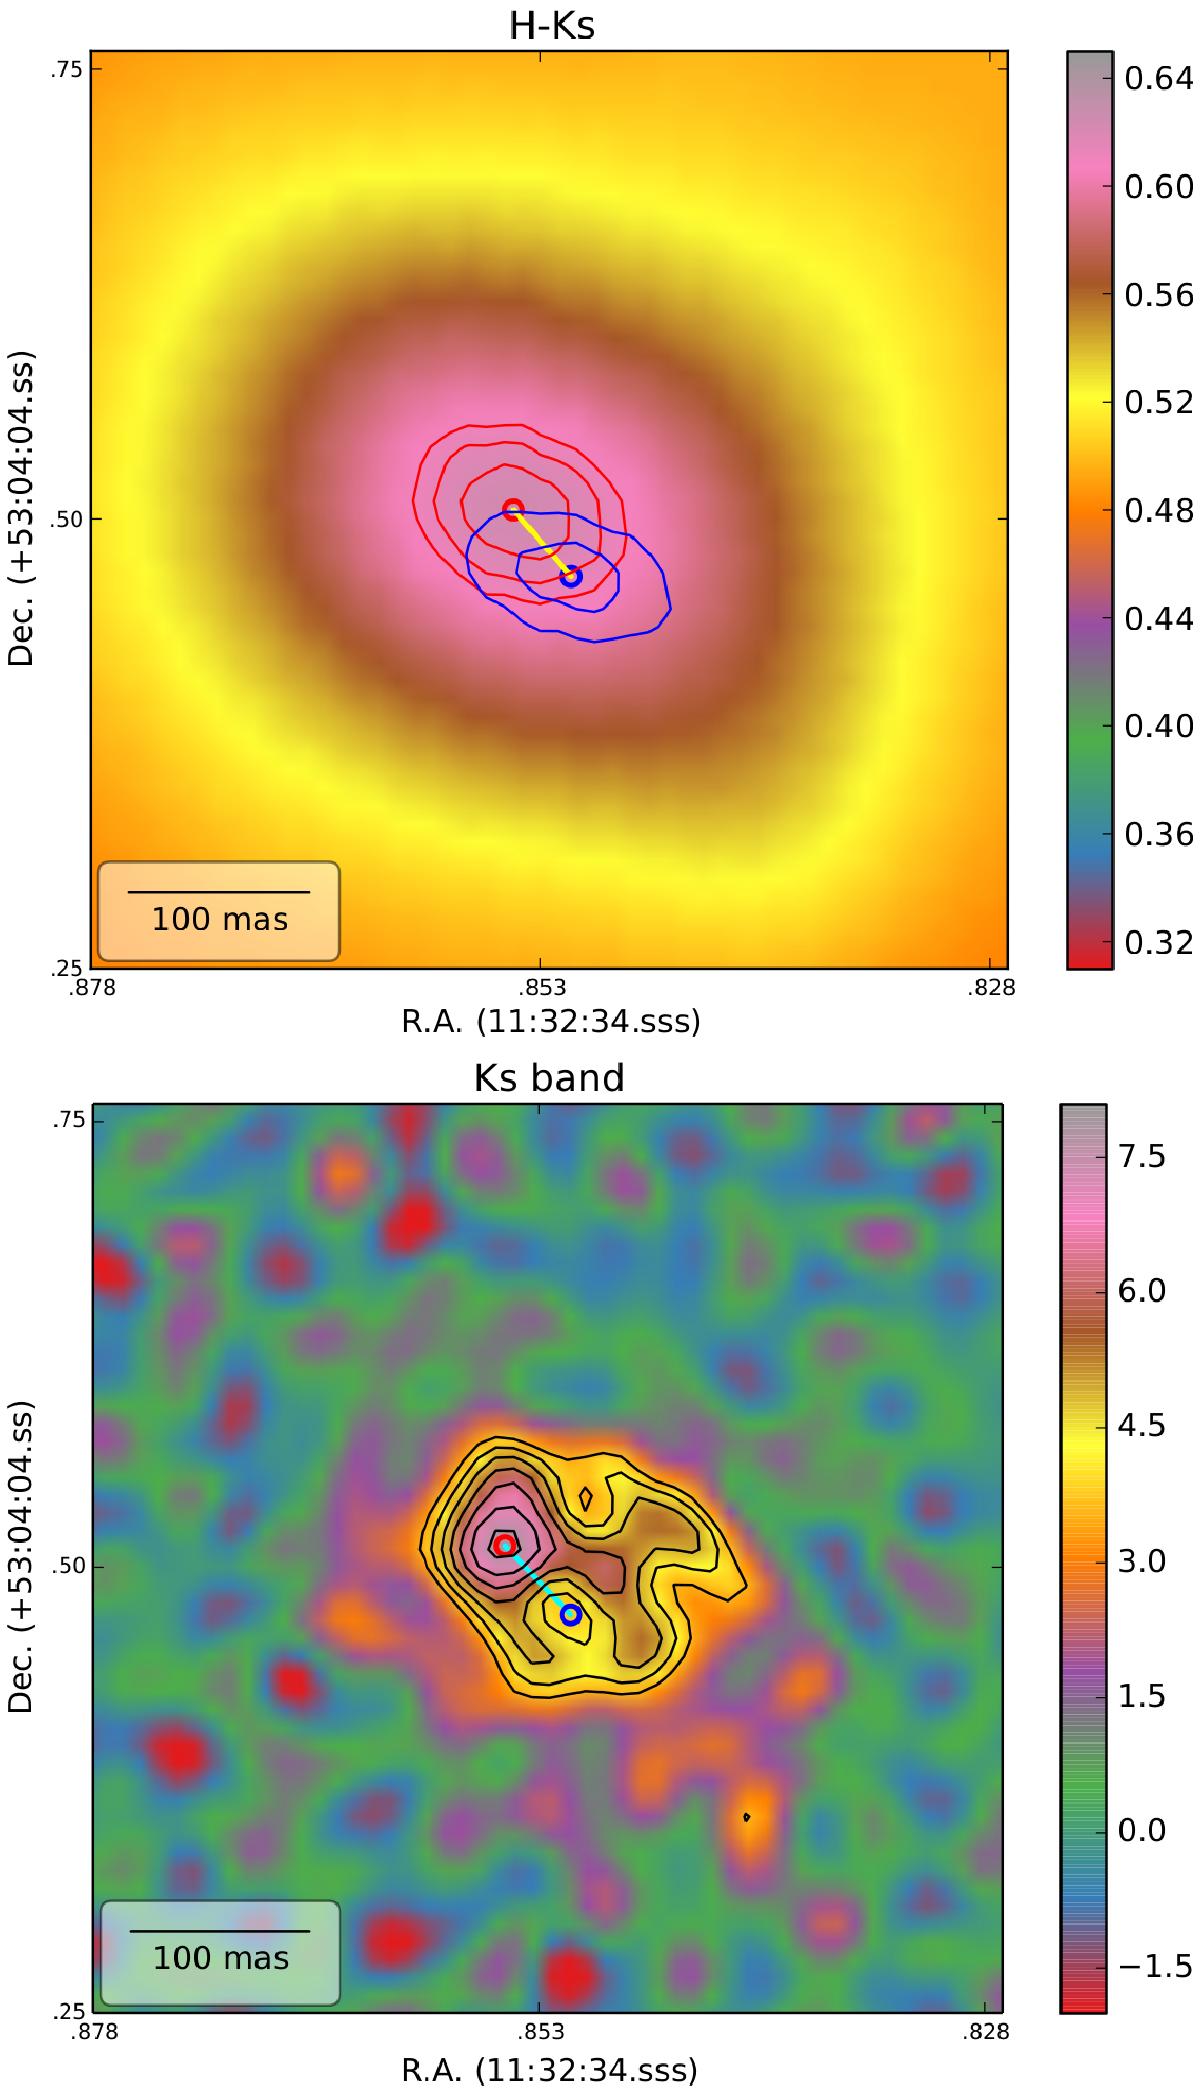
Top: H−KS closeup. The red blob contours (red) are offset from the symmetrical light image’s peak contours (i.e. the center of the stellar bulge, in blue). Bottom: KS band high pass filtered image closeup. The peak flux is offset from the photocenter of the KS band. In both images, the red circle indicates the position of the peak value of the offset red blob, while the blue circle indicates the position of the center of the stellar bulge, as derived from our contour analysis. Their radii indicate the positional uncertainty of each position, which is ~7 mas. The yellow (top)/cyan(bottom) line is the length of the offset, namely ~50 mas.
Current usage metrics show cumulative count of Article Views (full-text article views including HTML views, PDF and ePub downloads, according to the available data) and Abstracts Views on Vision4Press platform.
Data correspond to usage on the plateform after 2015. The current usage metrics is available 48-96 hours after online publication and is updated daily on week days.
Initial download of the metrics may take a while.