Fig. 12
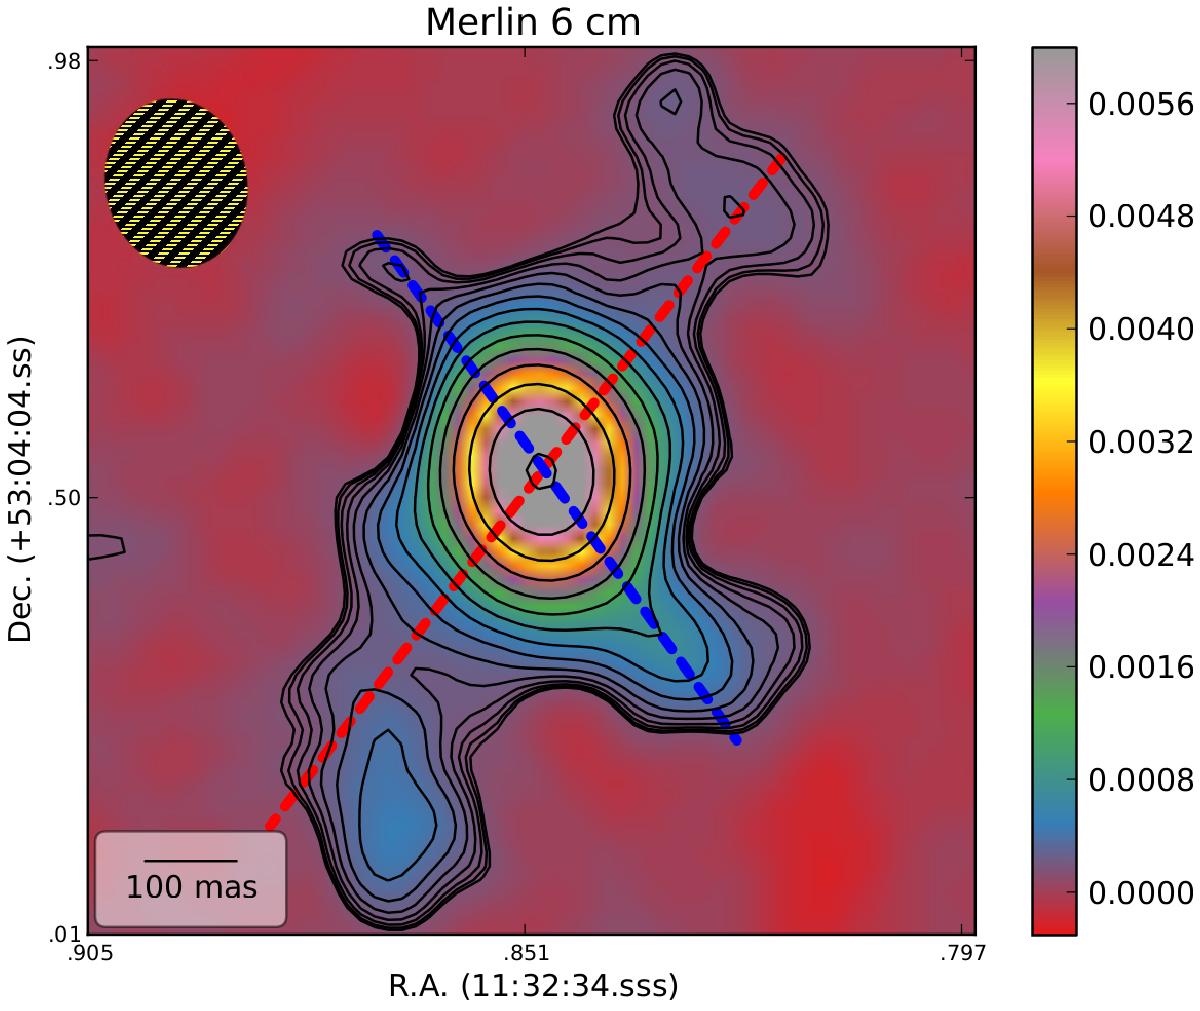
e-Merlin 6 cm radio map. The outer contours are set to ~4σ above the background where the flux is ~2 orders of magnitude less than the peak flux. The third inner contour is ~40−50% of the peak flux. The red and blue dashed lines represent the position angle of the SE–NW and the NE–SW candidate small-scale bipolar extended structures, respectively. The beam is shown in the upper left corner.
Current usage metrics show cumulative count of Article Views (full-text article views including HTML views, PDF and ePub downloads, according to the available data) and Abstracts Views on Vision4Press platform.
Data correspond to usage on the plateform after 2015. The current usage metrics is available 48-96 hours after online publication and is updated daily on week days.
Initial download of the metrics may take a while.