Fig. 14
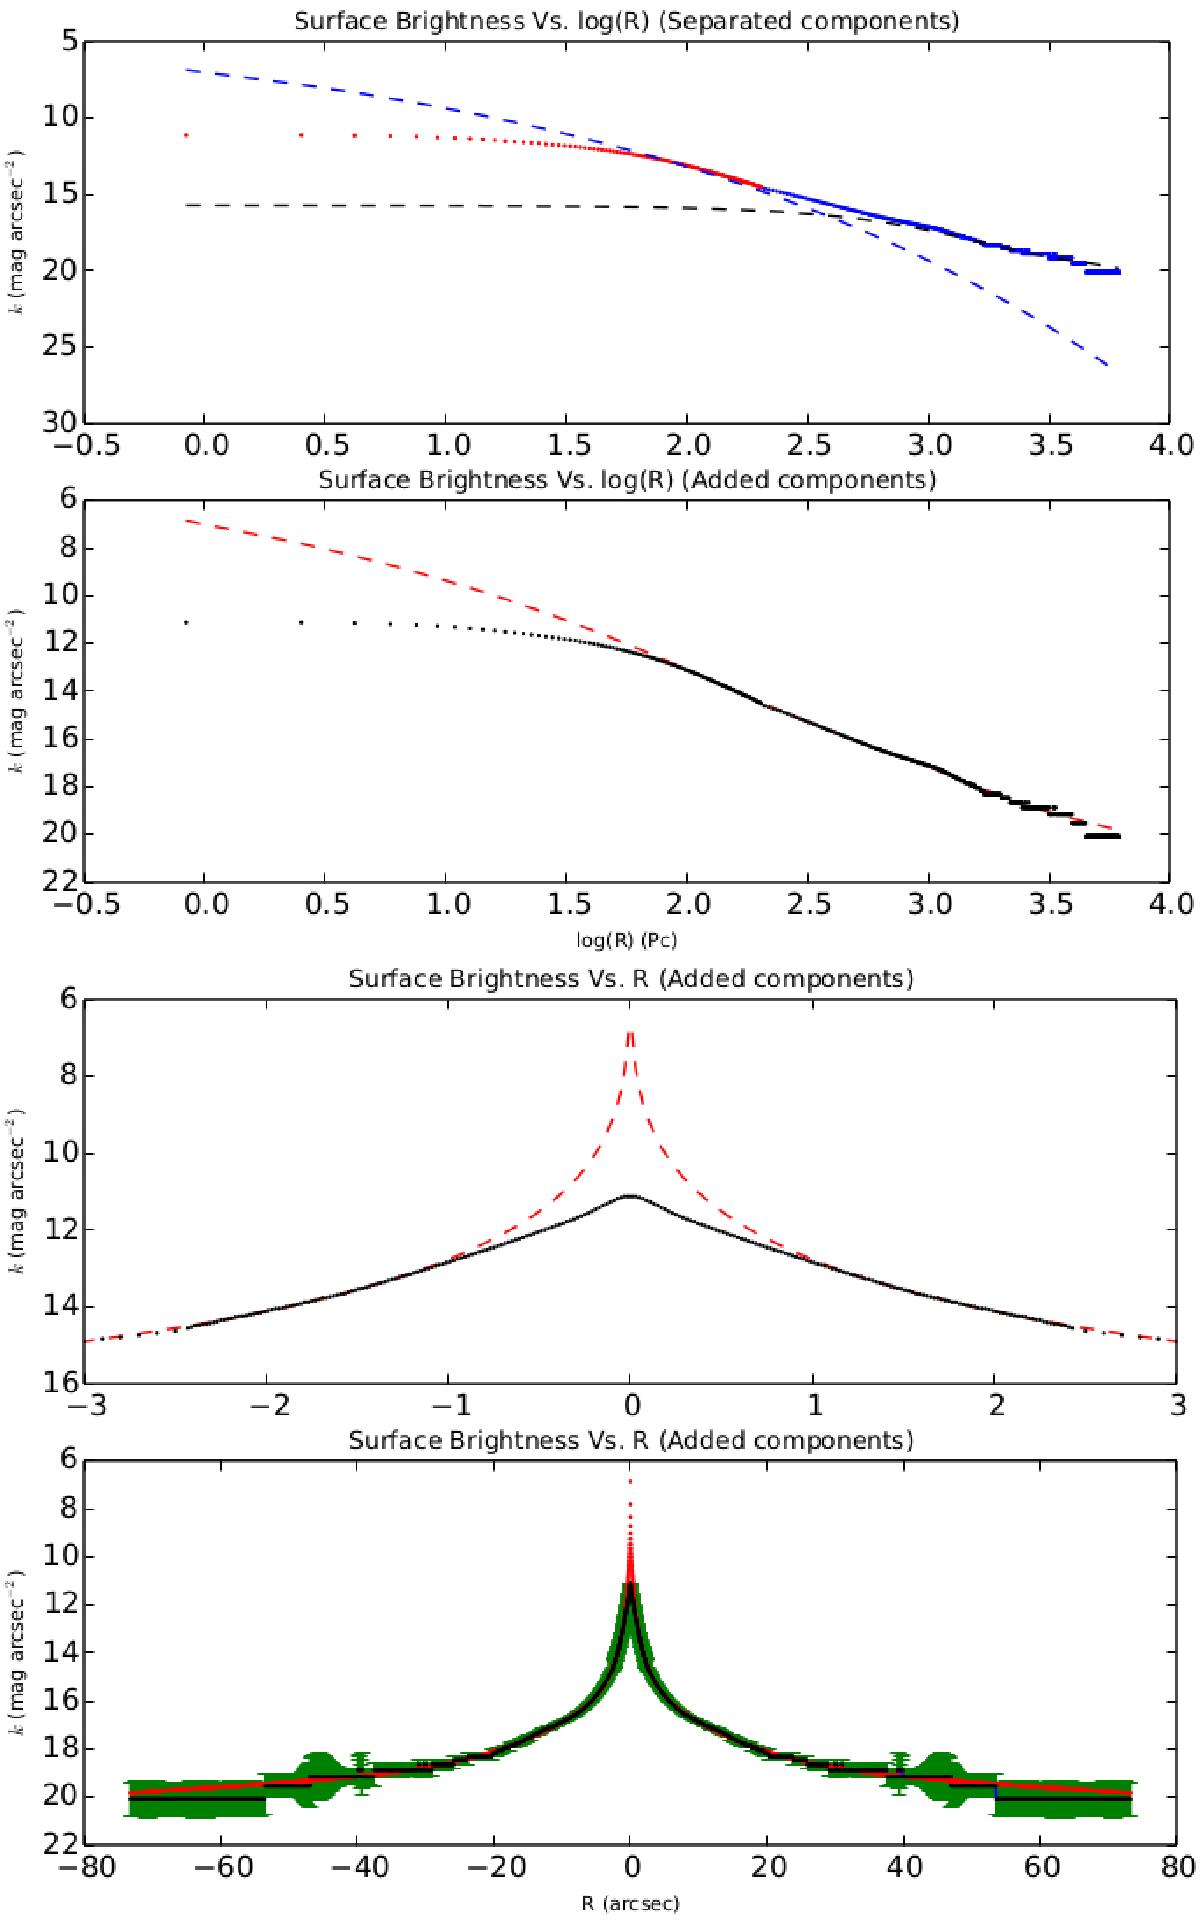
First figure: surface brightness in the KS band versus log (R) in pc. The blue dashed line represents the inwardly extrapolated Sersic profile of the bulge, while the black dashed line represents the dual exponential disk profile. The blue points represent the 2MASS KS data, while red points represent our Subaru KS data. Second figure: Same as the first figure, but with the different components added. Here the red dashed line represents the fitted model, whereas the black points represent the complete joined data set. Third figure: surface brightness in the KS band versus R (in arcsec) of the innermost ~3 arcsec. The red dashed line represents the fitted model, while black points represent (up to ~2.5 arcsec) our Subaru KS data. Fourth figure: same as the third figure, but plotted for the complete data range (~70 arcsec). The green lines represent the uncertainties of the data points.
Current usage metrics show cumulative count of Article Views (full-text article views including HTML views, PDF and ePub downloads, according to the available data) and Abstracts Views on Vision4Press platform.
Data correspond to usage on the plateform after 2015. The current usage metrics is available 48-96 hours after online publication and is updated daily on week days.
Initial download of the metrics may take a while.