| Issue |
A&A
Volume 578, June 2015
|
|
|---|---|---|
| Article Number | L8 | |
| Number of page(s) | 6 | |
| Section | Letters | |
| DOI | https://doi.org/10.1051/0004-6361/201526041 | |
| Published online | 11 June 2015 | |
Very Large Telescope observations of Gomez’s Hamburger: Insights into a young protoplanet candidate⋆,⋆⋆
1 Université de Toulouse, UPS-OMP, IRAP, 31028 Toulouse, France
2 CNRS, IRAP, 9 Av. colonel Roche, BP 44346, 31028 Toulouse Cedex 4, France
3 Observatorio Astronómico Nacional, Apdo. 112, 28803 Alcalá de Henares, Madrid, Spain
4 Service d’Astrophysique CEA Saclay, France
5 Institut d’Astrophysique Spatiale, Paris-Sud 11, 91405 Orsay, France
6 Millenium Nucleus “Protoplanetary Disks in ALMA Early Science”, Universidad de Chile, Casilla 36-D, Santiago, Chile
7 UMI-FCA 3386, CNRS/INSU, Casilla 36-D, Santiago, Chile
8 Univ. Grenoble Alpes, IPAG, 38000 Grenoble, France,
and CNRS, IPAG, 38000 Grenoble, France
9 Instituto de Ciencia de Materiales de Madrid (ICMM-CSIC), Sor Juana Ines de la Cruz 3, 28049 Cantoblanco, Madrid, Spain
10 Centro de Astrobiología, CSIC-INTA, Ctra. de Torrejón a Ajalvir km 4, 28850 Madrid, Spain
11 Leiden Observatory, Leiden University, Niels Bohrweg 2, 2333 CA Leiden, The Netherlands
Received: 6 March 2015
Accepted: 19 May 2015
Abstract
Planets are thought to form in the gas and dust disks around young stars. In particular, it has been proposed that giant planets can form through the gravitational instability of massive extended disks around intermediate-mass stars. However, we still lack direct observations to constrain this mechanism. We have spatially resolved the 8.6 and 11.2 μm emission of a massive protoplanetary disk seen edge on around an A star, Gomez’s Hamburger (GoHam), using VISIR at the Very Large Telescope. A compact region situated at a projected distance of 350 ± 50 AU south of the central star is found to have a reduced emission. This asymmetry is fully consistent with the presence of a cold density structure, or clump, identified in earlier CO observations, and we derive physical characteristics consistent with those observations: a mass of 0.8−11.4 Jupiter masses (for a dust-to-gas mass ratio of 0.01), a radius of about 102 astronomical units, and a local density of about 107 cm-3. Based on this evidence, we argue that this clump, which we call GoHam b, is a promising candidate for a young protoplanet formed by gravitational instability that might be representative of the precursors of massive planets observed around A stars, such as HR 8799 or Beta pictoris. More detailed studies at high angular resolution are needed to better constrain the physical properties of this object to confirm this proposal.
Key words: protoplanetary disks / planets and satellites: formation / infrared: planetary systems / submillimeter: planetary systems / methods: observational
Based on observations collected at the European Southern Observatory, Chile under program ID 385.C-0762A.
Appendices are available in electronic form at http://www.aanda.org
© ESO, 2015
1. Introduction
The disks present around low- to intermediate-mass young stellar objects have gained much interest in recent years since they are believed to be the cradles of planetary formation. In this context, the study of their dust and gas content is crucial because dust is the primary reservoir of matter available to form telluric planets and the cores of giant planets. The recent discoveries by direct-imaging techniques of over 20 giant planets with orbital separations from 10 to a few hundred AU suggest that giant planets can form in the outer regions of protoplanetary disks (e.g., Beta pictoris and HR 8799 with planets at estimated separations between ~9 and 70 AU, respectively; Lagrange et al. 2010; Marois et al. 2010). In these regions disks can become unstable to their own gravity and form clumps of molecular gas that can continue to accrete mass and later evolve to become planets (or brown dwarfs). This gravitational instability (GI, e.g., Boss 1997) scenario is a possible channel for planet formation around A or B stars, but direct observational evidence is scarce. One possible example of a candidate protoplanet that might have been formed by GI was recently provided by Quanz et al. (2013, 2014), who identified a source in the disk around the Herbig star HD 100456 at a projected separation of ~50 AU. The mass of this source could not be derived directly, but is at most a few Jupiter masses (Boccaletti et al. 2013; Currie et al. 2014).
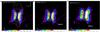 |
Fig. 1 a) VLT-VISIR 8.6 μm (PAH1 filter) image of GoHam in color, the scale is in Jy/arcsec2. In contours: velocity-integrated 12CO(2−1) emission observed with the SMA from Bujarrabal et al. (2008, 2009). b) VLT-VISIR 8.6 μm (PAH1 filter, same as left panel) in color. Contours show the emission of 13CO (2−1) emanating from from GoHam b after subtracting the best-fit disk model (see Bujarrabal et al. 2009 for details). This region also corresponds to the local decrease of mid-IR emission seen in the VISIR image. The position of the cross cut used to extract the profiles shown in Fig. 3 is shown in green. c) VLT-VISIR 11.2 μm (PAH2 filter) image of GoHam in color, the scale is in Jy/arcsec2. Contours as in b). |
Gomez’s Hamburger (IRAS 18059-3211; hereafter GoHam) is an A star surrounded by a dusty disk. When first studied by Ruiz et al. (1987), it was classified as an evolved object (post-AGB star) on the basis of its spectral type and the presence of dust. However, all recent studies (Bujarrabal et al. 2008, 2009; Wood et al. 2008; De Beck et al. 2010) clearly indicate that it is a young A star surrounded by a protoplanetary disk. The distance to GoHam is not known precisely, but a value d = 250 ± 50 pc is required to satisfy all the existing observational constraints (Wood et al. 2008; Berné et al. 2009; Bujarrabal et al. 2009). We here adopt this value with the uncertainty. GoHam presents intense CO emission; SMA maps of 12CO and 13CO J = 2 − 1 lines very clearly show the Keplerian dynamics of the disk (Bujarrabal et al. 2008, 2009). The lower limit for the disk mass derived from these CO observations is of about 10-2M⊙, while the mass upper limit is estimated to be ~0.3 M⊙ based on dust emission (Bujarrabal et al. 2008; Wood et al. 2008) and assuming an interstellar dust-to-gas mass ratio of 0.01. Overall, GoHam appears to be similar to isolated Herbig stars (Meeus et al. 2001) such as HD 100546 and HD 169142, in a more massive version, but still smaller than the recently discovered disk around CAHA J23056+6016 (Quanz et al. 2010). GoHam is seen almost perfectly edge on, which offers the possibility to study this class of objects from a new and complementary perspective, in particular, with improved constraints on the vertical structure of the disk. Using a radiative transfer model to predict line emission from a Keplerian flaring disk, Bujarrabal et al. (2009) derived a large-scale description of the physical conditions throughout the disk. After subtracting the model that best fit the observations, these authors found a significant residual emission situated about 1.3′′ (330 ± 70 AU) south of the central star, which they identified as a gas condensation, containing a mass between one and few times that of Jupiter. Hence, this source was proposed to be a candidate protoplanet, possibly resulting from a GI collpapse.
GoHam shows bright polycyclic aromatic hydrocarbon (PAH) emission (Wood et al. 2008; Berné et al. 2009), as often observed toward Herbie Ae/Be stars (Acke & van den Ancker 2004; Habart et al. 2004). In this Letter, we present high angular resolution imaging of GoHam obtained in the PAH filters with VISIR at the Very Large Telescope, which provides a new view of the vertical structure of the disk.
2. Observational results
2.1. Observations
GoHam was observed with VISIR at the Very Large Telescope. We obtained three exposures in chopping-nodding in the PAH1 filter (8.6 μm) on April 22−23, 2010, and two exposures in the PAH2 filter (11.3 μm) on August 29 and September 01, 2010. The total integration time was 1552 s for the PAH1 filter and 1702 s for the PAH2 filter. Observations in the PAH1 filter were conducted with an exceptional seeing of 0.5′′, while the observations in the PAH2 filter were conducted with a seeing ranging between 1.0 and 1.6′′. Calibration was achieved using the ESO-provided observation of the standard star HD 177716. In addition, we used the Submillimeter Array (SMA) data for the 12CO(2−1) and 13CO(2−1) lines observed in June 2006 that were presented in Bujarrabal et al. (2009) with a beam size of ~ 1.1 × 1.5′′. The VISIR and part of the SMA observations are shown in Fig. 1.
2.2. Disk morphology as seen with PAHs
The images obtained in the PAH1 and PAH2 filters are shown in Fig. 1. The observed mid-IR emission results from UV-excited PAHs (Tielens 2008). The PAH1 filter covers part of the C-C vibration at 7.7 μm and the C-H vibration at 8.6 μm, while the PAH2 filter mainly covers the C-H vibration at 11.3 μm (see Fig. A.1). The edge-on disk is clearly resolved, and both faces are separated by a dark lane, where the disk becomes optically thick to its own mid-IR light. This lane is 1.5′′ broad, that is, 375 ± 75 AU, larger than what can be observed for any other disk in the mid-IR and indicating the massive nature of GoHam. Both images show an asymmetry in the fluxes found on the western and eastern faces of the disk caused by the slight inclination of the disk to the line of sight (~ 5 − 10°). The radial extent of the PAH emission (RPAH ~ 3′′, i.e., 750 ± 150 AU) is much smaller than the radial extent observed for the molecular gas in CO (2−1) emission (Rmol ~ 6.6′′, i.e., 1650 ± 350 AU). On the other hand, the PAH emission extends to higher altitudes (HPAH ~ 770 ± 150 AU) above the disk than the CO emission (Hmol ~ 450 ± 90 AU, see Bujarrabal et al. 2009). In photodissociation regions, PAH molecules mainly emit in the warm atomic gas, as evidenced, for instance, by the strong spatial correlation with the [CII] fine-structure line (Joblin et al. 2010). Therefore, and since they are dynamically coupled to the gas, PAHs can be considered as a tracer of the warm (a few 100 K, Joblin et al. 2010) external layers of protoplanetary disks. This warm gas is therefore expected to have a higher scale height than the cold molecular gas traced by low-J CO emission. The proposed morphology is shown in Fig. 2.
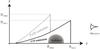 |
Fig. 2 Schematic representation of the different components of GoHam’s disk with the main geometrical parameters. |
2.3. Recovery of the GoHam b condensation in absorption in the mid-IR
Since the PAH emission arises from the surface layers of the flared disk, this PAH emission has to traverse the disk before reaching us (Fig. 2). At high altitudes the crossed disk slice is thin, and PAH emission is marginally absorbed by the disk. On the other hand, at lower altitudes the PAH emission has to traverse part of the disk and is largely absorbed. Absorption at mid-infrared wavelengths is caused by the strong absorption band at 9.7 μm that is a result of the silicates in dust grains. The beam-averaged mid-infrared spectrum of GoHam obtained with Spitzer is shown in Fig. A.1. We fit this spectrum using the PAHTAT toolbox1, which allows adjusting an observed spectrum using a set of PAH template spectra, an underlying continuum, and a correction for the extinction that is due to silicates (see Pilleri et al. 2012 for details). The results of this procedure are shown in Fig. A.1 and demonstrate that the average spectrum of GoHam is indeed affected by absorption of silicates, with an optical depth of about 0.4−0.5 at the wavelengths of the VISIR filters.
After subtracting their radiative transfer model, Bujarrabal et al. (2009) found a residual gas emission in the disk, identified as a condensation of molecular gas. Panels b and c of Fig. 1 show this residual 13CO emission tracing the gas condensation, overlaid on the PAH1 and PAH2 images. The condensation clearly spatially corresponds to a local decrease of PAH emission, where the disk is typically less bright by 30% than at the symmetric region in the north. This asymmetry is clearly visible in the profile (Fig. 3) obtained along the cross cut shown in Fig. 1 and seems to match the position of the CO clump. Overall, we conclude that we probably detected the condensation reported by Bujarrabal et al. (2009) as absorption in the PAH1 and PAH2 filters of VISIR2. From an observer’s point of view, this condensation is therefore similar to infrared dark clouds seen against bright mid-IR backgrounds, which are believed to be pre-stellar cores embedded in molecular clouds (Rathborne et al. 2006). GoHam b can be seen as such a core, but embedded in a molecular disk. In the following, we refer to this condensation as GoHam b, following the nomenclature adopted by Quanz et al. (2013).
3. Physical properties of GoHam b
In the VISIR images (Fig. 1), GoHam b corresponds to a region of increased absorption. This can be understood as resulting from a localized increase of the dust and gas column density at the position where Bujarrabal et al. (2009) detected an excess of CO emission. To gain more insight into the properties of GoHam b, we modeled the mid-IR and 13CO emission profiles shown in Fig. 3 with a simple parametric model (see Appendix B). The model is adjusted so as to simultaneously reproduce the 13CO profile and obtain a mid-IR profile corrected for absorption that is symmetric (see Fig. 3). With this model, we derive a radius of GoHam b of 155 ± 31 AU, a density nb = 7.0 ± 1.4 × 106 cm-3 , and a mass Mb = 0.95 ± 0.19MJup. If the dust cross-section per H atom is divided by a factor of 10, as can be the case for protoplanetary disks (Andrews et al. 2009; D’Alessio et al. 2001), then the density and mass are higher by one order of magnitude (i.e., Mb = 9.5 ± 1.9MJup , and nb = 7.0 ± 1.4 × 107 cm-3). The final mass range is therefore Mb = 0.8 − 11.4MJup, which agrees well with earlier estimates by Bujarrabal et al. (2009), who found masses ranging between 1 and a few Jupiter masses.
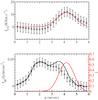 |
Fig. 3 Emission profiles obtained along the cut shown in Fig. 1. The upper panel presents the observed 13CO (2−1) emission of GoHam b (circles with error bars) and the fit obtained with the model (ICO see Appendix B) in red. The lower panel shows the observed mid-IR emission profile (IIR) for the same cut (circles with error bars) and the mid-IR profile obtained after correction for extinction due to GoHam b ( |

4. GoHam b: a candidate protoplanet?
4.1. Comparison to other substructures seen in disk
In the recent years, high angular resolution observations have revealed asymmetric features inside protoplanetary disks. In this context, it is interesting to compare the condensation seen in GoHam to other structures observed in disks. Spiral arms have been observed in several disks (e.g., Muto et al. 2012; Casassus et al. 2012; Rameau et al. 2012; Tang et al. 2012; Grady et al. 2013; Boccaletti et al. 2013; Avenhaus et al. 2014), but it seems difficult to understand GoHam b as a spiral arm since it is a unique, unresolved, dense, and isolated source in the disk, while spiral arms are generally extended and/or multiple and do not necessarily emanate from dense regions. GoHam b could be an arc or horseshoe structure, as have been observed in Oph-IRS 48 (van der Marel et al. 2013; Bruderer et al. 2014), HD 142527 (Casassus et al. 2013), HD 135344B, and SR 21 (Pérez et al. 2014), for instance. However, this type of asymmetries mostly concerns the emission of dust, whereas here, both dust (as traced by the 8.6 μm optical depth or the millimeter emission, see Fig. 1 in Bujarrabal et al. 2008) and gas column densities are higher toward GoHam b. While we cannot rule out hypothetical horseshoe made of both gas and dust, there is to our knowledge no clear observational evidence for this phenomenon so far.
An asymmetry in the mid-IR PAH emission of the edge-on disk around the Herbig Star PDS 144N was reported by Perrin et al. (2006) and appears to be very similar to the asymmetry observed here. Unfortunately, there are no spatially resolved observations of the molecular emission of this disk that would attest to the similarity of this structure with GoHam b.
Near-IR observations of scattered light from edge-on disks are generally characterized by asymmetric disk structures that are often attributed to illumination effects. The most striking example of such an asymmetry is observed in the HH 30 disk (Stapelfeldt et al. 1999). The fluorescence of UV-excited PAHs at IR wavelengths dominates the emission, hence UV illumination effects could also create the observed asymmetry. While we cannot exclude this possibility, the scenario of illumination effects cannot explain the coincidence of the mid-IR emission decrease with the position of the molecular emission. We also note that illumination effects are usually variable in time in such systems, and the Hubble Space Telescope images of GoHam obtained in the visible and near-IR do not show evidence of this variability (see images in Bujarrabal et al. 2008 and Wood et al. 2008).
4.2. Comparison to candidate protoplanets
Recently, Quanz et al. (2013) identified a point source in the disk around HD 100546, a Herbig star of B9 spectral type. These authors suggested that this source might represent early stages of planetary formation and called the object HD 100546 b. This source shares similarities with GoHam b since it appears as an isolated clump inside a massive disk around an intermediate-mass star. The mass of HD 100546 b is only poorly constrained, but is estimated to range between 1 and 15 MJup (Quanz et al. 2013; Boccaletti et al. 2013; Currie et al. 2014), which is similar to GoHam b. However, GoHam b is situated at a much larger distance (330 ± 70 AU) from its host star than HD 100546 b (~50 AU). In addition, Quanz et al. (2014) derived an effective temperature of ~1000 K for HD 100546 b, while GoHam b appears to be a rather cold object (at most a few tens of K according to the CO emission). While the orbit of GoHam b may seem large, it is not exceptional in the context of the recent discovery of a 5 MJup planet separated from its host star HD 106906 by 650 AU (Bailey et al. 2014). Finally, it should be noted that Dutrey et al. (2014) also reported a clump of molecular gas at the outer edge of the disk ring around GG Tau A, at a radius of ~250 AU. Although this latter clump is poorly studied, it appears to be quite similar to GoHam b.
4.3. A young protoplanet resulting from a GI?
Since both HD 100546 b and GoHam b are found at large radii and inside massive disks, a natural interpretation for their origin is the gravitational instability. Hydrodynamical models indicate that GI clumps have a typical size of ~ 0.4 × H (Boley et al. 2010), where H is the disk scale height inferred from the midplane temperature and the angular velocity. Assuming a minimal orbit of 350 ± 50 AU for the clump and using the disk parameters in Table B.1 yields aminimum radius of r = 0.4H = 30 ± 5 AU, on the same order of magnitude as the value derived from the model: rb = 135 ± 15 AU (see Appendix B). Using Eq. (12) of Boley et al. (2010), we derive a theoretical mass for a GI clump at 350 ± 50 AU of 5.5 ± 1MJup, which falls in the mass range derived in Sect. 3 of 0.8 − 11.4MJup. We can estimate the midplane density nI required for the disk to be unstable to the GI at the radius corresponding to the angular separation at which GoHam b is observed, using the classical Toomre Q parameter (Toomre 1964). For the physical conditions in Table B.1, we find that the disk is unstable, that is, that Q ≲ 2 for a density higher
than nI ~ 2 × 108 cm-3, in agreement with the observed lower limit n> 106 cm-3 derived from CO observations (Table B.1).
5. Conclusion
Overall, GoHam b consists of a small (of about 100 AU) and dense (of about 107 cm-3) structure of molecular gas and dust, with a mass of 0.8 − 11.4MJup (for a dust-to-gas mass ratio of 0.01). These results are fully consistent with those of Bujarrabal et al. (2009), which in addition have shown that the position of GoHam b corresponds to a modification of the Keplerian velocity field. Altogether, this evidence indicates that GoHam b is a promising candidate of a protoplanet formed by gravitational instability. Additional studies, in particular at higher angular resolution and with other tracers using ALMA coupled to detailed 3D radiative transfer modeling, are needed to confirm this hypothesis and to rule out other possibilities (such as the presence of an arc of gas and dust).
Online material
Appendix A: Supplementary figure
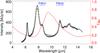 |
Fig. A.1 Spitzer IRS spectrum of GoHam (continuous black line) and fit (diamonds) using the PAHTAT model. The mid-IR optical depth derived with the model is shown in red. The positions and bandwidths of the VISIR PAH1 and PAH2 filters are indicated. This spectrum includes GoHam a and b, the absorption is dominated by the disk mid-plane. |
Appendix B: Model
Appendix B.1: Model description
We modeled GoHam b as a spherical clump of constant density nb and radius rb. The presence of this clump results in a localized excess of column density with a profile along the cut as a function of position p (Fig. 3) of parabolic form:  (B.1)where pb is the position of GoHam b in the cross cut, that is, 4.25′′. The resulting mid-IR optical depth τb due to GoHam b is then
  (B.2)where Cext is the dust cross-section per unit of H atom. The mid-IR emission along the cut, corrected for the extinction by GoHam b, can then be recovered by
  (B.3)where IIR(p) is the observed mid-IR emission profile shown in Fig. 3. In addition, we computed the emission in the 13CO(2−1) line as a function of p:
  (B.4)where Δv is the width of the line measured to be 1.7 km s-1, Ωff is the beam-filling factor equal to
  , where a and b are the minor and major axis of the beam, that is, a = 1.14′′ and b = 1.52′′. K is a Gaussian kernel of width equal to b, which is the angular resolution along the cut shown in Fig. 3 (since the major axis of the beam is almost aligned north-south, see Bujarrabal et al. 2009, as is our cross cut).
  is the brightness temperature of the 13CO(2−1) line that is equal to zero for p<pb − rb and p>pb + rb. For the other values of p, the brightness is equal to (optically thick line)
  (B.5)where Tex is the excitation temperature, which we fixed at 16 K, that is, the temperature of the disk midplane derived by Bujarrabal et al. (2009). Tex could be higher than this value in the internal parts of the clump, but this is not critical in the estimation of rb , which is a function of the square root of Tex. Overall, the parameters of the model are the density of GoHam b nb, the radius of GoHam b rb, and the dust cross-section Cext. For interstellar dust, the cross section is typically Cext = 2.5 × 10⁻²³ cm2 per H atom at 8.6 and 11.2 μm (Weingartner & Draine 2001). In disks, however, this value is expected to decrease significantly due to grain growth, typically by a factor of 10 in the mid-IR (Andrews et al. 2009; D’Alessio et al. 2001). We therefore considered these two extreme cases and their effects on the parameters derived by the model.
Appendix B.2: Adjustment of the parameters nb and rb
First, rb was adjusted so as to reproduce the observed emission profile of ICO as shown in Fig. 3. Once the value of rb is adjusted, the following step consists of adjusting the parameter nb so as to obtain a symmetric  profile, which is what is expected in a disk without any clump. The result of this procedure is shown in Fig. 3. From the adjusted values of nb and rb, we can derive the clump mass,
  (B.6)where μ is the mean molecular weight and mH the proton mass. The parameters used in the model and those derived from the fit for the two values of Cext are summarized in Table B.2.
Main physical parameters of the GoHam disk.
Main physical parameters of the GoHam b candidate protoplanet in the model.
Note that, although the SMA and VISIR observations are separated by several years, the source has not moved. This is consistent with the orbital period, which is longer than 200 years for a clump on an orbit that is at least 350 AU.
Acknowledgments
This work was supported by the CNRS program “Physique et Chimie du Milieu Interstellaire” (PCMI). P. Pilleri acknowledges financial support from the Centre National d’Études Spatiales (CNES).
References
- Acke, B., & van den Ancker, M. E. 2004, A&A, 426, 151 [NASA ADS] [CrossRef] [EDP Sciences] [Google Scholar]
- Andrews, S. M., Wilner, D. J., Hughes, A. M., Qi, C., & Dullemond, C. P. 2009, ApJ, 700, 1502 [NASA ADS] [CrossRef] [Google Scholar]
- Avenhaus, H., Quanz, S. P., Schmid, H. M., et al. 2014, ApJ, 781, 87 [NASA ADS] [CrossRef] [Google Scholar]
- Bailey, V., Meshkat, T., Reiter, M., et al. 2014, ApJ, 780, L4 [Google Scholar]
- Berné, O., Joblin, C., Fuente, A., & Ménard, F. 2009, A&A, 495, 827 [NASA ADS] [CrossRef] [EDP Sciences] [Google Scholar]
- Boccaletti, A., Pantin, E., Lagrange, A.-M., et al. 2013, A&A, 560, A20 [NASA ADS] [CrossRef] [EDP Sciences] [Google Scholar]
- Boley, A. C., Hayfield, T., Mayer, L., & Durisen, R. H. 2010, Icarus, 207, 509 [NASA ADS] [CrossRef] [Google Scholar]
- Boss, A. P. 1997, Science, 276, 1836 [NASA ADS] [CrossRef] [Google Scholar]
- Bruderer, S., van der Marel, N., van Dishoeck, E. F., & van Kempen, T. A. 2014, A&A, 562, A26 [NASA ADS] [CrossRef] [EDP Sciences] [Google Scholar]
- Bujarrabal, V., Young, K., & Fong, D. 2008, A&A, 483, 839 [NASA ADS] [CrossRef] [EDP Sciences] [Google Scholar]
- Bujarrabal, V., Young, K., & Castro-Carrizo, A. 2009, A&A, 500, 1077 [NASA ADS] [CrossRef] [EDP Sciences] [Google Scholar]
- Casassus, S., Perez, M. S., Jordán, A., et al. 2012, ApJ, 754, L31 [NASA ADS] [CrossRef] [Google Scholar]
- Casassus, S., van der Plas, G., M, S. P., et al. 2013, Nature, 493, 191 [NASA ADS] [CrossRef] [Google Scholar]
- Currie, T., Muto, T., Kudo, T., et al. 2014, ApJ, 796, L30 [NASA ADS] [CrossRef] [Google Scholar]
- D’Alessio, P., Calvet, N., & Hartmann, L. 2001, ApJ, 553, 321 [NASA ADS] [CrossRef] [Google Scholar]
- De Beck, E., Decin, L., de Koter, A., et al. 2010, A&A, 523, A18 [NASA ADS] [CrossRef] [EDP Sciences] [Google Scholar]
- Dutrey, A., di Folco, E., Guilloteau, S., et al. 2014, Nature, 514, 600 [NASA ADS] [CrossRef] [Google Scholar]
- Grady, C. A., Muto, T., Hashimoto, J., et al. 2013, ApJ, 762, 48 [NASA ADS] [CrossRef] [Google Scholar]
- Habart, E., Natta, A., & Krügel, E. 2004, A&A, 427, 179 [NASA ADS] [CrossRef] [EDP Sciences] [Google Scholar]
- Joblin, C., Pilleri, P., Montillaud, J., et al. 2010, A&A, 521, L25 [NASA ADS] [CrossRef] [EDP Sciences] [Google Scholar]
- Lagrange, A.-M., Bonnefoy, M., Chauvin, G., et al. 2010, Science, 329, 57 [NASA ADS] [CrossRef] [PubMed] [Google Scholar]
- Marois, C., Zuckerman, B., Konopacky, Q. M., Macintosh, B., & Barman, T. 2010, Nature, 468, 1080 [NASA ADS] [CrossRef] [PubMed] [Google Scholar]
- Meeus, G., Waters, L. B. F. M., Bouwman, J., et al. 2001, A&A, 365, 476 [NASA ADS] [CrossRef] [EDP Sciences] [Google Scholar]
- Muto, T., Grady, C. A., Hashimoto, J., et al. 2012, ApJ, 748, L22 [NASA ADS] [CrossRef] [Google Scholar]
- Pérez, L. M., Isella, A., Carpenter, J. M., & Chandler, C. J. 2014, ApJ, 783, L13 [NASA ADS] [CrossRef] [Google Scholar]
- Perrin, M. D., Duchêne, G., Kalas, P., & Graham, J. R. 2006, ApJ, 645, 1272 [NASA ADS] [CrossRef] [Google Scholar]
- Pilleri, P., Montillaud, J., Berné, O., & Joblin, C. 2012, A&A, 542, A69 [NASA ADS] [CrossRef] [EDP Sciences] [Google Scholar]
- Quanz, S. P., Beuther, H., Steinacker, J., et al. 2010, ApJ, 717, 693 [NASA ADS] [CrossRef] [Google Scholar]
- Quanz, S. P., Amara, A., Meyer, M. R., et al. 2013, ApJ, 766, L1 [NASA ADS] [CrossRef] [Google Scholar]
- Quanz, S. P., Amara, A., Meyer, M. R., et al. 2014, ApJ, submitted [arXiv:1412.5173] [Google Scholar]
- Rameau, J., Chauvin, G., Lagrange, A.-M., et al. 2012, A&A, 546, A24 [NASA ADS] [CrossRef] [EDP Sciences] [Google Scholar]
- Rathborne, J. M., Jackson, J. M., & Simon, R. 2006, ApJ, 641, 389 [NASA ADS] [CrossRef] [Google Scholar]
- Ruiz, M. T., Blanco, V., Maza, J., et al. 1987, ApJ, 316, L21 [NASA ADS] [CrossRef] [Google Scholar]
- Stapelfeldt, K. R., Watson, A. M., Krist, J. E., et al. 1999, ApJ, 516, L95 [NASA ADS] [CrossRef] [Google Scholar]
- Tang, Y.-W., Guilloteau, S., Piétu, V., et al. 2012, A&A, 547, A84 [NASA ADS] [CrossRef] [EDP Sciences] [Google Scholar]
- Tielens, A. G. G. M. 2008, ARA&A, 46, 289 [NASA ADS] [CrossRef] [EDP Sciences] [Google Scholar]
- Toomre, A. 1964, ApJ, 139, 1217 [NASA ADS] [CrossRef] [Google Scholar]
- van der Marel, N., van Dishoeck, E. F., Bruderer, S., et al. 2013, Science, 340, 1199 [NASA ADS] [CrossRef] [PubMed] [Google Scholar]
- Weingartner, J. C., & Draine, B. T. 2001, ApJ, 548, 296 [NASA ADS] [CrossRef] [Google Scholar]
- Wood, K., Whitney, B. A., Robitaille, T., & Draine, B. T. 2008, ApJ, 688, 1118 [NASA ADS] [CrossRef] [Google Scholar]
All Tables
All Figures
|
Fig. 1 a) VLT-VISIR 8.6 μm (PAH1 filter) image of GoHam in color, the scale is in Jy/arcsec2. In contours: velocity-integrated 12CO(2−1) emission observed with the SMA from Bujarrabal et al. (2008, 2009). b) VLT-VISIR 8.6 μm (PAH1 filter, same as left panel) in color. Contours show the emission of 13CO (2−1) emanating from from GoHam b after subtracting the best-fit disk model (see Bujarrabal et al. 2009 for details). This region also corresponds to the local decrease of mid-IR emission seen in the VISIR image. The position of the cross cut used to extract the profiles shown in Fig. 3 is shown in green. c) VLT-VISIR 11.2 μm (PAH2 filter) image of GoHam in color, the scale is in Jy/arcsec2. Contours as in b). |
| In the text | |
|
Fig. 2 Schematic representation of the different components of GoHam’s disk with the main geometrical parameters. |
| In the text | |
|
Fig. 3 Emission profiles obtained along the cut shown in Fig. 1. The upper panel presents the observed 13CO (2−1) emission of GoHam b (circles with error bars) and the fit obtained with the model (ICO see Appendix B) in red. The lower panel shows the observed mid-IR emission profile (IIR) for the same cut (circles with error bars) and the mid-IR profile obtained after correction for extinction due to GoHam b ( |
| In the text | |
|
Fig. A.1 Spitzer IRS spectrum of GoHam (continuous black line) and fit (diamonds) using the PAHTAT model. The mid-IR optical depth derived with the model is shown in red. The positions and bandwidths of the VISIR PAH1 and PAH2 filters are indicated. This spectrum includes GoHam a and b, the absorption is dominated by the disk mid-plane. |
| In the text | |
Current usage metrics show cumulative count of Article Views (full-text article views including HTML views, PDF and ePub downloads, according to the available data) and Abstracts Views on Vision4Press platform.
Data correspond to usage on the plateform after 2015. The current usage metrics is available 48-96 hours after online publication and is updated daily on week days.
Initial download of the metrics may take a while.