Fig. 1
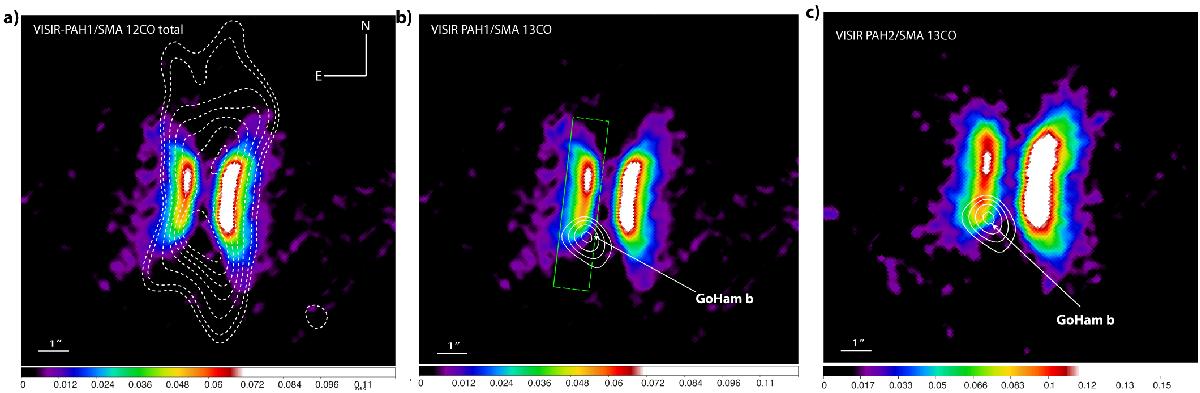
a) VLT-VISIR 8.6 μm (PAH1 filter) image of GoHam in color, the scale is in Jy/arcsec2. In contours: velocity-integrated 12CO(2−1) emission observed with the SMA from Bujarrabal et al. (2008, 2009). b) VLT-VISIR 8.6 μm (PAH1 filter, same as left panel) in color. Contours show the emission of 13CO (2−1) emanating from from GoHam b after subtracting the best-fit disk model (see Bujarrabal et al. 2009 for details). This region also corresponds to the local decrease of mid-IR emission seen in the VISIR image. The position of the cross cut used to extract the profiles shown in Fig. 3 is shown in green. c) VLT-VISIR 11.2 μm (PAH2 filter) image of GoHam in color, the scale is in Jy/arcsec2. Contours as in b).
Current usage metrics show cumulative count of Article Views (full-text article views including HTML views, PDF and ePub downloads, according to the available data) and Abstracts Views on Vision4Press platform.
Data correspond to usage on the plateform after 2015. The current usage metrics is available 48-96 hours after online publication and is updated daily on week days.
Initial download of the metrics may take a while.