Fig. 3
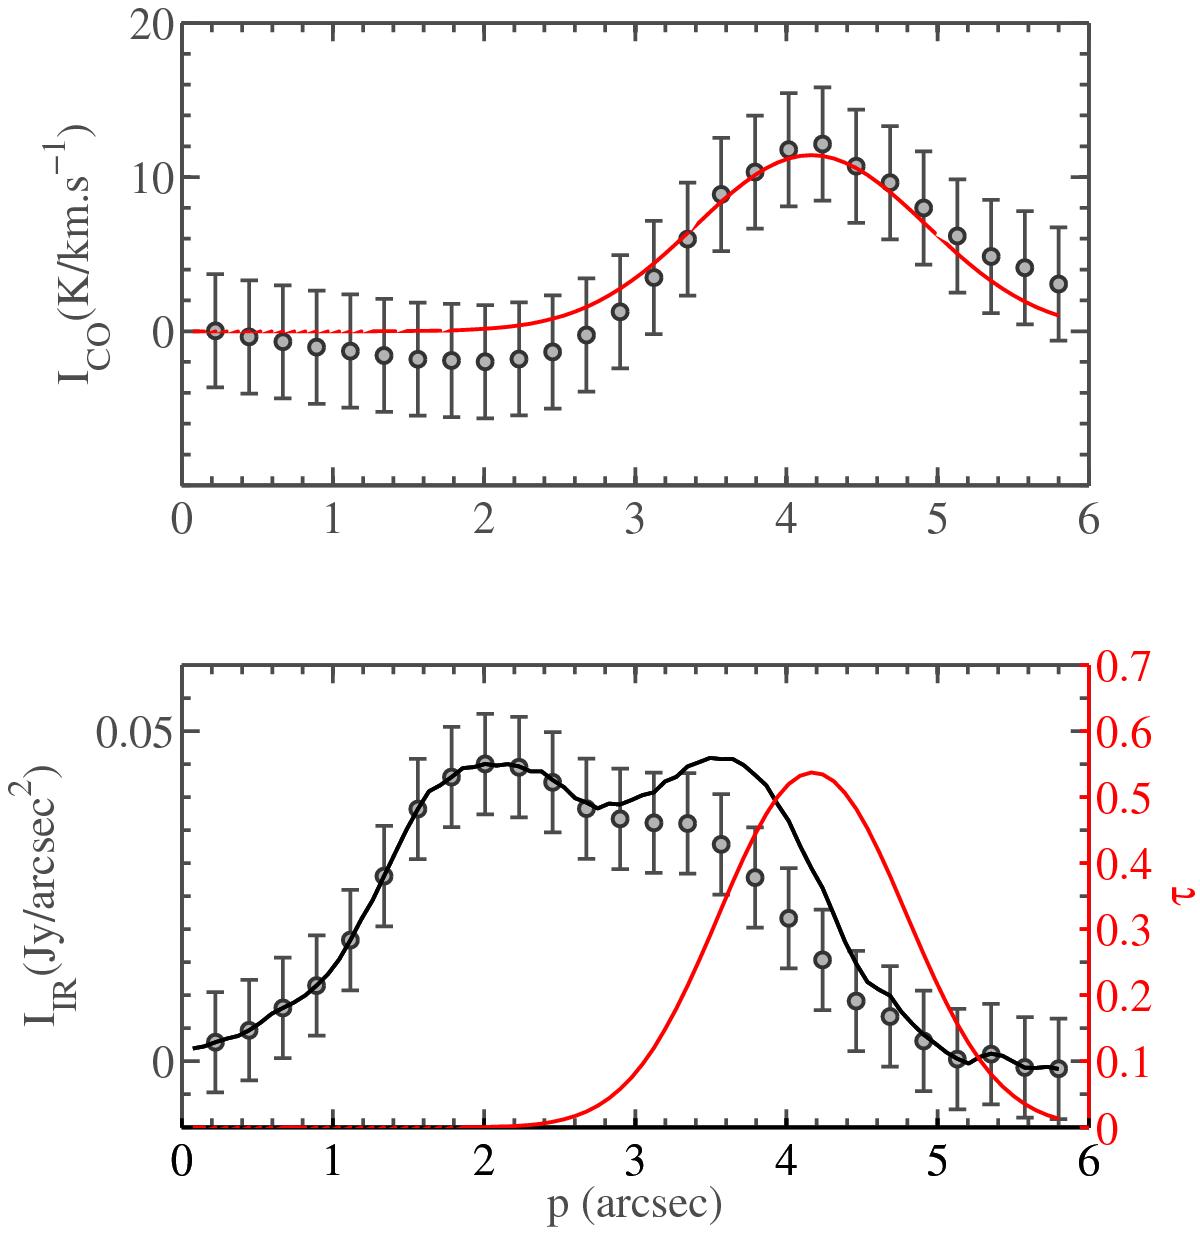
Emission profiles obtained along the cut shown in Fig. 1. The upper panel presents the observed 13CO (2−1) emission of GoHam b (circles with error bars) and the fit obtained with the model (ICO see Appendix B) in red. The lower panel shows the observed mid-IR emission profile (IIR) for the same cut (circles with error bars) and the mid-IR profile obtained after correction for extinction due to GoHam b (![]() ) in black. The red curve shows the optical depth profile τb used for this correction.
) in black. The red curve shows the optical depth profile τb used for this correction.
Current usage metrics show cumulative count of Article Views (full-text article views including HTML views, PDF and ePub downloads, according to the available data) and Abstracts Views on Vision4Press platform.
Data correspond to usage on the plateform after 2015. The current usage metrics is available 48-96 hours after online publication and is updated daily on week days.
Initial download of the metrics may take a while.