Fig. A.1
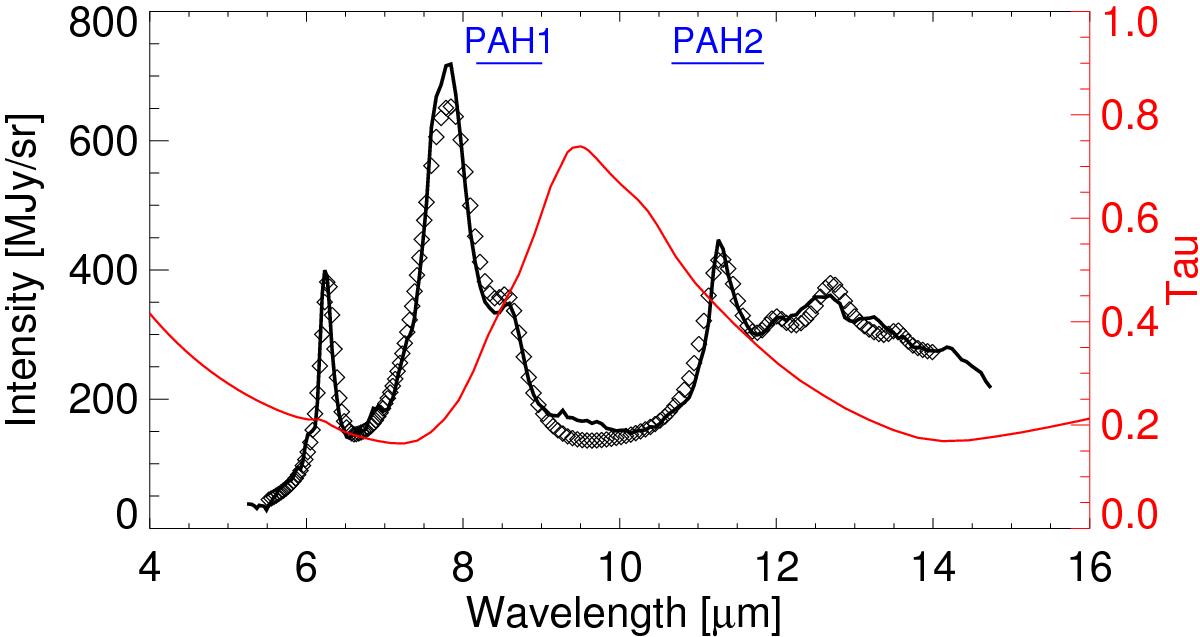
Spitzer IRS spectrum of GoHam (continuous black line) and fit (diamonds) using the PAHTAT model. The mid-IR optical depth derived with the model is shown in red. The positions and bandwidths of the VISIR PAH1 and PAH2 filters are indicated. This spectrum includes GoHam a and b, the absorption is dominated by the disk mid-plane.
Current usage metrics show cumulative count of Article Views (full-text article views including HTML views, PDF and ePub downloads, according to the available data) and Abstracts Views on Vision4Press platform.
Data correspond to usage on the plateform after 2015. The current usage metrics is available 48-96 hours after online publication and is updated daily on week days.
Initial download of the metrics may take a while.