| Issue |
A&A
Volume 578, June 2015
|
|
|---|---|---|
| Article Number | A41 | |
| Number of page(s) | 19 | |
| Section | Interstellar and circumstellar matter | |
| DOI | https://doi.org/10.1051/0004-6361/201525881 | |
| Published online | 01 June 2015 | |
High spectral and spatial resolution observations of the PDR emission in the NGC 2023 reflection nebula with SOFIA and APEX⋆,⋆⋆,⋆⋆⋆,⋆⋆⋆⋆,†
1
SOFIA-USRA, NASA Ames Research Center, MS 232-12, Building N232, Rm. 146,
PO Box 1,
Moffett Field,
CA
94035-0001,
USA
e-mail:
Goran.H.Sandell@nasa.gov
2
Tata Institute of Fundamental Research,
Homi Bhabha Road, 400005
Mumbai,
India
e-mail:
bhaswati@tifr.res.in
3
Max Planck Institut für Radioastronomie,
Auf dem Hügel 69, 53121
Bonn,
Germany
4
I. Physikalisches Institut der Universität zu Köln,
Zülpicher Straße 77,
50937
Köln,
Germany
Received: 12 February 2015
Accepted: 12 April 2015
We have mapped the NGC 2023 reflection nebula in [C ii] and CO(11−10) with the heterodyne receiver GREAT on SOFIA and obtained slightly smaller maps in 13CO(3−2), CO(3−2), CO(4−3), CO(6−5), and CO(7−6) with APEX in Chile. We use these data to probe the morphology, kinematics, and physical conditions of the C ii region, which is ionized by FUV radiation from the B2 star HD 37903. The [C ii] emission traces an ellipsoidal shell-like region at a position angle of ~−50°, and is surrounded by a hot molecular shell. In the southeast, where the C ii region expands into a dense, clumpy molecular cloud ridge, we see narrow and strong line emission from high-J CO lines, which comes from a thin, hot molecular shell surrounding the [C ii] emission. The [C ii] lines are broader and show photo evaporating gas flowing into the C ii region. Based on the strength of the [13C ii] F = 2−1 line, the [C ii] line appears to be somewhat optically thick over most of the nebula with an optical depth of a few. We model the physical conditions of the surrounding molecular cloud and the PDR emission using both RADEX and simple PDR models. The temperature of the CO emitting PDR shell is ~90−120 K, with densities of 105−106 cm-3, as deduced from RADEX modeling. Our PDR modeling indicates that the PDR layer where [C ii] emission dominates has somewhat lower densities, 104 to a few times 105 cm-3.
Key words: ISM: clouds / submillimeter: ISM / ISM: lines and bands / ISM: individual objects: NGC 2023 / ISM: molecules / photon-dominated region (PDR)
The NASA/DLR Stratospheric Observatory for Infrared Astronomy (SOFIA) is jointly operated by the Universities Space Research Association, Inc. (USRA), under NASA contract NAS2-97001, and the Deutsches SOFIA Institut (DSI) under DLR contract 50 OK 0901 to the University of Stuttgart.
The Atacama Pathfinder Experiment (APEX) is a collaboration between the Max-Planck-Institut für Radioastronomie, the European Southern Observatory, and the Onsala Space Observatory.
Herschel is an ESA space observatory with science instruments provided by European-led Principal Investigator consortia and with important participation from NASA.
Appendices are available in electronic form at http://www.aanda.org
Data cubes as FITS files are only available at the CDS via anonymous ftp to cdsarc.u-strasbg.fr (130.79.128.5) or via http://cdsarc.u-strasbg.fr/viz-bin/qcat?J/A+A/578/A41
© ESO, 2015
1. Introduction
Located at a distance of 350 pc in the L 1630 molecular cloud NGC 2023 is one of the most well-studied reflection nebulae in the whole sky. This is where the polycyclic aromatic hydrocarbon (PAH) molecules were first identified in the interstellar medium (Sellgren 1984). NGC 2023 has a favorable geometry, which makes it an almost ideal laboratory for studying the physical conditions in photon-dominated regions (PDRs). HD 37903, the B2 V star illuminating the reflection nebula, is on the near side of the molecular cloud, while the shape of the reflection nebula indicates that the cloud interface is seen largely edge-on in the southeastern part of the nebula, where it expands into a dense molecular cloud ridge.
The PDR emission from NGC 2023 has been studied extensively. Howe et al. (1991) used a Fabry-Perot spectrometer on the Kuiper Airborne observatory (KAO) to image the nebula in the 158 μm [C ii] line with a spatial resolution of 55′′, while Steiman-Cameron et al. (1997) observed the far-infrared fine structure emission lines of [OI] 63 and 145 μm, [C ii] 158 μm, and [Si II] at 35 μm with a cryogenic grating spectrometer. Jaffe et al. (1990), using ground based telescopes, studied the PDR region by observing the CO(2−1), CO(3−2), CO(7−6), and C18O(2−1) transitions and found that there was a bright ridge to the southeast of HD 37903, where the CO(7−6) emission coincides with [C ii] emission and fluorescently excited H2 emission. This ridge was resolved into a lumpy filament in the C91α recombination line by Wyrowski et al. (2000), who used the Effelsberg 100 m telescope and the VLA with an angular resolution of 11′′. The nebula has been imaged in vibrationally excited H2 emission by Gatley et al. (1987), Field et al. (1994, 1998), McCartney et al. (1999), and Martini et al. (1999), revealing bright filamentary H2 emission especially to the south and southwest. Fleming et al. (2010), Sheffer et al. (2011), and Peeters et al. (2012) used the Infrared Spectrograph (IRS) on the Spitzer Space Telescope to observe pure rotational H2 lines and PAH emission in several regions of NGC 2023 in order to compare the observed intensities with predictions from PDR models. Mookerjea et al. (2009) analyzed IRAC and MIPS images from the Spitzer Space Telescope as well as SCUBA images from the James Clerk Maxwell Telescope (JCMT). They found that HD 37903 is the most massive member of a cluster with 20−30 pre-main-sequence (PMS) stars as well as at least two young stellar objects (YSOs), MM 3 and MM 4, embedded in the southern and southeastern part of the reflection nebula.
2. Observations
2.1. [CII] and CO(11−10) with SOFIA
The [C ii] emission was mapped with the heterodyne receiver GREAT1 (Heyminck et al. 2012) onboard the Stratospheric Observatory for Infrared Astronomy (SOFIA) during three cycle 1 flights: November 1, 2013, February 4 and February 5, 2014. On all flights the GREAT L1 channel was tuned to CO(11−10) in the lower sideband. Due to a local oscillator failure the L2 mixer (targeting [C ii]) was restored to its basic science configuration for the February flights, resulting in somewhat lower beam efficiencies due to changes in the optics (see below). The flight on November 1 2013 provided excellent observing conditions at 13.1 km with system temperatures of ~2450 K for the L1 mixer and ~3000 K for L2. In February the L1 system temperatures were about the same as in November (2500−2600 K), while the system temperatures for L2 were about 3000 K. The beam efficiency, ηmb, for the November 2013 flight series was measured to be 0.67 for both channels, while it was 0.62 for L2 during the February flights. Table 1 lists rest frequencies, half power beamwidths (HPBWs) and beam efficiencies for all receiver configurations. All beam efficiencies are based on observations of Jupiter.
The whole nebula was mapped in total-power on-the-fly (OTF) mode with 1 s integration time at each dump, and 7.5′′ step size. The reference position, at +400′′, −90′′ offset from HD 37903, has some faint (a few K) [C ii] emission at ~8 km s-1, which was corrected for in the post processing. The map was built up by doing a number of small, overlapping maps. The final map size is ~6.6′ in RA and ~6.8′ in Dec, covering most of the optically visible reflection nebula. Long (5−10 min) integrations were obtained at three positions: (0′′, 0′′), (+30′′, +15′′), and (+45′′, −45′′); all measured relative to HD 37903 (α(2000.0) =  , δ(2000.0) = −02°15′32.5′′). The spectra had very good baseline stability and in most cases nothing higher than a 2nd order polynomial baseline was removed. The final map cubes were created using CLASS2 and were re-gridded to 6′′ spatial grid for both [C ii] and CO(11−10). Maps were created with several different velocity resolution by resampling the spectra to either 0.25, 0.5 and 1 km s-1, in order to get a better idea of the morphology and velocity structure of the emission. The rms noise per resolution element is ~1.6 K for the C(11−10) map and 2.5 K for [C ii], both for a velocity resolution of 0.25 km s-1.
2.2. APEX observations of CO(3−2), 13CO(3−2), CO(4−3), CO(6−5), and CO(7−6)
NGC 2023 was observed on December 1, 2013 using the FLASH+ receiver on the 12 m Atacama Pathfinder EXperiment (APEX) telescope, located at Llano de Chajnantor in the Atacama desert of Chile (Güsten et al. 2006). FLASH+ is a dual channel heterodyne SIS receiver operating simultaneously on orthogonal polarizations in the 345 GHz and in the 460 GHz atmospheric windows (Klein et al. 2014). Both bands employ state-of-the-art sideband separating SIS mixers. The mixers provide large tuning ranges enabling simultaneous observations of 13CO and 12CO(3−2) in the 345 GHz window and 12CO(4−3) in the 460 GHz window. The backends are Fast Fourier Transform Spectrometers (Klein et al. 2012) with a total bandwidth of 4 GHz and 76.3 kHz frequency resolution. The observations were carried out in good observing conditions resulting in system temperatures of 150−180 K for 13CO and 12CO(3−2) and 340−380 K for 12CO(4−3), respectively. A region of 5.3′× 6.3′ was mapped in on-the fly mode with a spacing of 6′′ in RA and Dec and all scans were repeated once. The maps were created using CLASS and calibrated in Tmb using main beam efficiencies measured on Jupiter, appropriate for a somewhat extended source (see Table 1). The quality of the individual spectra were excellent and only a linear baseline was removed from the data. Map cubes were created with the same velocity resolution and on the same spatial grid as for the SOFIA GREAT observations. For a velocity resolution of 0.25 km s-1, the rms noise in the 13CO(3−2), CO (3−2) and CO(4−3) are about 0.4, 0.3, and 0.6 K, respectively.
On October 31, 2014 the same area was mapped in CO(6−5) and CO(7−6) using CHAMP+ on APEX. CHAMP+ is a dual channel 7-pixel hexagonal SIS-mixer heterodyne array with a central pixel. It works simultaneously in the 450 and 350 μm atmospheric windows (Kasemann et al. 2006). The weather conditions were excellent with precipitable water vapor (PWV) in the range 0.54 to 0.35 mm. The system temperatures for CO(6−5) were on the average ~1200 K. At the very end of the observing run the system temperatures went up to ~1600 K. For CO(7−6) the system temperatures were ~4000 K for most mixers, except for two mixers which were about 2000 K higher. Because the area covered is quite large, the field was divided into 10 overlapping subfields. Observations were done in OTF mode, sampling data every 4′′. The reference position was at −1385′′, −274′′ relative to HD 37903 and has been verified to be free of CO emission. Each field was covered twice, first scanning in RA and then in Dec, resulting in maps with fairly uniform depth except at the outskirts of the coadded map where the noise level is naturally higher. All spectra are calibrated in Tmb using main beam efficiencies measured on Jupiter (see Table 1). The pointing was checked on the nearby α Ori in the CO(6−5) line and is good to 2.5′′. For a velocity resolution of 0.25 km s-1, the rms levels are ~1.8 K and 3−3.3 K for CO(6−5) and CO(7−6), respectively.
Observing setup.
3. Results
3.1. Overall morphology
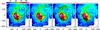 |
Fig. 1 Integrated intensity image of the [C ii] line at 158 μm in color. Contours correspond to the tracers mentioned in the individual panels. The peak intensities (and contour levels as % of peak) are 8 μm continuum image: 5306 MJy sr-1 (2% to 10% (2.5% step), 10 to 50% (5% step), 50 to 100% (20% step)), PACS 70 μm 1.32 104 MJy/sr (10%, 20%, 30%, 45%, 50% to 100% (10% step)), C91α: 7.3 × 10⁻³ Jy/beam (5%, 20%, 30%, 45%, 50% to 100% in steps of 10%), H2 S(1): 7.3 × 10⁻²⁰ W cm-2/beam (10% to 90% in steps of 10%). The C91α image is from Wyrowski et al. (2000) and the H2 S(1) image is from Gatley et al. (1987). The offsets in all figures are measured in arcseconds relative to HD 37903, which is marked by a star symbol. |
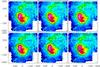 |
Fig. 2 Integrated intensity image of the [C ii] line at 158 μm in color. Contours correspond to the tracers mentioned in the individual panels. The contour levels are 13CO(3−2): (3−8), (10−13), (15−18)σ with σ = 4.2 K km s-1; CO(3−2): (3−8), 10, 15, 20, 25, 30, 32, 35, 38, 40 and 42 times σ = 5.1 K km s-1; CO(4−3): (3−8), 10, 12, 15, 18, 21, 24 times σ = 8.6 K km s-1; CO(6−5): 3, 5.5, 9.5, 11.5, 13, 15, 20, 25, 30, 35, 40 times σ = 5.4 K km s-1; CO(7−6): 4, 6, 11, 15, 18, 20, 22, 24, 26 times σ = 8.2 K km s-1; CO(11−10): 3, 5, 8, 10, 12, 15, 20, 22, 24, 26 times σ = 1.3 K km s-1. HD 37903 is marked by a star symbol. |
The [C ii] emission appears to trace an ellipsoidal (egg-shaped) region oriented approximately southeast to northwest (position angle ~−50°) (Fig. 1). The emission is very strong in the southeast where the [C ii] region expands into a dense molecular cloud ridge, which was mapped by Wyrowski et al. (2000) in HCN(1−0) and HCO+(1−0). In the northwest the [C ii] emission is more diffuse and extended. In the southeastern quadrant of the nebula the emission is very bright with main beam brightness temperatures between 30−75 K. The [C ii] emission shows the same morphology as the PAH emission (at 8 μm), PACS 70 μm emission, and vibrationally excited H2 emission, while C91α is much more localized and only seen in the southeastern part of the nebula where the PAH emission is very strong (Fig. 1). Both PAHs and vibrationally excited H2 are excited by far-UV (FUV) radiation. The 70 μm emission is dominated by emission from small dust grains, which are also heated by photoelectric heating from the FUV radiation. Therefore it is clear that the excitation of the [C ii] in this area is also dominated by the FUV field from HD 37903, the B2 star illuminating the nebula.
Although low-J CO emission is detected over the entire mapped region (Fig. 2), the strongest emission is to the south and southeast of the nebula. The 13CO(3−2) emission, which traces the column density rather than the temperature of the gas, shows the dense ridge to the southeast. It also has a secondary peak coinciding with the northern [C ii] emission peak at (~20′′, 110′′,) indicating that the [C ii] emission is brighter where the FUV radiation illuminates a denser region of the surrounding cloud (Fig. 2). The CO(11−10) emission is only visible in the southeastern quadrant of the map, where the C ii region is bounded by the dense molecular cloud located southeast and south of HD 37903. The vibrationally excited H2 emission imaged with high spatial resolution indicates that the interface between the ionized inner region and the surrounding dense molecular cloud is far from smooth (Field et al. 1994, 1998; McCartney et al. 1999), with lumpy ridges and bright filamentary structures. The same is true for the PAH emission (Fleming et al. 2010; Sheffer et al. 2011; Peeters et al. 2012). Our maps of [C ii] and high-J CO lines (Figs. 2 and 3) look smoother, mostly because of insufficient spatial resolution to see such details. The [C ii]-map (Fig. 1) looks very similar to one of the early vibrationally excited H2 2.12 μm maps (Gatley et al. 1987), imaged with 20′′-resolution.
Inspection of the [C ii] and 13CO(3−2) channel maps (Figs. 3 and 4) show that there is a clear velocity gradient from south to north. This velocity gradient is very obvious in the three position velocity plots (Fig. 5), which cut through HD 37903 at three different position angles: east to west, southeast to northwest and north to south. The systemic velocities are ~10 km s-1 in the south, ~10.5 km s-1 in the southeast and east, while the velocities are ~12 km s-1 in the north and northwest. The 13CO(3−2) channel maps show a shell-like structure surrounding the whole nebula at red-shifted velocities (Fig. 4), indicative of an expansion of the nebula.
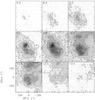 |
Fig. 3 Velocity-channel maps for [C ii] in gray scale overlaid with contours at 5 and 10 K, and from there to 70 K in steps of 10 K. The “+” shows the position of HD 37903. |
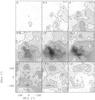 |
Fig. 4 Velocity-channel map for 13CO(3−2) in grayscale overlaid with contours at 2, 5, and 10 K, and from there to 50 K in steps of 10 K. The “+” shows the position of HD 37903. |
The low-J CO channel maps (Figs. B.1 and B.2) show the same velocity gradient as seen in [C ii] and 13CO, but in addition they show blue- and red-shifted emission in the southern part of the image, with the strongest high velocity emission near or centered on the extreme Class I object MM 3 (Mookerjea et al. 2009), also known as Sellgren D or MIR-63. MM 3, which is a relatively strong millimeter/sub-millimeter source (Wyrowski et al. 2000; Mookerjea et al. 2009), definitely drives a bipolar molecular outflow, but there appear to be several other fainter outflows in the region, including a blue-shifted outflow lobe from Sellgren C (MIR−62) coinciding with the Southern Ridge (SR). All outflows are associated with young Class II or Class I objects. These will be discussed in more detail in a separate paper (Sandell et al., in prep.). There is a red-shifted velocity feature in the northwestern corner of our CO maps without any associated blue-shifted emission. This is most likely part of the surrounding molecular cloud, which appears to be more red-shifted in the north and northwest.
3.2. A thin, hot molecular shell?
Jaffe et al. (1990), who observed the PDR region in NGC 2023 in CO(2−1), CO(3−2), CO(7−6), C18O(2−1), and [C ii], found that southeast of HD 37903 the CO(7−6) lines peak in a bright ridge coinciding with [C ii] and fluorescently excited H2 emission, and is surrounded by a dense shell of warm molecular gas. They concluded that this emission must originate in a region where the density is ~105 cm-3 and where the kinetic temperature is ≥85 K. Since our observations include completely sampled maps of the reflection nebula in both low-J CO lines (CO(3−2) and CO(4−3)), as well as in high-J CO lines (CO(6−5), CO(7−6) and CO(11−10)) and [C ii] with high spatial and spectral resolution, we are uniquely positioned to detect where the warm, hot, and ionized gas resides in the nebula.
The star illuminating the reflection nebula, HD 37903, is a B2 V star. The low visual extinction toward the star suggests that the star lies on the near side of the molecular cloud (Howe et al. 1991). The strong PDR emission southeast of the star looks like a half shell and suggests that here the expanding [C ii] shell is seen almost edge on.
In order to understand the geometry of the hot molecular shell, the CO(11−10) emission is first examined. This emission only probes hot gas associated with the PDR/molecular cloud interface with negligible contribution from the cold molecular cloud surrounding the reflection nebula. The CO(11−10) emission, however, is only seen in the southeastern quadrant of the map, the region with the strongest PDR emission. Since the peak brightness temperature of CO(11−10) is <22 K, which is much less than the 85 K that Jaffe et al. (1990) inferred from their CO(7−6) observations, it must be largely optically thin or sub thermally excited. Therefore it is a good tracer of the hot gas in the PDR. The CO(7−6) and CO(6−5) emission is also dominated by the hot PDR emission with CO(6−5) having Tmb ~ 85 K, and CO(7−6) ~ 60 K. The hot PDR emission is also seen in CO(4−3) and CO(3−2), but these lines are dominated by optically thick emission from the surrounding molecular cloud and are strongly affected by self-absorption from colder foreground gas. This makes it difficult or impossible for these lines to separate the PDR emission from the emission originating in the surrounding molecular cloud.
The CO(11−10) channel maps (Fig. 6), especially the panel centered at 10.5 km s-1, indicate the eastern boundary of hot gas to be ~90−110′′ offset from the central star, HD 37903. This is seen more clearly in the CO(6−5) and CO(7−6) channel maps at velocities 10.5 and 11 km s-1 (Figs. B.3 and B.4), although the boundary is not completely smooth. Figure 7 shows three position velocity plots over the southeastern quadrant of the map, which cut through the molecular cloud ridge in the east, south east and south. These cuts show that the CO emission ends at ~100′′ from the star, which is assumed to be the radius of the shell (0.19 pc). The cuts in CO(7−6) and CO(6−5) (Fig. 5) show the same. In these cuts, however, some faint CO emission is seen all the way to the edge of the map, indicating that there is some emission from the surrounding cloud even in CO transitions as high as CO(7−6). At the boundary the CO(11−10) emission is centered at 10.5 km s-1. The CO(11−10) lines are generally very narrow, ~0.5 km s-1, suggesting that the shell is viewed tangentially. The CO(7−6) and CO(6−5) lines are broader (>1 km s-1), probably because of contribution from the more turbulent surrounding molecular cloud. The CO lines get broader or double peaked closer to HD 37903 (Fig. 7). This is to be expected if the line of sight goes through the front and the back of an expanding shell or a ridge inside the shell. The narrow line widths along the boundary of the CO(11−10) emission region suggest that the emission resides in a thin shell. Figure 8 shows a simplified picture of the expanding C ii region surrounded by the hot PDR region.
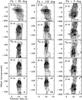 |
Fig. 5 Position-velocity diagrams for [C ii], CO(4−3), 13CO(3−2), CO(6−5), and CO(7−6) along directions given by position angle, PA of 0, 90 and 135°. The contours are at 10% to 100% (in steps of 10%) of the maximum Tmb of each plot. For each column we give the maximum Tmb from top to bottom. For PA = 90° the values are 56.9, 72.8, 24.3, 69.5 and 54.9 K. For PA = 135° the values are 53.5, 80.5, 41.5, 78.2 and 62.3 K. For PA = 0° the values are 53.6, 64.3, 29.2, 56.6 and 43.3 K. HD 37903 is at 0′′. The position angle is measured counterclockwise from north. |
Not all the CO(11−10) is emitted from the shell, however, because there is definitely structure in the CO emission even at a resolution of 23′′. This emission appears to originate in dense clumps, ridges and filaments inside the [C ii] region or in the interface between the surrounding dense, lumpy molecular cloud and the [C ii] region. At the position of the CO peak (55′′,−15′′) the CO(11−10) emission appears more like a northsouth ridge with a linear extent of 30′′. The CO lines are broad, 1.5 km s-1, and are not double peaked. This strong CO(11−10) emission region, which also stands out in CO(7−6) and CO(6−5), coincides with a prominent north south emission ridge, which is bright in both PAH emission and vibrationally excited H2. The northsouth cut goes through the eastern edge of the southern ridge (SR; see e.g. Sheffer et al. 2011) at ~75′′ south, which stands out as a clear peak both in [C ii] and high-J CO lines. The emission from the SR is redshifted (Vlsr ~ 11 km s-1) placing it near the backside of the nebula.
The cloud in which the reflection nebula is embedded is much less dense in the north and northwest, which is evident from the much fainter 13CO emission (Fig. 4). Here the densities in the PDR shell are too low to excite CO(11−10)3, but sufficiently high for CO(6−5) and CO(7−6), which are both dominated by the hot gas in the PDR (Fig. 2). In the northwestern quadrant one can see double split lines in both CO(7−6) and CO(6−5). Here the separation between the two velocity features is ~2 km s-1, suggesting that the expansion velocity is ~1 km s-1. In the southeastern part of the nebula the front and back side of the PDR is barely resolved in CO(11−10) and are separated in velocity by only ~1 km s-1, corresponding to an expansion velocity into the dense ridge of ~0.5 km s-1. These expansion velocities are consistent with the linear extent of the C ii region, which is about twice as large in the northwest as it is to the southeast.
3.3. The origin of [CII] and C91α emission
Although [C ii] is detected throughout the mapped region, the [C ii] emission is dominated by the PDR illuminated by HD 37903 (Fig. 1). To the southeast, where the C ii region expands into the dense lumpy molecular cloud ridge, the [C ii] emission extends out to ~100′′ from HD 37903. In the northwest, where the surrounding molecular cloud is more diffuse, the emission from the PDR is fainter and extends out to ~220′′ from the star.
The strongest [C ii] emission is detected in the southeastern quadrant where it is bounded by the dense molecular ridge (Fig. 9). The position velocity cut through the southeastern ridge (Fig. 5) shows strong, somewhat blue-shifted emission inside the molecular shell. The [C ii] lines, ~2−3 km s-1 wide, are broader than the CO(11−10) lines but roughly coincident in velocity. Inside the shell [C ii] also shows a fainter, broad, blue-shifted wing extending to velocities as low as 5 km s-1. The [C ii] channel maps (Fig. 3) show that this blue-shifted emission component is present in most of the strong PDR emission region in the southeastern quadrant. This blue-shifted emission can easily be explained by a photoevaporation flow from the dense PDR, suggesting that most of the PDR emission is on the back side of the nebula. There is also some fainter (≲15 K) [C ii] emission to the west protruding out from the hot molecular shell (Fig. 5). This emission, which is mostly blue-shifted, probably originates in the warm surface layers of the molecular cloud, where the densities are lower and the FUV radiation from HD 37903 can directly reach the cloud surface. Some of the [C ii] emission outside the reflection nebula, ~5−10 K, may be externally illuminated by FUV radiation from the large H ii region IC 434, which is located west of NGC 2023.
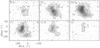 |
Fig. 6 Velocity-channel map for CO(11−10) with contours at 2.5 to 30 K in steps of 5 K. The “+” shows the position of HD 37903. |
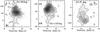 |
Fig. 7 Position-velocity diagrams along selected directions for CO(11−10). The contour levels for PA = 90 and 135° are 10% to 100% (10% step) of the maximum Tmb of 18.4 and 18.8 K respectively. The contour levels for PA = 0° are 20% to 100% (20% step) of the maximum Tmb of 9 K. HD 37903 is at 0′′. |
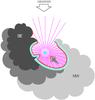 |
Fig. 8 Cartoon showing a simplified picture of hot, slowly expanding PDR region surrounding HD 37903. The surrounding cloud is shown in grey with denser gas having a darker shading. The hot molecular shell is shown in blue and the red shows the [C ii] PDR layer. In the southeast, where the C ii region expands into a dense, lumpy molecular cloud ridge the expansion is slowed down by the dense surrounding cloud, while it has expanded much further to the northwest. There are places where the PDR shell has broken through the cloud allowing radiation from the star to directly illuminate the cloud further out. |
In the northwest the molecular cloud has much lower density than the southeastern ridge. The northwestern position velocity plot (Fig. 5) shows that there are strong [C ii]-lines up to ~220′′, which coincide with the PDR ridge. Inside this region there are areas where the [C ii] and the high-J CO lines are double peaked suggesting that they come from the front and back side of the expanding [C ii] shell. The same double split lines are seen even in CO(3−2), see Fig. 10, at the offset ~−50′′, +53′′. The 13CO line is dominated by emission from the surrounding cloud and the column densities in the hot thin PDR shell are too low to be detected in 13CO. The velocity separation between the two velocity peaks (see Table 2), gives an expansion velocity of ~1 km s-1, agreeing quite well with the linear extent of the C ii region in the northwest, ~220′′, which is about twice of its extent to the southeast. Faint [C ii] emission is also present outside the [C ii] shell. The [C ii] emission extends at least up to 230′′ from the HD 37903, and is red-shifted by several km s-1. At the edge of our map the velocity of the [C ii] emission is ~12.4 km s-1.
The C91α emission mapped by Wyrowski et al. (2000) is only detected in the southeast (Fig. 9), where the C ii region interacts with the dense molecular cloud. The C91α emission is also inside the hot molecular shell. The southernmost peak of the C91α ridge, however, is in a region where no CO(11−10) emission is seen, nor is there any evidence for a dense gas clump based on our 13CO data. Even though [C ii] emission is seen, it is faint and there is no enhancement in the emission at the position of the southern C91α peak.
3.4. Moderately optically thick [CII], evidence from [13CII]-emission
If [13C ii] is detected, the ratio of [13C ii] to [C ii] line intensity, coupled with the 12C/13C abundance ratio, provides a measure of the optical depth of the [C ii] emission (Boreiko & Betz 1996). Our GREAT observations cover two of the three [13C ii] hyperfine lines: the F = 2−1 and F = 1−1, offset by +11.2 and +63.2 km s-1 relative to the [C ii] velocity, and with relative intensities of 0.625 and 0.125 of the total [13C ii] line intensity (Cooksy et al. 1986; Graf et al. 2012; Ossenkopf et al. 2013). Although the short integration times did not allow a clear detection of the [13C ii] F = 2−1 line in individual GREAT spectra, the F = 2−1 transition is definitely present even in the average of all spectra in the map cube. However, in a deep [C ii] spectrum4 observed toward HD 37903 with HIFI on the Herschel Space Observatory, the two strongest hyperfine lines of [13C ii], the F = 2−1 at 1900.466 GHz, and F = 1−0 at 1900.950 GHz (Ossenkopf et al. 2013), with relative intensities of 0.625 and 0.250 respectively, are clearly visible (Fig. 11). The F = 1−1 line is too faint to be detected in any spectra. Using the fitted peak temperatures for the [C ii] and [13C ii] hyperfine line transitions, the ratio of [C ii] and the sum of the two [13C ii] lines, corrected for the relative intensity of the two hyperfine transitions (0.875; Ossenkopf et al. 2013), is found to be 32.3.
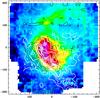 |
Fig. 9 Integrated intensity map of [C ii] (in color) overlayed with CO(11−10) and C91α contours in black and white respectively. For CO(11−10) the contours drawn are at 3, 5, 8, 10, 12, 15, 20, 22, 24, 26 times the value of σ = 1.3 K km s-1. For C91α contours are drawn at 5%, 20%, 30%, 45%, 50% to 100% in steps of 10% of the peak intensity of 7.3 × 10⁻³ Jy/beam. The star symbol marks the position of HD 37903. |
To improve the signal to noise of the [13C ii] line in the GREAT data, all positions in the SE quadrant where the [C ii] intensity exceeds 35 K were averaged. Figure 11 (right panel) shows this averaged spectrum. In this spectrum the [13C ii] F = 2−1 transition has a peak temperature of 1.28 K at a Vlsr = 21.3 km s-1, while the peak of the [C ii] line is 41.7 K at 10.0 km s-1. The difference in velocity, 11.3 km s-1, is in excellent agreement with the expected velocity separation of 11.2 km s-1 between the [C ii] line and the F = 2−1 transition of [13C ii]. The width of the [13C ii] line is ~1.9 km s-1, while the [C ii] line is about twice as wide, 3.7 km s-1. The ratio of the peak temperature between [C ii] and [13C ii], corrected for the relative intensity of the F = 2−1 line (0.625) is ~20.3. This ratio is very similar to what was derived from the spectrum with HIFI towards HD 37903 (see above). If the [C ii] line is optically thin, the ratio is expected to be ~70, the isotope ratio of 12C/13C measured for Orion (see e.g., Ossenkopf et al. 2013). The [C ii] emission is therefore somewhat optically thick with an optical depth of 1−2. All spectra in the northwestern quadrant were also averaged. Even here the [13C ii] line is present, but only as a 3σ detection. However, the ratio between [C ii] and [13C ii] is approximately the same. Analyzing other regions in the map give similar results. The Cii region ionized by HD 37903 is therefore somewhat optically thick in [C ii], since the [13C ii] is readily detected in all regions examined.
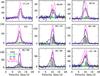 |
Fig. 10 Comparison of [C ii], CO(11−10), CO(7−6), CO(6−5), and CO(4−3) spectra at selected positions in the NGC 2023 region. The CO(4−3) spectra are scaled by a factor of 1.5 for clarity. CO(11−10) is scaled by a factor of three and filled with grayscale. For clarity we omitted CO(11−10) for the panel (17,113), because the spectrum is rather noisy and a clear non-detection. The temperature scale is in Tmb (K). |
Since the [C ii] emission is somewhat optically thick over the whole nebula, this can be used to determine the excitation temperate for [C ii]. Assuming a beam filling factor of one, and an optical depth of 2, the observed brightness temperature at the position of HD 37903, gives a lower limit to Tex = 85 K. At the [C ii] peak, assuming the same optical depth, one gets Tex = 130 K. Overall our observations suggest that [C ii] has a similar excitation temperature as the CO in the PDR, perhaps slightly warmer, or on the order of 90−150 K. To improve this estimate a few deep [C ii] integrations are needed providing sufficient signal-to-noise to enable a more accurate determination of the optical depth.
3.5. HD 37903
HD 37903 was found to have faint mid-IR excess emission from a remnant disk or residual envelope by Mookerjea et al. (2009). A “broad” (1.9 km s-1) but faint line in CO(11−10) is seen toward the star (Table 2). However, the position velocity cuts in CO(11−10) (Fig. 7), which go through the star in three different directions, show no enhancement at all at the position of HD 37903. Instead there is a red-shifted cloudlet at ~11.5 km s-1, peaking ~20′′ southeast and south of the star. Wyrowski et al. (2000) found weak extended continuum emission at 8 GHz (3.3 cm), with a peak southwest of HD 37903 at (−10′′, −12′′), which they interpreted as optically thin free-free radiation from gas ionized by the B star. This cloud could be associated with the ridge of bright PAH emission which runs from northeast to southwest just south of the star. There is no clear [C ii] enhancement at this position, nor in C(11−10) or in any of the low-J CO maps, except that they all show blue-shifted emission feature south west of the star, which peaks roughly at (−10′′, −18′′) from the star. A possible scenario could be that a clump of gas is being pushed away by radiation pressure from the strong FUV radiation close to the star, with the side facing the star completely ionized while the emission further from the star is shielded and still molecular.
3.6. The physical conditions of the cloud surrounding NGC 2023
The integrated intensity ratio CO(3−2)/CO(4−3) changes very little between 0.9 and 1.1. This suggests that both the CO(4−3) and CO(3−2) lines are optically thick at most positions in the cloud and hence the brightness temperature is approximately equal to the gas temperature. Using the peak brightness temperatures observed in CO(3−2) we estimate the gas temperature of the quiescent cloud outside the C ii region to be ~40 K. If the CO emission is clumped the gas temperatures could be somewhat higher. At the CO(3−2) emission peak there is a strong contribution from the hot PDR emission and the observed CO(3−2) brightness temperature suggests a temperature of ≳75 K.
In order to further constrain the kinetic temperature, density and column density of the gas in the quiescent cloud and the hot molecular shell a grid of models based on the non−LTE radiative transfer program RADEX (van der Tak et al. 2007) have been compared with the observed line intensity ratios. Model inputs are molecular data from the LAMDA database (Schöier et al. 2005) and CO collisional rate coefficients from the work of Yang et al. (2010). RADEX predicts line intensities of a given molecule in a chosen spectral range for a given set of parameters: kinetic temperature, column density, H2 density, background temperature and line width. Unlike some of the lighter hydrides for which the excitation is dominated by the far- and mid-infrared background radiation, the only radiation affecting the excitation of CO molecules at (sub)-millimeter wavelengths is the cosmic microwave background (CMB). Hence a value of 2.73 K is assumed as the background temperature for all calculations presented here. The synthetic line ratios are calculated assuming line widths of 3 km s-1, which is somewhat higher than the observed line widths, but such line widths are needed in order to capture the PDR emission throughout the nebula.
Figure 13 shows contours of the observed CO(3−2)/ CO(4−3), CO(6−5)/CO(4−3), CO(11−10)/CO(6−5) and CO(11−10)/CO(7−6) ratios estimated as a function of i) density (n(H2)) and kinetic temperature Tkin, with N(CO) fixed) and ii) N(CO) and Tkin as calculated by RADEX. The continuous and dashed contours show the minimum and maximum values of the observed ratios respectively. While the intensity ratios do not constrain the column densities at all, they uniquely demarcate the kinetic temperatures and densities of the clouds which contribute to the emission of the CO transitions being considered. As seen in Fig. 12 the CO(3−2) and CO(4−3) maps primarily trace the quiescent cloud. Based on the C18O(2−1) observations by Jaffe et al. (1990) and assuming that C18O is optically thin, the column densities in the surrounding molecular cloud are as high as 5 × 10¹⁸−1019 cm-2. Therefore based on modeling with RADEX the Tkin of the quiescent cloud is estimated to be 35−40 K for densities of 105 to 106 cm-3.
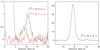 |
Fig. 11 [13C ii] spectra calibrated in main beam brightness temperature and plotted on a common Vlsr scale of [13C ii]. On the left is the long integration HIFI spectrum toward HD 37903. The F = 2−1 is plotted in black and F = 1−0 in red overlaid with Gaussian fits in green. To the right is an average of all GREAT [C ii] spectra brighter than 35 K in the SE quadrant of our map of NGC 2023. The F = 2−1 line is clearly visible at Vlsr = 10.1 km s-1, see text. The temperature scale is in Tmb (K). |
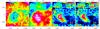 |
Fig. 12 Ratios of integrated intensity over the velocity range 9−12 km s-1. From left to right we show: a) CO(3−2)/CO(4−3); b) CO(6−5)/ CO(4−3); c) CO(11−10)/CO(6−5); and d) CO(11−10)/CO(7−6). The emission in CO(4−3) and CO(3−2) are dominated by the quiescent colder molecular cloud, while the higher J transitions trace the hot molecular shell. |
The gas densities in the CO(11−10) emitting PDR shell have to be at least 4 × 105 cm-3, the critical density of CO(11−10). In the north and northwestern part of the nebula, where CO(7−6) is readily detected but not CO(11−10); the densities are somewhat lower, ~105 cm-3. To get a rough idea of the CO column densities in the PDR these densities are adopted and the width of the CO emitting layer is assumed to be ~1′′. For a normal CO/H2 abundance ratio of 10-4N(CO) is ~1017 cm-2, which agrees well with what Jaffe et al. (1990) deduced from their observations. Since the ratios involving CO(11−10) primarily trace the physical conditions of the hot molecular shell, the Tkin of the shell Is estimated to be ~90−120 K for gas densities of 105−106 cm-3 based on Fig. 13.
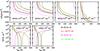 |
Fig. 13 Intensity ratios based on synthetic models calculated using RADEX. The contours correspond to intensity ratios indicated in the panel as a function of the physical parameters. The ratios are color coded, with the solid line representing the low limit and the dashed one the high limit for each ratio as determined from the ratio plots in Fig. 12. The color coding and limits are as follows: black (6−5)/(4−3) 0.9 (solid) − 1.10 (dashed); red (11−10)/(7−6) 0.07 (solid) − 0.20 (dashed); green (11−10)/(6−5) 0.05 (solid) − 0.16 (dashed); magenta (3−2)/(4−3) 0.8 (solid) − 1.1 (dashed). The upper row corresponds to models for which Tkin and gas density (n(H2)) are varied keeping the column density (N(CO)) constant to the value indicated in the panel. In the lower row results models in which Tkin and N(CO) are varied and n(H2) are fixed to the values indicated in the panel. |
3.7. Far-IR line cooling from [CII], evidence from [13CII] and CO
It is well known that the fine structure lines of [C ii] 158 μm is the dominant cooling line in low-density regions (Hollenbach et al. 1991) providing ~0.3% of the total FIR (72−196 μm) luminosity in our Galaxy (Stacey et al. 1985). Since our observations cover almost the whole NGC 2023 reflection nebula, it is possible to determine the [C ii] luminosity for a “typical” reflection nebula. Integrating the [C ii] emission from 4−18 km s-1 over the C ii region, an area of 71 100 arcsec2, yields an integrated intensity of 8.86 × 10⁻¹³ W m-2, corresponding to 3.4 L⊙ for a distance of 350 pc. This agrees well with the [C ii] luminosity estimated by Howe et al. (1991), who estimated 3.8 L⊙ (corrected to a distance of 350 pc) from the area they mapped with the KAO. NGC 2023 was observed with PACS as part of the Herschel Gould Belt survey (André et al. 2010), but only at 70 and 160 μm. However, the PACS wavelength coverage (60−210 μm; Poglitsch et al. 2010) is fairly similar to FIR coverage used by Stacey et al. (1985), allowing an estimate of the flux densities for the same area used to determine the [C ii] luminosity. Since there is strong emission from the surrounding molecular cloud, the integrated emission from the reflection nebula was estimated by using a background region to correct for the emission from the surrounding cloud. From the PACS images the background subtracted flux densities were found to be 3200 Jy and 3300 Jy for 70 μm and 160 μm, respectively. Assuming a dust emissivity index, β = 1, the ratio of the 70 to 160 μm flux densities correspond to a dust temperature of 33.3 K, which was used to estimate the expected flux density at 100 μm, 4400 Jy. For such dust temperatures the color correction of the PACS bands is negligible (Müller et al. 2011), except for the 70 μm band, which requires a color correction of ~5%. Therefore the effective bandwidths from the three PACS photometry bands5 can be used to compute the FIR luminosity for NGC 2023, which comes to LFIR = 210 L⊙. For NGC 2023 the [C ii] luminosity is 1.6% of the FIR luminosity, which sounds quite plausible considering that [C ii] is much brighter in NGC 2023 than in the halos of molecular clouds.
Since CO(11−10) was readily detected in the dense southeastern part of the nebula, one can make a rough estimate of how much cooling is provided by CO. The [C ii], CO, and FIR luminosity are determined by integrating all our images over the intense PDR emission in the southeastern and central part of the nebula. This is essentially the region where CO(7−6) and CO(6−5) emission is very strong, (see Figs. B.4 and B.3), and covers an area of 31 700 arcsec2. For [C ii] a luminosity of 1.9 L⊙ is obtained, i.e., almost 60% of the [C ii] luminosity comes from the dense PDR. The emission of CO lines is integrated over the velocity range 8.9−12.6 km s-1, which should cover all the emission from the hot PDR. For CO(11−10) the luminosity is 35.0 × 10⁻³ L⊙. For the lower J transitions there is substantial contribution from the surrounding cloud. Therefore the integrated emission was corrected using an adjacent reference region. The derived luminosities for the 7−6, 6−5, 4−3, and 3−2 transitions are: 13.7, 10.8, 6.5 one 3.2 respectively; all in units of 10-3 L⊙. By estimating the contribution of the CO transitions which were not observed, results in a luminosity of ~0.15 L⊙ for CO transitions up to 11−10. The contribution from higher transitions is more difficult to estimate, since there are no observations of any CO transitions higher than 11−10. It is therefore assumed that higher J CO transitions contribute the same amount as all CO lines up to 11−10, which is probably good to a factor of 2. The total CO luminosity from the dense PDR region is therefore ~0.3 L⊙, certainly not more than 0.5 L⊙. Even though cooling from CO is by no means negligible, it is still a factor of four lower than the cooling from [C ii]. Background subtracted flux densities of the PACS 70 and 160 μm images for the southeastern region are 2650 and 2400 Jy at 70 and 160 μm, respectively. In this region the dust temperature is 37 K resulting in a flux density of 3400 Jy at 100 μm. The color corrections are now negligible and the FIR luminosity is 160 L⊙, i.e., the cooling efficiency from [C ii] is lower in very dense regions, or only about 1.1% of the FIR luminosity.
These results can be compared to the Orion Bar, another well-studied bright PDR illuminated by a high mass star and often considered a prototypical PDR template for high mass star forming regions. Bernard-Salas et al. (2014) find that in the dense Orion Bar PDR the [O i] 63 μm lined accounts for 72% of the total line cooling, with [C ii] contributing less than 18% and CO lines ~5%, i.e., the contribution from CO is ~25% of the [C ii] luminosity. The Orion Bar is therefore similar to the dense PDR emission seen in the southeastern part of NGC 2023 in the sense that the cooling from CO is still lower than from [C ii], but not by a huge amount. In contrast cooling from molecular lines completely dominate over atomic fine structure lines lines in high-mass protostars, where cooling from [C ii] is completely negligible (Karska et al. 2014).
Gaussian fits to spectra at selected positions.
3.8. PDR modeling
3.8.1. Choice of positions in the PDR
The close agreement in morphology between the integrated [C ii] emission and fluorescent H2 and PAH emission (Fig. 1, Sect. 3.1) confirms that dominant part of the [C ii] emission arises from the PDR illuminated by HD 37903. This agrees well with the PDR modeling by Kaufman et al. (2006), who showed that at least 85% of the [C ii] emission originates in the PDR. We find that the high-J CO lines, particularly CO(11−10) and CO(7−6), are also dominated by emission from the PDR (Sect. 3.2), although there is still some contribution (~10 K km s-1) from the surrounding cloud in CO(7−6) in the dense southeastern ridge. It is difficult to estimate the contribution from the surrounding cloud, especially since the densest part of the surrounding molecular cloud coincides with the PDR, as seen for example from the C18O(2−1) map by Jaffe et al. (1990). By integrating over the CO(7−6) emission from 9−12 km s-1 inside the southern ridge and estimating the background from a comparison region outside the nebula, it is found that about half of the CO(7−6) emission and slightly more of the CO(6−5) comes from the surrounding molecular cloud. In the northwestern part of the nebula the cloud emission is negligible in both CO(6−5) and CO(7−6). Therefore [C ii] and CO(11−10) can be used to explore the physical conditions in the southwestern quadrant, while results from CO(7−6) and CO(6−5) have to be used with caution. For the rest of the nebula these transitions work fine, while the lower-J CO transitions are dominated by the surrounding cloud. Since the physical conditions vary quite of lot, nine positions have been selected for modeling, located in different parts of the reflection nebula. These include: (0′′, 0′′), the position of HD 37903; (30′′, 15′′), the [C ii] emission peak; (53′′, −13′′), the CO(11−10) as well as C91α peak; (17′′, 113′′), the northern [C ii] peak; (45′′, −45′′), a position in the CO(11−10) ridge; (−49′′, 53′′), a relatively benign position in the northwestern quadrant, showing PDR emission from both the front and back side of the PDR shell; (23′′, −60′′), centered on the C91α clump no. 2, (−13′′, −79′′), the SR position, which is the most extensively modeled PDR position in NGC 2023, and (60′′, −60′′), peak of the low-J CO emission. The selected positions are discussed in more detail in Appendix A. The spectral line profiles of all the selected positions are shown in Fig 10, and the line parameters derived from Gaussian fits (described in the following text) are given in Table 2.
3.8.2. Determination of line parameters
Since the spatial resolution of observed images varies from 24′′ for CO(11−10) down to 8.̋2 for CO(7−6), the maps have been smoothed by re-gridding all maps in CLASS to the same angular resolution and on a common grid. In order not to miss out on the considerable structure that has been detected in our maps on all angular scales, all maps were smoothed to 16.̋1, the resolution of the [C ii] map, and CO(11−10) was left at its original resolution (24.̋2), since CO(11−10) is detected only in the southeastern quadrant of the C ii region. CO(3−2) and 13CO(3−2) were also left at their native angular resolution, since neither of them are good tracers of PDR emission and they are not used in the PDR analysis. Smoothing introduces relatively minor additional calibration uncertainty, since all spectra were calibrated in Tmb based on observations of Jupiter, which is an extended source with a size of ~45′′ and hence encompasses most of the power of the error beam.
As noted earlier the line emission from the reflection nebula NGC 2023 show evidence of emission from the quiescent cloud, from the PDR, from the high velocity molecular outflows and also from wings due to photo evaporation flows (seen in [C ii] spectra). For the analysis of the PDR emission most of the emission from the quiescent cloud has been excluded by considering only CO(6−5), CO(7−6) and CO(11−10) along with the relevant component of the [C ii] emission. Molecular outflows are also excluded except for the southern ridge (SR) position at (−13′′,−79′′). The extraction of the emission primarily due to the PDR component was achieved using multi-component Gaussian fits to all the observed molecular lines and [C ii] for all selected positions.
A stepwise approach was followed to disentangle the different velocity components contributing to the observed line emission. Since 13CO(3−2) is a good tracer of the quiescent surrounding molecular cloud single-component Gaussian fits to the 13CO(3−2) line was performed to obtain the velocity of the quiescent cloud. Similarly CO(11−10), if present, and CO(7−6) spectra were used to identify the velocity of the hot CO in the PDR by fitting a one- or two- (depending on whether the two components arising from the front and the back of the PDR are discernible) velocity component Gaussians to these spectra. The two components often blend in the southeastern quadrant. The CO(6−5) spectra were fitted assuming contributions from both the quiescent cloud and the PDR, and in most cases the best results were obtained by locking the velocity of the quiescent cloud to the value determined from 13CO(3−2). The lower J CO lines, CO(3−2) and CO(4−3) are trickier, because especially in the southeastern quadrant they suffer from strong self-absorption by the surrounding cloud. Reasonable fits to the low-J CO lines typically required two or three components by locking the quiescent cloud component. However, due to overlap in the velocity of the emission from the quiescent cloud and the PDR, even when a good fit has been obtained for the low-J CO lines, the intensities may not accurately represent either the cloud emission or the PDR emission. Thus both CO(3−2) and CO(4−3) were excluded in our comparison of the observations with the PDR models. Finally the [C ii] line profiles were fitted using the high-J CO emission as a guideline, although it is noted that the [C ii] PDR emission is always offset by ~0.2−0.5 km s-1 from the hot CO emission and the lines are generally broader. Additionally [C ii] often show high velocity non-Gaussian wings from photo-evaporation flows which have no molecular counterpart. These were masked out out during the fitting and their contribution was determined by taking the difference between the total line integral and the sum of the area covered by the Gaussian fits. The results of the Gaussian fits are given in Table 2.
3.8.3. Comparison with plane parallel PDR models
In order to estimate the physical conditions in the PDRs contributing to the emission at the selected positions the observed line intensity ratios are compared with the results of the model for PDRs by Kaufman et al. (2006). The physical structure in these models is represented by a semi-infinite slab of constant density, which is illuminated by FUV photons from one side. The model takes into account the major heating and cooling processes and incorporates a detailed chemical network. Comparing the observed intensities with the steady-state solutions of the model, allows for the determination of the gas density of H nuclei, nH, and the FUV flux (6 eV ≤hν< 13.6 eV), G0, measured in units of the Habing (1968) value for the average solar neighborhood FUV flux, 1.6 × 10⁻³ erg cm-2 s-1. As noted already in this paper the relative contribution of the cloud and the PDR to the total emission depends on the observed tracer and the location in the nebula. Since the primary focus is to characterize the PDR in NGC 2023, only high-J CO lines like (6−5), (7−6), (11−10) and [C ii] line intensities corresponding to the velocity components identified to be associated with the PDR are being used. In Table 3 the component number refers to the first, second or third velocity component of Table 2. Appendix A discusses in more detail the positions and velocity components which were modeled.
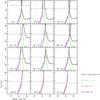 |
Fig. 14 Contours of observed intensity ratios plotted on the intensity predictions as a function of hydrogen density nH and FUV radiation field (G0) from PDR models, for the selected positions in NGC 2023. The horizontal dashed lines correspond to FUV estimated using the stellar parameters as described in the text. |
Results of comparison of observed intensity ratios with PDR model calculations.
Figure 14 shows results of comparison of the observed intensity ratios [C ii]/CO(6−5), [C ii]/CO(7−6), [C ii]/CO(11−10) and CO(11−10)/CO(7−6) with the predictions of the PDR models. It is assumed that the beam-filling factors of the PDR components of the different tracers used are identical and hence intensity ratios do not depend on the beam filling. Each panel in Fig. 14 shows the observed intensity ratios of different tracers as contours in different colors. The strength of the FUV radiation in the region has been derived using the same method as described by Sheffer et al. (2011). For this purpose a total FUV luminosity of 4.0 × 10³ L⊙ (Parravano et al. 2003) is used, which is appropriate for a B2 V star of 9 M⊙ (Trundle et al. 2007; Hohle et al. 2010) and the distance to NGC 2023 to taken to be D = 350 pc. In each panel the estimated FUV field strength is marked by dashed horizontal lines. Since projected distances to the various positions in the cloud are being used, the estimated FUV field will be an upper limit and varies between 2.2 × 10³ and 1.7 × 10⁵ in units of Habing field. There is no way to know how close the PDR interface is at the position of HD 37903, but it is probably no closer than 0.025 pc (i.e. 15′′ radius). Overall, all the ratios constrain the densities to values between 104 and 104.5 cm-3 corresponding to the range of estimated FUV intensities. The ratios involving CO(11−10) tend in general to indicate somewhat higher densities of 105 cm-3 or more.
Among the positions which were modeled, the position at (−13′′,−79′′) corresponds to the Southern Ridge (SR) that has been modeled using PDR models by Burton et al. (1990), Draine & Bertoldi (1996, 2000), Steiman-Cameron et al. (1997), Kaufman et al. (2006), Sheffer et al. (2011). Most of these analyses used velocity-unresolved spectra of [C ii], [O i], H2 and velocity-resolved CO spectra. Burton et al. (1990) found that the observational data they had at the time agreed well with G0 = 104 and n = 104 cm-3. Their modeling does reproduce our observed [C ii] intensities extremely well, but overestimate the CO(7−6) intensity by about a factor of five. Steiman-Cameron et al. (1997) argued that the [C ii] emission is likely to be dominated by emission from lower density gas surrounding the PDR based on the clumpiness seen in the H2 maps. Steiman-Cameron et al. (1997) therefore separated the [C ii] emission into two components: a dense component (n ~ 105 cm-3) filling 10% of the beam, while a lower density (n ~ 103 cm-3) fills the rest of the beam. A more refined analysis using a merged PDR/H ii region model predicted that the denser component corresponds to G0 = 104 and n = 5 × 104 cm-3 (Kaufman et al. 2006). Our velocity resolved [C ii] observations do not agree with this picture. At the position of the SR there are two velocity components in [C ii] (Table 2, Fig. 10). The red-shifted [C ii] component (Vlsr = 10.7 km s-1) originates in the dense PDR, see Sect. A, and most of the emission from the blue-shifted [C ii] component originates in the PDR on the front side of the C ii region. Our velocity resolved [C ii] observations therefore suggest that only ≲20% of the [C ii] emission is likely to come from low density gas inside the nebula. The densities obtained here are between 104 and 105 cm-3 for the PDR emission from the SR depending on which transition of CO viz., (6−5) or (11−10) that is used.
4. Discussion
NGC 2023 has served as a testbed for PDR modeling in a number of studies. The first PDR modeling was done by Black & van Dishoeck (1987) using the near-IR observations of fluorescent vibrationally excited H2 emission in the 2 μm window by Hasegawa et al. (1987) at the position 80′′ south of HD 37903. They found that to reproduce the observed H2 emission line they required a density of 104 cm-3, a gas temperature, Tk ~ 85 K, and a radiation field G0 = 300 times that of the Galactic background star light. Since then the models as well as observational constraints have vastly improved. Models utilizing near-IR fluorescent H2 lines at the SR (which includes the position 0′′, −80′′), find gas temperatures of the H2 emitting region of 700−1000 K, densities of ~105 cm-3, and a radiation field G0 ~ 8000 (Draine & Bertoldi 1996, 2000).
The advantage of using fluorescent H2 lines to probe the PDR emission is that there are a large number of H2 lines, see e.g. Burton et al. (1992, 1998), McCartney et al. (1999), Takami et al. (2000). The ratios of these lines constrain the physical conditions, as well as the incident FUV field rather well. The line ratios also discriminate between shock or fluorescent excitation of the line emission, although there may be cases where one can see both fluorescent and shock excited H2. The fluorescent H2 lines are only emitted from the hot gas in the PDR or in shocked gas and have no contamination from low density gas inside the C ii region or from the surrounding molecular cloud. However, they only probe the outer hot layers of a PDR interface, and other tools are therefore needed to probe the structure of the PDR. The general morphology of a PDR has been described in many papers (see e.g., Tielens & Hollenbach 1985; Hollenbach et al. 1991; Kaufman et al. 2006). A PDR illuminated by an early B star has a hot surface layer of AV ≲ 1−2, with atomic H and O, as well as C+; a transition to H2 and C for AV ≳ 1−2, where carbon starts to transition into a mixture of C and CO; and for AV ≳ 4−6 most of the carbon is in CO, while the oxygen not tied up in CO remains atomic to AV ~ 10. Here the PDR transitions into the cold molecular cloud (10−40 K), which is probed by CO and other traditional molecular gas tracers. The gas in the PDR is heated by photoelectric heating from small dust grains and [C ii] is excited by collisions with hot electrons and hydrogen. The dominant cooling lines are the [C ii] 158 μm line and the [O i] line at 63 μm.
The hot (1200−200 K) intermediate layers are probed by [C ii], [O i], and [C i]; fluorescent and pure rotational H2 lines and high-J CO transitions, while the interior layer of a PDR is mostly seen in pure rotational H2 lines and high-J CO transitions. This paper focuses on velocity resolved spectroscopy of the [C ii] 158 μm line and high-J CO lines observed with SOFIA and APEX. The high-J CO lines, especially CO(11−10) identify the dense PDR regions in the southeastern part of the C ii region and show that CO resides in a hot (~100 K), thin layer surrounding the [C ii] emission. The close correspondence in velocity (a few tenths of km s-1) between [C ii] and CO(11−10) and/or CO(7−6) indicate that most of the [C ii] emission originates in the dense PDR with only a minor part of the emission originating in low density gas inside the C ii region, except for some regions in the dense southeastern molecular ridge, where there is relatively strong blue-shifted [C ii] emission without any counterpart in CO. The general agreement between PDR emission and [C ii] emission is qualitatively seen in our integrated intensity map of [C ii] overlaid on other PDR tracers (Fig. 1), which shows that the [C ii] emission traces the boundary of the C ii region (limb-brightened) and the strongest [C ii] emission coincides with bright PDR filaments. Our PDR modeling (Sect. 3.8.3, see also Table 3), also shows that the observed [C ii] emission can be explained with the [C ii] emission coming from PDR regions with densities ranging from ~1 × 104 cm-3−4 × 105 cm-3, although the radiation field is not very well constrained. There are, however, positions in the dense southeastern ridge, where the lines are heavily blended and the [C ii] emission cannot be accurately identified as originating in the hot PDR shell. The [C ii] peak (30′′,15′′) is such a case. Here the CO(11−10) emission profile is asymmetric with the dominant peak at 10.8 km s-1, while the strongest [C ii] emission (peak temperature ~74 K) is centered at 9.1 km s-1, where hardly any CO(11−10) emission is seen. At this position the CO(7−6) line profile is symmetric and probably heavily contaminated by the surrounding colder molecular cloud. Position (45′′, −45′′) is somewhat similar. At these positions it is quite possible that more than 50% of the [C ii] emission comes from low density gas inside the C ii region. Here it would be useful to have observations of CO(8−7) (which can be observed from the ground, but only under very good observing conditions), or CO(12−11) and CO(13−12), the latter two can be observed with SOFIA and will have no contamination at all from the surrounding cloud. However, an even better way to determine what fraction of the ionized gas comes from the dense PDR vs. lower density gas inside the C ii region is to do velocity resolved observations of the [O i] 63 μm line, which now can be done with the GREAT H-channel. The [O i] 63 μm line has a much higher critical density (4.7 × 105cm-3) compared to [C ii] (2.8 × 103 cm-3) (Meixner & Tielens 1993). If the [C ii] emission is dominated by gas with densities <104 cm-3, it will not be seen in [O i].
5. Summary and conclusions
The NGC 2023 reflection nebula was mapped in [C ii] and CO(11−10) with the heterodyne receiver GREAT on SOFIA and slightly smaller maps in 13CO(3−2), CO(3−2), CO(4−3), CO(6−5), and CO(7−6) were obtained with APEX in Chile. The [C ii] emission was found to trace an expanding ellipsoidal shell-like region surrounded by a hot molecular shell seen in high-J CO lines. The expansion velocity of the PDR shell measured from the high-J CO lines is ~0.5 km s in the southeast and ~1 km s-1 in the northwest, which is consistent with the size of the C ii region. The [C ii] emission is dominated by dense (n = 104−105 cm-3) gas in the PDR interface between the C ii region and the surrounding cold molecular cloud, except perhaps in the southeast, where there may be a significant contribution from lower density [C ii] emission inside the C ii region. In the northwest, where the surrounding molecular cloud is less dense, the densities inside the C ii region appear to be too low to excite [C ii], and all the [C ii] emission comes from the PDR shell surrounding the C ii region. Based on the strength of the [13C ii] F = 2−1 line, the [C ii] line appears to be somewhat optically thick in the PDR shell with an optical depth of a few. The high-J CO lines are very narrow (0.5−1 km s-1) and strong, indicating that the CO emission in the PDR shell comes from a thin, hot, molecular shell surrounding the [C ii] emission. The temperature of the CO emitting PDR shell is ~90−120 K, with densities of 105−106 cm-3, as deduced from RADEX modeling. The excitation temperature for [C ii] in the PDR is similar to the CO in the hot molecular shell, or perhaps slightly warner. The [C ii] lines are broader (~2−3 km s-1), indicating that the [C ii] emitting region is more turbulent. PDR modeling indicates that the densities in the [C ii] emitting region are also somewhat lower, 104 cm-3 to a few times 105 cm-3 which is to be expected, since the overpressure in the PDR forces the ionized gas to expand into the [C ii] region. The [C ii] luminosity was found to be 1.6% of the total FIR luminosity for the whole reflection nebula. In the dense molecular ridge the fractional luminosity of [C ii] is lower, 1.1% while fractional luminosity of CO may be as high as 0.3%.
Our high spatial and spectral imaging of [C ii] and high-J CO lines like CO(11−10) and CO(7−6) gives us a unique insight to the morphology, kinematics and physical conditions of the C ii region surrounding NGC 2023. The only thing missing is additional high-J CO lines like CO(12−11) and CO(13−12), which are unaffected by the colder surrounding molecular cloud. These lines, together with already existing [C ii] and CO(11−10) data would help us further constrain the radiation field and physical conditions in the PDR shell. Equally useful would be velocity resolved spectra of the [O i] 63 μm line, which can be used to disentangle the fraction of diffuse and dense gas in the C ii region. All these observations can be done with GREAT on SOFIA.
Online material
Appendix A: Comments on the selected positions
(0′′, 0′′). The position of HD 37903. Probably a blend of two PDRs, although they are too close together in velocity to separated. South of HD 37903 the high-J CO lines split into two components, but at the position of the star they are close to the cloud velocity. [C ii] is much broader and it was with two velocity components. [C ii] also shows a red-shifted wing. This red-shifted emission extends toward SW and is roughly coincident with the somewhat blue-shifted ridge of CO emission curving out toward HD 37903.
(30′′, +15′′). This is the position where [C ii] peaks, Tmb ~ 80 K. It is close to and probably associated with the bright fluorescent H2 ridge Field et al. (1998) call the Seahorse. Two velocity components were fitted to all observed lines, one close to the systemic velocity of the molecular cloud, 10.5 km s-1, and one which is blue-shifted, 9.1−9.4 km s-1 ( Table 2).
(−13′′,−79′′). This position is centered on the southern ridge (SR), one of the most extensively modeled PDRs in NGC 2023. It is, however, a difficult position to model, because it coincides with the blue outflow lobe from Sellgren C (Sandell et al., in prep.) and the [C ii] line and high-J CO lines show two velocity components: one blue-shifted, and one red-shifted. The SR is definitely associated with the red-shifted velocity component (Vlsr ~ 10.7 km s-1), because north-south cuts through the SR show that this velocity component coincides with the SR. The SR also stands out in the high-J CO channel maps, most prominently in the channel centered on 11 km s-1, see Figs. 6, B.3, and B.4. It is still seen even in CO(4−3), but not as clearly (Fig. B.2). The good agreement in velocity between [C ii] and CO(11−10) emission suggest that the [C ii] emission originates from the dense PDR. The blue-shifted emission component has a systemic velocity of 10 km s-1, and almost certainly corresponds to a PDR on the front side of the C ii region. This PDR is less dense than the SR, and not detected in CO(11−10). Although it is clearly seen in CO(7−6) and CO(6−5) it is hard to reliably estimate how much of the emission is associated with the PDR, since both lines are affected by the blue outflow lobe from Sellgren C. The [C ii] line is more blue-shifted than the CO lines and may include low density gas from the C ii region. Therefore only the PDR component directly associated with the PDR is modeled. It is likely that the intensity of the high-J CO transitions is somewhat underestimated since our observations are centered on the ridge and the emission only fills about half the beam. However, since our PDR modeling only use line ratios, the error from ignoring beam filling is relatively minor.
(53′′,−13′′) and (23′′,−60′′). The position (53′′, −13′′) coincides with the peak of CO(11−10) emission peak as well as with the C91α clump no. 3 (Wyrowski et al. 2000), while (53′′, −13′′) is approximately centered on the C91α clump no. 2. No attempt was made to model the C91α clump no.1, because the CO emission is contaminated by the strong red-shifted outflow from Sellgren D. For both positions strong [C ii] emission is seen at about the same velocity as C91α, but at (23′′, −60′′) the [C ii] line is much broader, 2.5 km s-1 vs. 0.8 km s-1 for the C91α emission line, probably because more of the extended
emission associated with the ridge is included and because [C ii] is not very sensitive to the density of the emitting gas. A relatively strong blue-shifted [C ii] emission feature is also seen at both positions without any counterpart in high-J CO emission.
(45′′,−45′′) and (60′′,−60′′). These two positions probe the strong PDR ridge southeast of HD 37903. A “long” integration spectrum in [C ii] and CO(11−10) was obtained on (45′′, −45′′), which is close to the peak position in CO(11−10). The position (60′′, −60′′) coincides with the peak in low-J CO lines. Both positions show emission from two blended PDR components in [C ii] (Fig. 10, Table 2). At (45′′, −45′′) the red-shifted component dominates the emission in both [C ii] and CO(11−10). The second component is close to the cloud velocity. Here [C ii] shows a strong blue-shifted wing making it difficult to separate the emission from the PDR from the low density [C ii] inside the C ii region, although PDR modeling was done for both components. At (60′′,−60′′) our high-J CO spectra only show emission from the PDR on the backside of the C ii region. The blue-shifted [C ii] component is almost certainly dominated by lower density gas inside the nebula. Here only the red-shifted PDR component is modeled. The (60′′,−60′′) position was also observed by Jaffe et al. (1990) in CO(7−6) with a 34′′-beam. Their results agree well with our findings.
(−50′′, +53′′). This position is close to the symmetry axis in the northwestern part of the nebula. All lines, except 13CO(3−2) show double split lines. This is not due to self-absorption, since there is no foreground gas that could absorb the CO(7−6) and CO(6−5) emission. At CO(4−3) the emission from the backside of the nebula is probably affected by self-absorption near the cloud velocity, making the emission somewhat more red-shifted than the higher J transitions. The PDR modeling therefore only uses the CO(7−6) and CO(6−5) transitions and both PDRs are modeled separately.
(+17′′, +113′′). This position coincides with the northern 13CO(3−2) peak and close to the crossing H2 filaments, which Field et al. (1998) called the “triangle” (located at 16′′, +129′′). Here all the lines show only one velocity component at the cloud velocity (Table 2). The triangle was observed by Takami et al. (2000) in several H2 emission lines in the near-IR with a Fabry-Perot spectrometer providing spectral resolution, R, of 500−2200. This position is also close to the position (+33′′, +105′′) observed by (Burton et al. 1998), who obtained spectra from 1−2.5 μm, at 230−430 spectral resolution.
Appendix B: CO channel maps
Figures B.1 to B.3 show the channel maps of CO(3−2), CO(4−3), CO(6−5), and CO(7−6). The fields of view of the CO(6−5) (Fig. B.3) and CO(7−6) (Fig. B.4) channel maps were restricted to the southeastern and central part of the nebula, in order to visualize the strong CO emission from the PDR better. Figures B.5 and B.6 show the channel maps for CO(6−5) and CO(7−6) but smoothed to the 16.̋1 resolution of the [C ii] data in order to capture the fainter emission in the northwestern part of the map better.
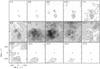 |
Fig. B.1 Velocity-channel map for CO(3−2) with contours at 2, 5, 10 to 80 K in steps of 10 K. The “+” shows the position of HD 37903. |
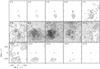 |
Fig. B.2 Velocity-channel map for CO(4−3) with contours at 2, 5, 10 to 110 K in steps of 10 K. The “+” shows the position of HD 37903. |
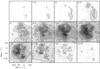 |
Fig. B.3 Velocity-channel map for CO(6−5) showing the southeastern and central part of the map with full resolution. The contour levels start at 10 K and go to 100 K in steps of 10 K. The “+” shows the position of HD 37903. |
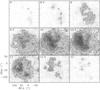 |
Fig. B.4 Velocity-channel map for CO(7−6) showing the southeastern and central part of the map with full resolution. The contour levels are at 15 K, and from 20 K to 100 K in steps of 10 K. The “+” shows the position of HD 37903. |
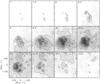 |
Fig. B.5 Velocity-channel map for CO(6−5) smoothed to 16.̋1 resolution showing the whole area that was mapped. The contour levels go from 8 K to 80 K in steps of 8 K. The “+” shows the position of HD 37903. |
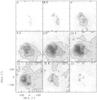 |
Fig. B.6 Velocity-channel map for CO(7−6) smoothed to 16.̋1 resolution showing the whole area that was mapped. The contour levels go from 6.3 K to 63 K in steps of 6.3 K. The “+” shows the position of HD 37903. |
CLASS is part of the Grenoble Image and Line Data Analysis Software (GILDAS), which is provided and actively developed by IRAM, and is available at http://www.iram.fr/IRAMFR/GILDAS
For gas at 100 K, the critical density for CO(11−10) is 4 × 105 cm-3, while it is 105 and 7 × 104 cm-3 for CO(7−6) and CO(6−5), respectively (Yang et al. 2010).
Acknowledgments
This research has made use of data from the Herschel Gould Belt survey (HGBS) project (http://gouldbelt-herschel.cea.fr). The HGBS is a Herschel key program jointly carried out by SPIRE Specialist Astronomy Group 3 (SAG 3), scientists of several institutes in the PACS Consortium (CEA Saclay, INAF-IFSI Rome and INAF-Arcetri, KU Leuven, MPIA Heidelberg), and scientists of the Herschel Science Center (HSC). We thank Dr. Michael Kaufman for valuable discussions about the physics and modeling of PDRs. We thank the referee, Dr. Michael Burton, for valuable criticism enabling us to improve the paper. A special thanks goes to Bill Vacca.
References
- André, Ph., Men‘shchikov, A., Bontemps, S., et al. 2010, A&A, 518, L102 [NASA ADS] [CrossRef] [EDP Sciences] [Google Scholar]
- Bernard-Salas, J., Habart, E., Arab, A., et al. 2012, A&A, 538, A37 [NASA ADS] [CrossRef] [EDP Sciences] [Google Scholar]
- Black, J. H., & van Dishoeck, E. F. 1987, ApJ, 322, 412 [NASA ADS] [CrossRef] [Google Scholar]
- Boreiko, L. T., & Betz, A. L. 1996, ApJ, 467, L113 [NASA ADS] [CrossRef] [Google Scholar]
- Burton, M. G., Hollenbach, D. J., & Tielens, A. G. G. M. 1990, ApJ, 365, 620 [NASA ADS] [CrossRef] [Google Scholar]
- Burton, M. G., Bulmer, M., Moorhouse, A., Geballe, T. R., & Brand, P. W. J. L. 1992, MNRAS, 257, 1 [NASA ADS] [CrossRef] [Google Scholar]
- Burton, M. G., Howe, J. E., Geballe, T. R., & Brand, P. W. J. L. 1998, PASA, 15, 194 [NASA ADS] [CrossRef] [Google Scholar]
- Cooksy, A. L., Blake, G. J., & Saykally, R. J. 1986, ApJ, 305, L89 [NASA ADS] [CrossRef] [Google Scholar]
- Draine, B., & Bertoldi, F. 1996, ApJ, 468, 269 [NASA ADS] [CrossRef] [EDP Sciences] [Google Scholar]
- Draine, B., & Bertoldi, F. 2000, in Molecular Hydrogen in Space, eds. F. Combes, & G. Pineau des Forêts (Cambridge: Cambridge Univ. Press), 131 [Google Scholar]
- Field, D., Gerin, M., Leach, S., et al. 1994, A&A, 286, 909 [NASA ADS] [Google Scholar]
- Field, D., Lemaire, J. L., Pineau des Forêts, G., et al. 1998, A&A, 333, 280 [NASA ADS] [Google Scholar]
- Fleming, B., France, K., Lupu, R. E., & McCandliss, S. R. 2010, ApJ, 725, 159 [NASA ADS] [CrossRef] [Google Scholar]
- Gatley, I., Hasegawa, T., Suzuki, H., et al. 1987, ApJ, 318, L73 [NASA ADS] [CrossRef] [Google Scholar]
- Graf, U. U., Simon, R.,Stutzki, J., et al. 2012, A&A, 542, L16 [NASA ADS] [CrossRef] [EDP Sciences] [Google Scholar]
- Güsten, R., Nyman, L. Å., Schilke, P., et al. 2006, A&A, 518, L79 [Google Scholar]
- Hasegawa, T., Gatley, I., Garden, R. P., et al. 1987, ApJ, 318, L77 [NASA ADS] [CrossRef] [Google Scholar]
- Heyminck, S., Graf, U. U., Güsten, R., et al. 2012, A&A, 542, L1 [NASA ADS] [CrossRef] [EDP Sciences] [Google Scholar]
- Hohle, M. M., Neuhäuser, R., & Schutz, B. F. 2010, Astron. Nachr., 331, 349 [NASA ADS] [CrossRef] [Google Scholar]
- Hollenbach, D. J., Takahashi, T., & Tielens, A. G. G. M. 1991, ApJ, 337, 192 [NASA ADS] [CrossRef] [Google Scholar]
- Howe, J. E., Jaffe, D. T., Genzel, R., & Stacey, G. J. 1991, ApJ, 373, 158 [NASA ADS] [CrossRef] [Google Scholar]
- Jaffe, D. T., Genzel, R., Harris, A. I., et al. 1990, ApJ, 353, 193 [NASA ADS] [CrossRef] [Google Scholar]
- Karska, A., Herpin, F., Bruderer, S., et al. 2014, A&A, 562, A45 [NASA ADS] [CrossRef] [EDP Sciences] [Google Scholar]
- Kasemann, C., Güsten, R., Heyminck, S.., et al. 2006, SPIE Conf. Ser., 6275 [Google Scholar]
- Kaufman, M. J., Wolfire, M. G., Hollenbach, D. J., & Luhman, M. L. 1999, ApJ, 527, 795 [NASA ADS] [CrossRef] [Google Scholar]
- Kaufman, M. J., Wolfire, M. G., & Hollenbach, D. J. 2006, ApJ, 644, 283 [NASA ADS] [CrossRef] [Google Scholar]
- Klein, B., Hochgürtel, S., Krämer, I., et al. 2012, A&A, 542, L3 [NASA ADS] [CrossRef] [EDP Sciences] [Google Scholar]
- Klein, T., Ciechanowicz, M., Leinz, C., et al. 2014, IEEE Trans. Terahertz Science and Technology, 4, 588 [NASA ADS] [CrossRef] [Google Scholar]
- Martini, P., Sellgren, K., & DePoy, D. L. 1999, ApJ, 526, 772 [NASA ADS] [CrossRef] [Google Scholar]
- McCartney, M. S. K., Brand, P.W. J. L., Burton, M. G., & Chrysostomou, A. 1999, MNRAS, 307, 315 [NASA ADS] [CrossRef] [Google Scholar]
- Meixner, M., & Tielens, A. G. G. M. 1993, ApJ, 405, 216 [NASA ADS] [CrossRef] [Google Scholar]
- Mookerjea, B., Sandell, G., Jarrett, T. H., & McMullin, J. P. 2009, A&A, 507, 1485 [NASA ADS] [CrossRef] [EDP Sciences] [Google Scholar]
- Müller, T., Okumura, K., & Klaas, U. 2011 PACS Photometer Passbands and Colour Correction Factors for various Source SEDs, Technical report PICCX-ME-TN-038 (Germany: MPE) [Google Scholar]
- Ossenkopf, V., Röllig, M., Neufeld, D. A., et al. 2013, A&A, 550, A57 [NASA ADS] [CrossRef] [EDP Sciences] [Google Scholar]
- Parravano, A., Hollenbach, D. J., & McKee, C. F. 2003, ApJ, 584, 797 [NASA ADS] [CrossRef] [Google Scholar]
- Peeters, E., Tielens, A. G. G. M., Allamandola, L. J., & Wolfire, M. G. 2012, ApJ, 747, 44 [NASA ADS] [CrossRef] [Google Scholar]
- Poglitsch, A., Waelkens, C., Geis, N., et al. 2010, A&A, 518, L2 [NASA ADS] [CrossRef] [EDP Sciences] [Google Scholar]
- Schöier, F. L., van der Tak, F. F. S., van Dishoeck, E. F., & Black, J. H. 2005, A&A, 432, 369 [NASA ADS] [CrossRef] [EDP Sciences] [Google Scholar]
- Sellgren, K. 1984, ApJ, 277, 623 [NASA ADS] [CrossRef] [Google Scholar]
- Sheffer, Y., Wolfire, M. G., Hollenbach, D. J., Kaufman, M. J., & Cordier, M. 2011, ApJ, 741, 45 [NASA ADS] [CrossRef] [Google Scholar]
- Stacey, G. J., Viscuso, P. J., Fuller, C. E., & Kurtz, N. T. 1985, ApJ, 289, 803 [NASA ADS] [CrossRef] [Google Scholar]
- Steiman-Cameron, T. Y., Haas, M. R., Tielens, A. G. G. M., & Burton, M. G. 1997, ApJ, 478, 261 [NASA ADS] [CrossRef] [Google Scholar]
- Takami, M., Usuda, T., Sugal, H., et al. 2000, ApJ, 529, 268 [NASA ADS] [CrossRef] [Google Scholar]
- Tielens, A. G. G. M., & Hollenbach, D. 1985, ApJ, 291, 722 [NASA ADS] [CrossRef] [Google Scholar]
- Trundle, C., Dufton, P. L., Hunter, I., et al. 2007, A&A, 471, 621 [Google Scholar]
- van der Tak, F. F. S., Black, J. H., Schoïer, F. L., Jansen, D. J., & van Dishoeck, E. F. 2007, A&A, 468, 627 [NASA ADS] [CrossRef] [EDP Sciences] [Google Scholar]
- Wyrowski, F., Walmsley, C. M., Goss, W. M., & Tielens, A. G. G. M. 2000, ApJ, 543, 245 [NASA ADS] [CrossRef] [Google Scholar]
- Yang, B., Stancil, P. C., Balakrishnan, N., & Forrey, R. C. 2010, ApJ, 218, 1062 [NASA ADS] [CrossRef] [Google Scholar]
All Tables
All Figures
|
Fig. 1 Integrated intensity image of the [C ii] line at 158 μm in color. Contours correspond to the tracers mentioned in the individual panels. The peak intensities (and contour levels as % of peak) are 8 μm continuum image: 5306 MJy sr-1 (2% to 10% (2.5% step), 10 to 50% (5% step), 50 to 100% (20% step)), PACS 70 μm 1.32 104 MJy/sr (10%, 20%, 30%, 45%, 50% to 100% (10% step)), C91α: 7.3 × 10⁻³ Jy/beam (5%, 20%, 30%, 45%, 50% to 100% in steps of 10%), H2 S(1): 7.3 × 10⁻²⁰ W cm-2/beam (10% to 90% in steps of 10%). The C91α image is from Wyrowski et al. (2000) and the H2 S(1) image is from Gatley et al. (1987). The offsets in all figures are measured in arcseconds relative to HD 37903, which is marked by a star symbol. |
| In the text | |
|
Fig. 2 Integrated intensity image of the [C ii] line at 158 μm in color. Contours correspond to the tracers mentioned in the individual panels. The contour levels are 13CO(3−2): (3−8), (10−13), (15−18)σ with σ = 4.2 K km s-1; CO(3−2): (3−8), 10, 15, 20, 25, 30, 32, 35, 38, 40 and 42 times σ = 5.1 K km s-1; CO(4−3): (3−8), 10, 12, 15, 18, 21, 24 times σ = 8.6 K km s-1; CO(6−5): 3, 5.5, 9.5, 11.5, 13, 15, 20, 25, 30, 35, 40 times σ = 5.4 K km s-1; CO(7−6): 4, 6, 11, 15, 18, 20, 22, 24, 26 times σ = 8.2 K km s-1; CO(11−10): 3, 5, 8, 10, 12, 15, 20, 22, 24, 26 times σ = 1.3 K km s-1. HD 37903 is marked by a star symbol. |
| In the text | |
|
Fig. 3 Velocity-channel maps for [C ii] in gray scale overlaid with contours at 5 and 10 K, and from there to 70 K in steps of 10 K. The “+” shows the position of HD 37903. |
| In the text | |
|
Fig. 4 Velocity-channel map for 13CO(3−2) in grayscale overlaid with contours at 2, 5, and 10 K, and from there to 50 K in steps of 10 K. The “+” shows the position of HD 37903. |
| In the text | |
|
Fig. 5 Position-velocity diagrams for [C ii], CO(4−3), 13CO(3−2), CO(6−5), and CO(7−6) along directions given by position angle, PA of 0, 90 and 135°. The contours are at 10% to 100% (in steps of 10%) of the maximum Tmb of each plot. For each column we give the maximum Tmb from top to bottom. For PA = 90° the values are 56.9, 72.8, 24.3, 69.5 and 54.9 K. For PA = 135° the values are 53.5, 80.5, 41.5, 78.2 and 62.3 K. For PA = 0° the values are 53.6, 64.3, 29.2, 56.6 and 43.3 K. HD 37903 is at 0′′. The position angle is measured counterclockwise from north. |
| In the text | |
|
Fig. 6 Velocity-channel map for CO(11−10) with contours at 2.5 to 30 K in steps of 5 K. The “+” shows the position of HD 37903. |
| In the text | |
|
Fig. 7 Position-velocity diagrams along selected directions for CO(11−10). The contour levels for PA = 90 and 135° are 10% to 100% (10% step) of the maximum Tmb of 18.4 and 18.8 K respectively. The contour levels for PA = 0° are 20% to 100% (20% step) of the maximum Tmb of 9 K. HD 37903 is at 0′′. |
| In the text | |
|
Fig. 8 Cartoon showing a simplified picture of hot, slowly expanding PDR region surrounding HD 37903. The surrounding cloud is shown in grey with denser gas having a darker shading. The hot molecular shell is shown in blue and the red shows the [C ii] PDR layer. In the southeast, where the C ii region expands into a dense, lumpy molecular cloud ridge the expansion is slowed down by the dense surrounding cloud, while it has expanded much further to the northwest. There are places where the PDR shell has broken through the cloud allowing radiation from the star to directly illuminate the cloud further out. |
| In the text | |
|
Fig. 9 Integrated intensity map of [C ii] (in color) overlayed with CO(11−10) and C91α contours in black and white respectively. For CO(11−10) the contours drawn are at 3, 5, 8, 10, 12, 15, 20, 22, 24, 26 times the value of σ = 1.3 K km s-1. For C91α contours are drawn at 5%, 20%, 30%, 45%, 50% to 100% in steps of 10% of the peak intensity of 7.3 × 10⁻³ Jy/beam. The star symbol marks the position of HD 37903. |
| In the text | |
|
Fig. 10 Comparison of [C ii], CO(11−10), CO(7−6), CO(6−5), and CO(4−3) spectra at selected positions in the NGC 2023 region. The CO(4−3) spectra are scaled by a factor of 1.5 for clarity. CO(11−10) is scaled by a factor of three and filled with grayscale. For clarity we omitted CO(11−10) for the panel (17,113), because the spectrum is rather noisy and a clear non-detection. The temperature scale is in Tmb (K). |
| In the text | |
|
Fig. 11 [13C ii] spectra calibrated in main beam brightness temperature and plotted on a common Vlsr scale of [13C ii]. On the left is the long integration HIFI spectrum toward HD 37903. The F = 2−1 is plotted in black and F = 1−0 in red overlaid with Gaussian fits in green. To the right is an average of all GREAT [C ii] spectra brighter than 35 K in the SE quadrant of our map of NGC 2023. The F = 2−1 line is clearly visible at Vlsr = 10.1 km s-1, see text. The temperature scale is in Tmb (K). |
| In the text | |
|
Fig. 12 Ratios of integrated intensity over the velocity range 9−12 km s-1. From left to right we show: a) CO(3−2)/CO(4−3); b) CO(6−5)/ CO(4−3); c) CO(11−10)/CO(6−5); and d) CO(11−10)/CO(7−6). The emission in CO(4−3) and CO(3−2) are dominated by the quiescent colder molecular cloud, while the higher J transitions trace the hot molecular shell. |
| In the text | |
|
Fig. 13 Intensity ratios based on synthetic models calculated using RADEX. The contours correspond to intensity ratios indicated in the panel as a function of the physical parameters. The ratios are color coded, with the solid line representing the low limit and the dashed one the high limit for each ratio as determined from the ratio plots in Fig. 12. The color coding and limits are as follows: black (6−5)/(4−3) 0.9 (solid) − 1.10 (dashed); red (11−10)/(7−6) 0.07 (solid) − 0.20 (dashed); green (11−10)/(6−5) 0.05 (solid) − 0.16 (dashed); magenta (3−2)/(4−3) 0.8 (solid) − 1.1 (dashed). The upper row corresponds to models for which Tkin and gas density (n(H2)) are varied keeping the column density (N(CO)) constant to the value indicated in the panel. In the lower row results models in which Tkin and N(CO) are varied and n(H2) are fixed to the values indicated in the panel. |
| In the text | |
|
Fig. 14 Contours of observed intensity ratios plotted on the intensity predictions as a function of hydrogen density nH and FUV radiation field (G0) from PDR models, for the selected positions in NGC 2023. The horizontal dashed lines correspond to FUV estimated using the stellar parameters as described in the text. |
| In the text | |
|
Fig. B.1 Velocity-channel map for CO(3−2) with contours at 2, 5, 10 to 80 K in steps of 10 K. The “+” shows the position of HD 37903. |
| In the text | |
|
Fig. B.2 Velocity-channel map for CO(4−3) with contours at 2, 5, 10 to 110 K in steps of 10 K. The “+” shows the position of HD 37903. |
| In the text | |
|
Fig. B.3 Velocity-channel map for CO(6−5) showing the southeastern and central part of the map with full resolution. The contour levels start at 10 K and go to 100 K in steps of 10 K. The “+” shows the position of HD 37903. |
| In the text | |
|
Fig. B.4 Velocity-channel map for CO(7−6) showing the southeastern and central part of the map with full resolution. The contour levels are at 15 K, and from 20 K to 100 K in steps of 10 K. The “+” shows the position of HD 37903. |
| In the text | |
|
Fig. B.5 Velocity-channel map for CO(6−5) smoothed to 16.̋1 resolution showing the whole area that was mapped. The contour levels go from 8 K to 80 K in steps of 8 K. The “+” shows the position of HD 37903. |
| In the text | |
|
Fig. B.6 Velocity-channel map for CO(7−6) smoothed to 16.̋1 resolution showing the whole area that was mapped. The contour levels go from 6.3 K to 63 K in steps of 6.3 K. The “+” shows the position of HD 37903. |
| In the text | |
Current usage metrics show cumulative count of Article Views (full-text article views including HTML views, PDF and ePub downloads, according to the available data) and Abstracts Views on Vision4Press platform.
Data correspond to usage on the plateform after 2015. The current usage metrics is available 48-96 hours after online publication and is updated daily on week days.
Initial download of the metrics may take a while.