Fig. 5
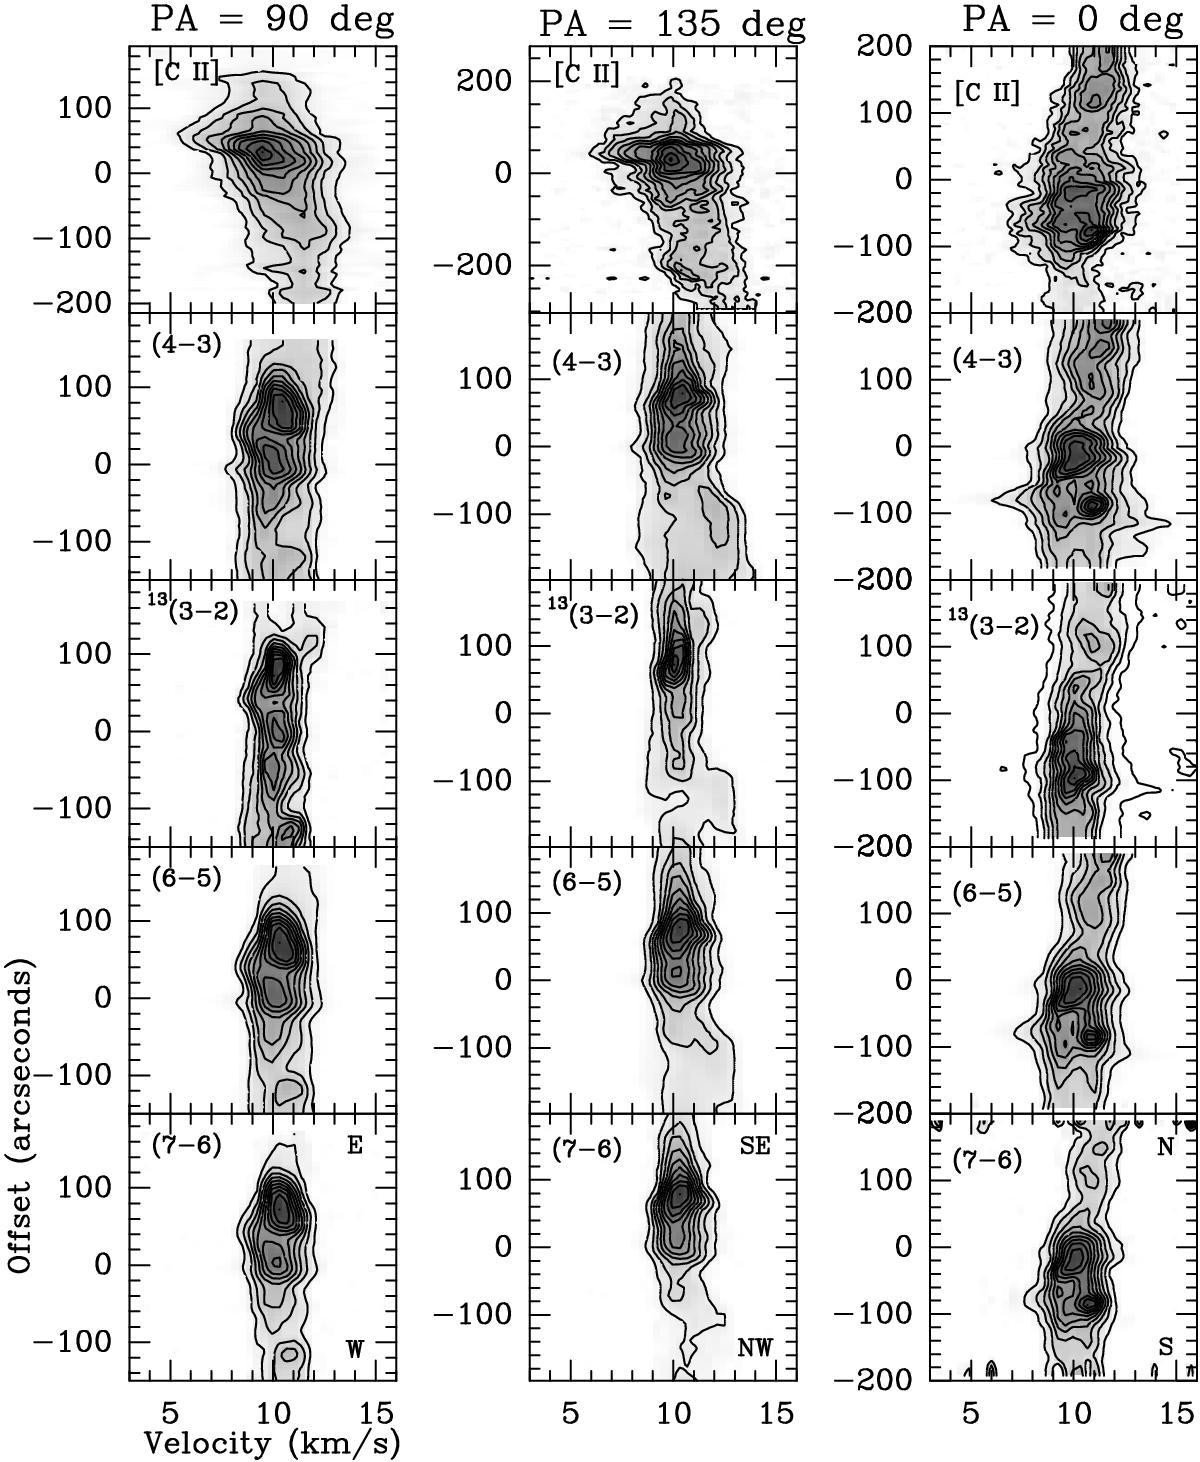
Position-velocity diagrams for [C ii], CO(4−3), 13CO(3−2), CO(6−5), and CO(7−6) along directions given by position angle, PA of 0, 90 and 135°. The contours are at 10% to 100% (in steps of 10%) of the maximum Tmb of each plot. For each column we give the maximum Tmb from top to bottom. For PA = 90° the values are 56.9, 72.8, 24.3, 69.5 and 54.9 K. For PA = 135° the values are 53.5, 80.5, 41.5, 78.2 and 62.3 K. For PA = 0° the values are 53.6, 64.3, 29.2, 56.6 and 43.3 K. HD 37903 is at 0′′. The position angle is measured counterclockwise from north.
Current usage metrics show cumulative count of Article Views (full-text article views including HTML views, PDF and ePub downloads, according to the available data) and Abstracts Views on Vision4Press platform.
Data correspond to usage on the plateform after 2015. The current usage metrics is available 48-96 hours after online publication and is updated daily on week days.
Initial download of the metrics may take a while.