Fig. 2
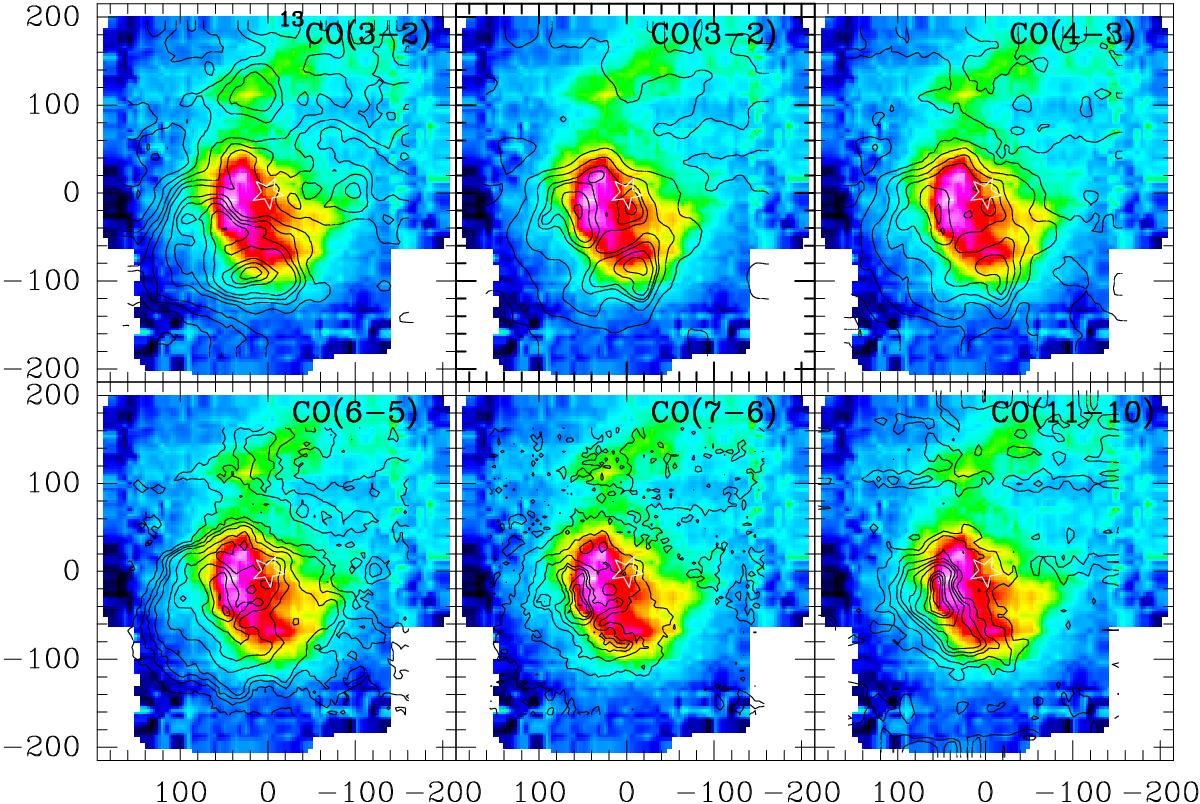
Integrated intensity image of the [C ii] line at 158 μm in color. Contours correspond to the tracers mentioned in the individual panels. The contour levels are 13CO(3−2): (3−8), (10−13), (15−18)σ with σ = 4.2 K km s-1; CO(3−2): (3−8), 10, 15, 20, 25, 30, 32, 35, 38, 40 and 42 times σ = 5.1 K km s-1; CO(4−3): (3−8), 10, 12, 15, 18, 21, 24 times σ = 8.6 K km s-1; CO(6−5): 3, 5.5, 9.5, 11.5, 13, 15, 20, 25, 30, 35, 40 times σ = 5.4 K km s-1; CO(7−6): 4, 6, 11, 15, 18, 20, 22, 24, 26 times σ = 8.2 K km s-1; CO(11−10): 3, 5, 8, 10, 12, 15, 20, 22, 24, 26 times σ = 1.3 K km s-1. HD 37903 is marked by a star symbol.
Current usage metrics show cumulative count of Article Views (full-text article views including HTML views, PDF and ePub downloads, according to the available data) and Abstracts Views on Vision4Press platform.
Data correspond to usage on the plateform after 2015. The current usage metrics is available 48-96 hours after online publication and is updated daily on week days.
Initial download of the metrics may take a while.