Fig. 1
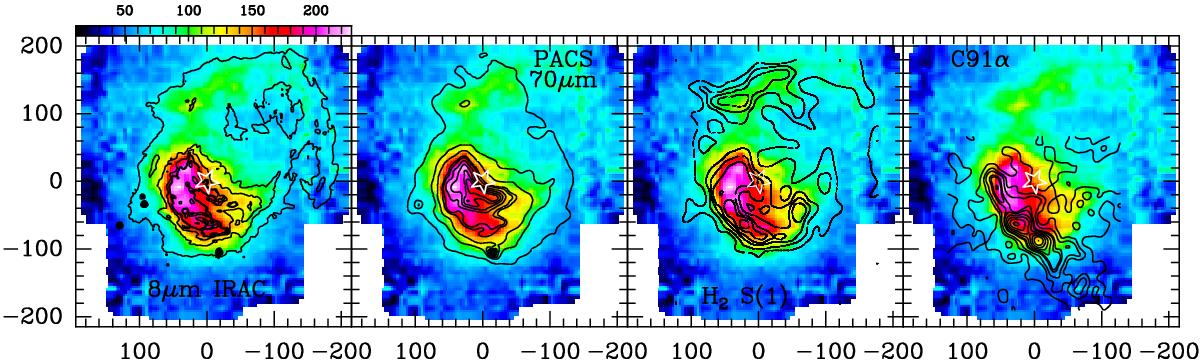
Integrated intensity image of the [C ii] line at 158 μm in color. Contours correspond to the tracers mentioned in the individual panels. The peak intensities (and contour levels as % of peak) are 8 μm continuum image: 5306 MJy sr-1 (2% to 10% (2.5% step), 10 to 50% (5% step), 50 to 100% (20% step)), PACS 70 μm 1.32 104 MJy/sr (10%, 20%, 30%, 45%, 50% to 100% (10% step)), C91α: 7.3 × 10⁻³ Jy/beam (5%, 20%, 30%, 45%, 50% to 100% in steps of 10%), H2 S(1): 7.3 × 10⁻²⁰ W cm-2/beam (10% to 90% in steps of 10%). The C91α image is from Wyrowski et al. (2000) and the H2 S(1) image is from Gatley et al. (1987). The offsets in all figures are measured in arcseconds relative to HD 37903, which is marked by a star symbol.
Current usage metrics show cumulative count of Article Views (full-text article views including HTML views, PDF and ePub downloads, according to the available data) and Abstracts Views on Vision4Press platform.
Data correspond to usage on the plateform after 2015. The current usage metrics is available 48-96 hours after online publication and is updated daily on week days.
Initial download of the metrics may take a while.