Fig. 13
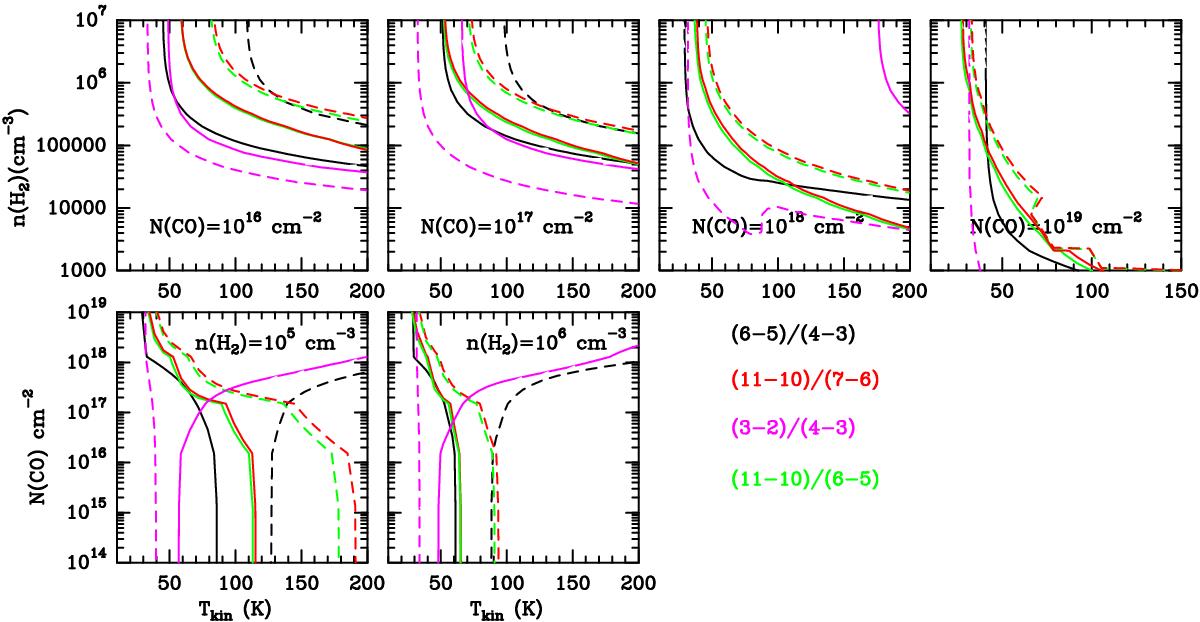
Intensity ratios based on synthetic models calculated using RADEX. The contours correspond to intensity ratios indicated in the panel as a function of the physical parameters. The ratios are color coded, with the solid line representing the low limit and the dashed one the high limit for each ratio as determined from the ratio plots in Fig. 12. The color coding and limits are as follows: black (6−5)/(4−3) 0.9 (solid) − 1.10 (dashed); red (11−10)/(7−6) 0.07 (solid) − 0.20 (dashed); green (11−10)/(6−5) 0.05 (solid) − 0.16 (dashed); magenta (3−2)/(4−3) 0.8 (solid) − 1.1 (dashed). The upper row corresponds to models for which Tkin and gas density (n(H2)) are varied keeping the column density (N(CO)) constant to the value indicated in the panel. In the lower row results models in which Tkin and N(CO) are varied and n(H2) are fixed to the values indicated in the panel.
Current usage metrics show cumulative count of Article Views (full-text article views including HTML views, PDF and ePub downloads, according to the available data) and Abstracts Views on Vision4Press platform.
Data correspond to usage on the plateform after 2015. The current usage metrics is available 48-96 hours after online publication and is updated daily on week days.
Initial download of the metrics may take a while.