Fig. 11
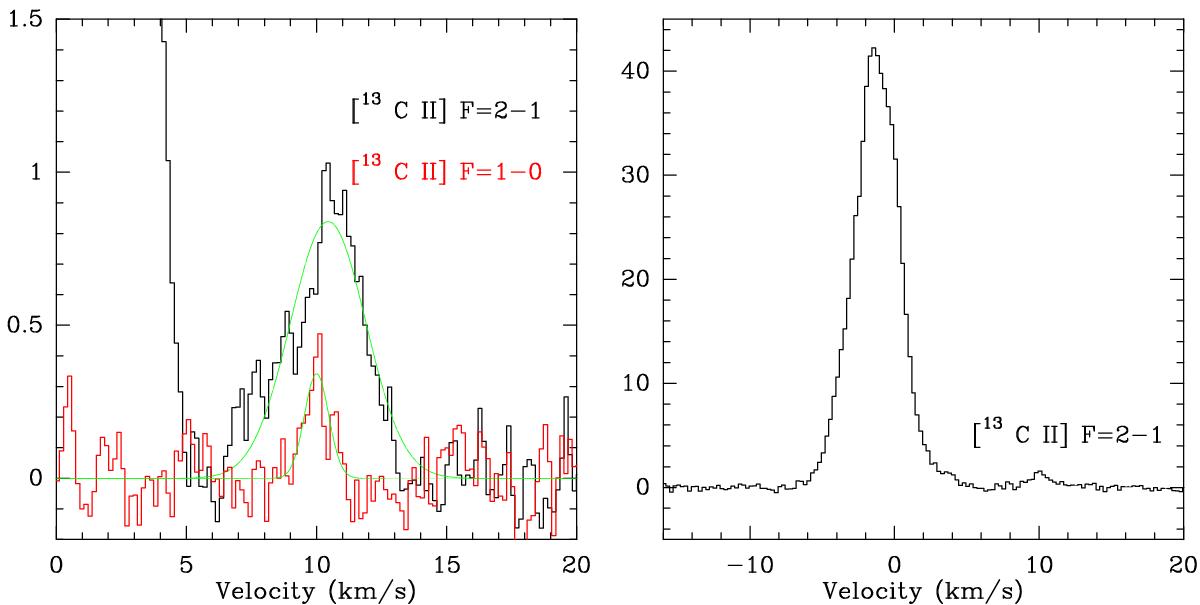
[13C ii] spectra calibrated in main beam brightness temperature and plotted on a common Vlsr scale of [13C ii]. On the left is the long integration HIFI spectrum toward HD 37903. The F = 2−1 is plotted in black and F = 1−0 in red overlaid with Gaussian fits in green. To the right is an average of all GREAT [C ii] spectra brighter than 35 K in the SE quadrant of our map of NGC 2023. The F = 2−1 line is clearly visible at Vlsr = 10.1 km s-1, see text. The temperature scale is in Tmb (K).
Current usage metrics show cumulative count of Article Views (full-text article views including HTML views, PDF and ePub downloads, according to the available data) and Abstracts Views on Vision4Press platform.
Data correspond to usage on the plateform after 2015. The current usage metrics is available 48-96 hours after online publication and is updated daily on week days.
Initial download of the metrics may take a while.