Fig. 9
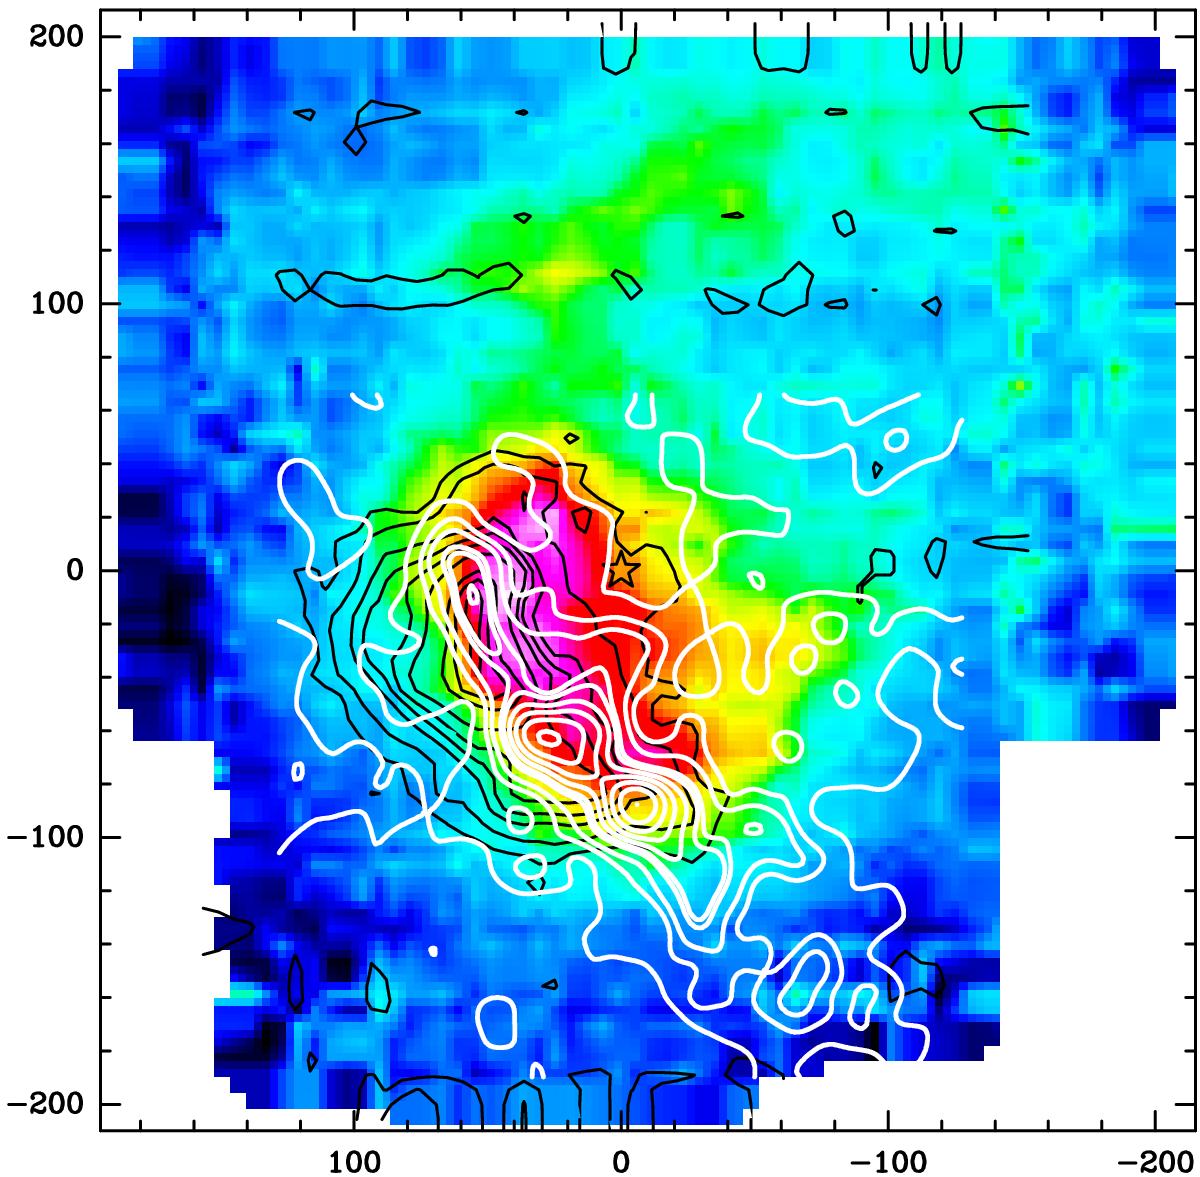
Integrated intensity map of [C ii] (in color) overlayed with CO(11−10) and C91α contours in black and white respectively. For CO(11−10) the contours drawn are at 3, 5, 8, 10, 12, 15, 20, 22, 24, 26 times the value of σ = 1.3 K km s-1. For C91α contours are drawn at 5%, 20%, 30%, 45%, 50% to 100% in steps of 10% of the peak intensity of 7.3 × 10⁻³ Jy/beam. The star symbol marks the position of HD 37903.
Current usage metrics show cumulative count of Article Views (full-text article views including HTML views, PDF and ePub downloads, according to the available data) and Abstracts Views on Vision4Press platform.
Data correspond to usage on the plateform after 2015. The current usage metrics is available 48-96 hours after online publication and is updated daily on week days.
Initial download of the metrics may take a while.