Free Access
Fig. 14
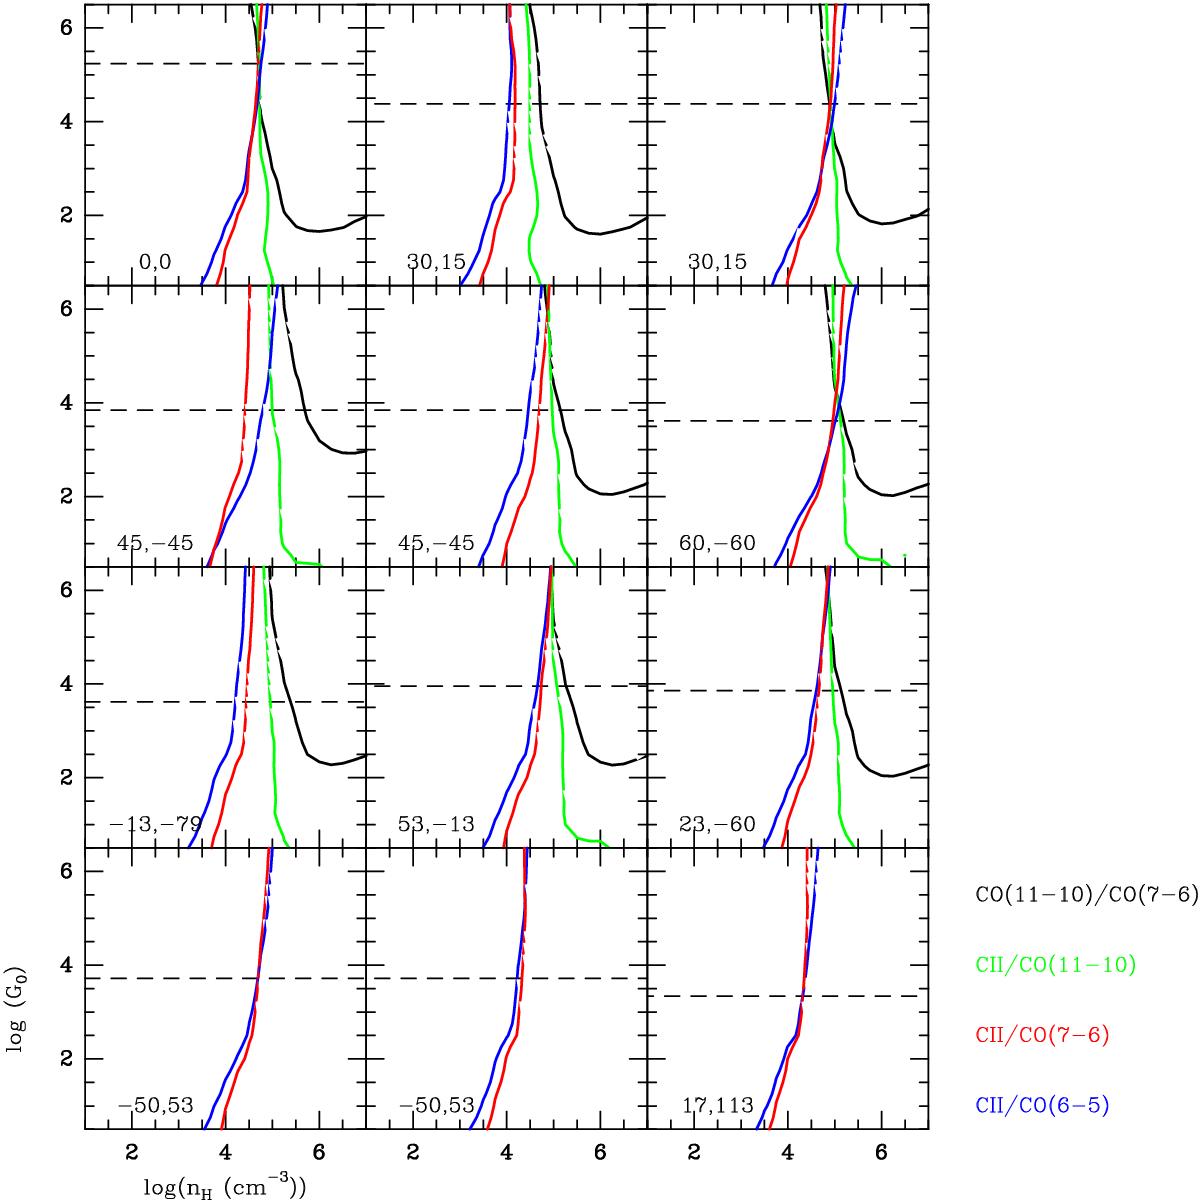
Contours of observed intensity ratios plotted on the intensity predictions as a function of hydrogen density nH and FUV radiation field (G0) from PDR models, for the selected positions in NGC 2023. The horizontal dashed lines correspond to FUV estimated using the stellar parameters as described in the text.
Current usage metrics show cumulative count of Article Views (full-text article views including HTML views, PDF and ePub downloads, according to the available data) and Abstracts Views on Vision4Press platform.
Data correspond to usage on the plateform after 2015. The current usage metrics is available 48-96 hours after online publication and is updated daily on week days.
Initial download of the metrics may take a while.