| Issue |
A&A
Volume 574, February 2015
|
|
|---|---|---|
| Article Number | A17 | |
| Number of page(s) | 10 | |
| Section | Stellar structure and evolution | |
| DOI | https://doi.org/10.1051/0004-6361/201424585 | |
| Published online | 16 January 2015 | |
Detecting non-uniform period spacings in the Kepler photometry of γ Doradus stars: methodology and case studies⋆,⋆⋆
1 Instituut voor Sterrenkunde, KU Leuven, Celestijnenlaan 200D, 3001 Leuven, Belgium
e-mail: This email address is being protected from spambots. You need JavaScript enabled to view it.
2 Department of Astrophysics, IMAPP, University of Nijmegen, PO Box 9010, 6500 GL Nijmegen, The Netherlands
3 Isaac Newton Group of Telescopes, Apartado de Correos 321, 387 00 Santa Cruz de la Palma, Canary Islands, Spain
Received: 11 July 2014
Accepted: 24 October 2014
Abstract
Context. The analysis of stellar oscillations is one of the most reliable ways to probe stellar interiors. Recent space missions such as Kepler have provided us with an opportunity to study these oscillations with unprecedented detail. For many multi-periodic pulsators such as γ Doradus stars, this led to the detection of dozens to hundreds of oscillation frequencies that could not be found from ground-based observations.
Aims. We aim to detect non-uniform period spacings in the Fourier spectra of a sample of γ Doradus stars observed by Kepler. Such detection is complicated by both the large number of significant frequencies in the space photometry and by overlapping non-equidistant rotationally split multiplets.
Methods. Guided by theoretical properties of gravity-mode oscillation of γ Doradus stars, we developed a period-spacing detection method and applied it to Kepler observations of a few stars, after having tested the performance from simulations.
Results. The application of the technique resulted in the clear detection of non-uniform period spacing series for three out of the five treated Kepler targets. Disadvantages of the technique are also discussed, and include the disability to distinguish between different values of the spherical degree and azimuthal order of the oscillation modes without additional theoretical modelling.
Conclusions. Despite the shortcomings, the method is shown to allow solid detections of period spacings for γ Doradus stars, which will allow future asteroseismic analyses of these stars.
Key words: asteroseismology / methods: data analysis / stars: fundamental parameters / stars: variables: general
Based on data gathered with the NASA Discovery mission Kepler and the HERMES spectrograph, which is installed at the Mercator Telescope, operated on the island of La Palma by the Flemish Community at the Spanish Observatorio del Roque de los Muchachos of the Instituto de Astrofísica de Canarias, and supported by the Fund for Scientific Research of Flanders (FWO), Belgium, the Research Council of KU Leuven, Belgium, the Fonds National de la Recherche Scientifique (F.R.S.-FNRS), Belgium, the Royal Observatory of Belgium, the Observatoire de Genève, Switzerland, and the Thüringer Landessternwarte Tautenburg, Germany.
Table A.1 is only available in electronic form at the CDS via anonymous ftp to cdsarc.u-strasbg.fr (130.79.128.5) or via http://cdsarc.u-strasbg.fr/viz-bin/qcat?J/A+A/574/A17
Postdoctoral Fellow of the Fund for Scientific Research (FWO), Flanders, Belgium.
© ESO, 2015
1. Introduction
Gamma Doradus pulsators are early F- to late A-type main-sequence stars. This places them directly within the transition region between low-mass stars with a fully convective envelope and higher-mass stars with a convective core. They exhibit non-radial gravity modes which are excited by the flux blocking mechanism at the base of their convective envelopes (e.g. Guzik et al. 2000; Dupret et al. 2005). The oscillations penetrate throughout the radiative zone between the stars’ convective core and envelope. The pulsation periods typically vary between 0.3 and 3 days (e.g. Kaye et al. 1999), though recently it has been predicted by theory that they can be shifted outside of this range because of rotation (Bouabid et al. 2013).
While various theoretical studies have been conducted on the internal structure of A- to F-type main-sequence stars, there have been few possibilities to verify the theoretical models observationally (e.g. Miglio et al. 2008, and references therein). Gamma Doradus pulsators have potential in this respect, since modelling of their oscillations would allow us to probe their internal structure (Miglio et al. 2008; Bouabid et al. 2013). Such successful modelling based on g-mode period spacings detected in space photometry has been accomplished for main-sequence B-type stars (e.g. Degroote et al. 2010; Savonije 2013; Pápics et al. 2014), sdB stars (e.g. Reed et al. 2011), subgiants and red giants (e.g. Beck et al. 2011, 2012; Bedding et al. 2011; Mosser et al. 2012; Deheuvels et al. 2014), thanks to data from the space missions CoRoT (Auvergne et al. 2009) and Kepler (Koch et al. 2010). Period spacings have been reported for very few AF-type main-sequence pulsators so far, e.g. Chapellier et al. (2012); Kurtz et al. (2014), while some detailed searches led to a failure to detect this important diagnostic (Hareter 2012; Breger et al. 2012) because of too poor frequency resolution of the data or too rapid rotation of the star.
For n ≫ l, with n the radial order and l the spherical degree of the mode, the first-order asymptotic approximation predicts the gravity modes to be equally spaced in period (Tassoul 1980). Chemical gradients induced by the changing size of the stellar core during the stars’ evolution (Miglio et al. 2008), as well as rotation and mixing processes (Bouabid et al. 2013) complicate this simple picture and lead to characteristic deviations from uniform period spacings.
In this paper, we present a method for detecting non-uniform period spacings in the frequency spectra of γ Doradus pulsators (Sect. 3), guided by some general theoretical expectations and previous observational studies of such stars (Sect. 2). We test the method on simulated light curves and apply it to Kepler data of five γ Doradus stars in Sect. 4. Finally, we summarise the methodology and give our conclusions and future prospects.
2. Theoretical expectations
In the first-order asymptotic approximation of a non-rotating star, the periods of high-order (n ≫ l) g-modes in stars with a convective core and a radiative envelope (Tassoul 1980) are defined as  (1)with
  (2)Here αl,g depends on the boundaries of the trapping region, P is the oscillation period, r the distance from the stellar centre, and N the Brunt-Väisälä frequency. Following this relation, modes with the same degree l, but consecutive orders n, are equidistantly spaced in period. Their spacing value ΔΠ is then given by
  (3)As a result, the expected period spacings for different l-values will have fixed ratios.
Several aspects, which are not treated in this simple approximation, influence the period spacings, however. For instance, during the star’s core-hydrogen burning phase, the convective core can either grow or shrink, depending on the star’s birth mass (Fig. 3.6 in Aerts et al. 2010). A growing convective core leads to a discontinuity in the chemical composition at its boundary, while a receding convective core leaves behind a μ-gradient zone near the core. Miglio et al. (2008) studied the impact of such a chemical gradient on the period spacings, discussing also in detail the way to define the convective boundary, which we therefore do not repeat here. The authors showed that the variation of the local average molecular weight leads to modifications of the g-mode resonance cavity. This mode trapping translates into characteristic dips in the period spacing pattern. The amplitude of the dips indicates the steepness of the chemical gradient, whereas the periodicity of the dips indicates its location. This is illustrated in Fig. 1, where we show the period spacing patterns calculated with the pulsation code GYRE (Townsend & Teitler 2013) for a 1.6 M⊙ star at different phases of its evolution. The models were computed with MESA version 6208 (Paxton et al. 2011, 2013). We used the standard MESA input physics with the Schwarzschild criterion for convection and an overshoot value of 0.014 local pressure scale heights in the formulation by Herwig (2000).
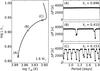 |
Fig. 1 Left: part of a 1.6 M⊙ evolution track, computed with MESA. Right: period spacing patterns computed for dipole modes of the marked models on the evolution track in the left plot. For each the hydrogen content of the core (Xc) is provided. |
Bouabid et al. (2013) further extended the work of Miglio et al. (2008), and included mixing processes and rotation. The internal mixing processes wash out the chemical gradient, which reduces the presence of the dips in the spacing pattern and decreases the average period spacing value, though there might still be dips present in the period spacing pattern. The influence of rotation varies from mode to mode. The period spacings of prograde modes, which travel in the direction of rotation, will become smaller because of the positive rotational frequency shift added to the oscillation frequencies in an inertial frame. Retrograde modes, which travel in the opposite direction of rotation, will have larger period spacings than zonal modes. This is illustrated in Fig. 2 for dipole modes. Diffusive mixing was taken into account according to standard MESA description (Paxton et al. 2011, 2013), while the frequency shifts resulting from rotation were computed using the approximation provided by Chlebowski (1978), which is too simplistic to model the frequencies of a real star in full detail but sufficiently appropriate to illustrate the effects of rotation on prograde and retrograde modes as is our purpose here.
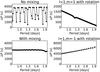 |
Fig. 2 Period spacing patterns computed for dipole modes of a 1.6 M⊙ star with Xc = 0.153. Left: spacing patterns with and without diffusive mixing. Right: spacing patterns including the effect of diffusive mixing for a star rotating with veq = 73 km s-1 for the prograde (top) and retrograde (bottom) modes. We note the difference of the scales on the y-axes. |
So far most of the mode identification studies of γ Doradus stars relied on spectroscopic time series (e.g. Brunsden et al. 2012; Davie et al. 2014). By far the most frequently found identification are progade dipole modes. We therefore expect to find period spacing patterns as described by Miglio et al. (2008) and Bouabid et al. (2013), corresponding to prograde dipole modes. These theoretical and spectroscopic results are used as a guide to develop a new method for the detection of period spacings from uninterrupted high-precision space photometry.
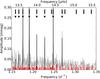 |
Fig. 3 Part of the Fourier transform (grey) of a simulated light curve. The full black vertical lines indicate the frequencies which were extracted using traditional prewhitening with S/N ≥ 8.0, while the red vertical lines indicate the remaining frequencies which were extracted with S/N ≥ 4.0. The thick black markers indicate the frequencies which were used as input, and the black triangles show which frequencies were extracted with our definition of the comparison criterion. |
3. The methodology
While it has long been known that γ Doradus stars are multi-periodic pulsators with at least a few modes (e.g. Handler 1999; Kaye et al. 1999; Cuypers et al. 2009), space-based observations revealed dozens to hundreds of oscillation frequencies for each star. This in principle should allow the detection of period spacing patterns. The high precision of the data implies that the prewhitening method to accept frequencies with an amplitude up to four times the local noise level in the Fourier transform, as originally suggested to detect high-frequency p-mode pulsations from ground-based photometric campaigns of δSct pulsators by Breger et al. (1993), is not necessarily suitable in the framework of space photometry data in general, and particularly not in the search for period spacings of g-mode pulsators (e.g. Balona 2014). It would lead to the extraction of frequency values that are seriously influenced by the preceding prewhitening. This is illustrated with simulations mimicking a typical Kepler light curve of a γDoradus star in our sample in Fig. 3. A lot of low-amplitude peaks are derived from the power spectrum of the simulated light curve and its subsequent prewhitening, while they are unrelated to the simulated signal. For this reason, recent analyses of Kepler photometry either do not use a stop criterion for the frequency analysis (e.g. Kurtz et al. 2014), or rely on a higher cutoff value than four times the local noise level. In Fig. 3, we show all frequencies whose amplitudes have a signal-to-noise (S/N) level above eight.
The suitable S/N cutoff value varies strongly from star to star, and is not known a priori. The reason is that for such high-quality data, noise is no longer the limiting factor for the accuracy of the result. Rather, small uncertainties in the frequency, amplitude and phase values when fitting sine functions to the light curve give rise to a residual signal. These residuals modulate the subsequently extracted frequency values and their influence keeps increasing during the iterative prewhitening procedure. This is our motivation to deduce a new stop criterion based on the comparison of the extracted frequencies with the original Fourier spectrum of the light curve. Hereafter, we call this the comparison criterion.
We first compute the amplitude Af of the extracted frequency f by fitting a sine function with that frequency to the light curve. Then we compare Af to the local amplitude Aloc of the Fourier spectrum for the frequency f, and only accept the extracted frequency if both amplitudes agree within a certain margin (see Fig. 4): 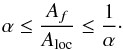 (4)Here α is given a reasonable value, which we found to be 0.5 for most stars. When the considered frequency peak does not fulfill this requirement, the frequency extraction is aborted. While it is likely that, with this criterion, the residuals of the light curve will still contain a lot of signal, the modulation of this signal by the preceding prewhitening may no longer be negligible. By taking α = 0.5, we are able to keep the number of detected false frequencies down to a minimum. For most γ Doradus stars the extracted frequencies are a good starting point for modelling, in the sense that they are sufficient to look for part of the period spacing series expected to be present in the data.
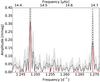 |
Fig. 4 The Fourier transform (full black curve) of a simulated light curve. Using the presented comparison criterion, the frequency extraction is aborted when the amplitude of an extracted frequency (full red vertical lines) does not agree with the original Fourier transform within a certain margin (grey area). The accepted frequencies are marked with dashed lines. |
Detecting non-uniform period spacings can be rather complicated, especially if two different series with a different average spacing overlap. However, there are several aspects which may facilitate the detection. It is for example well-known that the visibility of a stellar oscillation mode depends on its degree l and order m, and on the inclination angle and rotational velocity of the star (e.g. Chadid et al. 2001). As a result, many of the visible oscillation modes are likely to have similar values for l and m while differing in radial order. As we already noted in Sect. 2, we expect prograde sectoral modes with low l values to be the most easily visible (Townsend 2003). In addition, early F- to late A-type main-sequence stars are typically moderate to fast rotators. While this means that the rotational splitting of oscillation frequencies will be asymmetric and thus difficult to detect (especially considering the high density of the frequency spectra), it also entails that when the star is sufficiently fast rotating, its frequency splitting will be larger than the frequency region where the pulsation frequencies of similar slowly rotating pulsators would be located. As a result, we can detect groups of frequencies within the frequency spectra, each of which contains mostly frequencies with the same l and m values. Finally, many γ Doradus pulsators have strongly asymmetric light curves (Balona et al. 2011). As a result, several of the peaks we detect in the Fourier spectrum, correspond to combinations of oscillation frequencies rather than frequencies of individual pulsations (Balona 2012; Pápics 2012). We exclude these combination frequencies from the period spacing search.
One of the most efficient ways to detect period spacings for a typical γ Doradus star is to order the accepted oscillation periods and determine the spacings between them. It is likely that at least some adjacent accepted frequency peaks have the same values for l and m, making them part of the same (possibly non-uniform) period spacing series. When, on the other hand, the studied γ Doradus star is a slow rotator, the rotational splitting will likely be too small for this detection method to work. However, in this case we can look for spacings and/or splittings using other traditional methods, such as échelle diagrams (e.g. Grec et al. 1983; Mosser et al. 2013) because the spacing pattern will be more regular. Échelle diagrams are not useful for stars rotating such that their rotational frequency shifts no longer result in quasi-equidistant spacing patterns. Because of the expected non-uniform nature of the period spacings, detected spacing patterns should always be evaluated visually by the researcher.
After looking for period spacings, we iterate over the algorithm: we go back to the frequency extraction, but choose a different value for α. By iteratively choosing smaller values (e.g. from 0.4 to 0.05) we can extract more frequencies and systematically look for additional frequency peaks which match the found period spacing series. If no period spacings were detected (yet), it is possible that choosing a smaller value for α will help, though one must keep in mind that more noise peaks will be included as well, such that probability of detecting spurious period spacings will be higher. Going back to Fig. 3, we show the frequencies extracted with this proposed criterion compared to the classical signal-to-noise criterion for a simulated light curve. While the remaining low-amplitude input frequencies are also extracted with the classical criterion, the number of additional false frequencies is too high to allow for a reliable selection of the input frequencies.
A summary of our method is shown schematically in Fig. 5. The different steps of the method are further illustrated by applications on simulated data in the next section. The current version of our code does not allow us to formally identify l and m, with the exception of stars for which we detect rotational multiplets. This can only be achieved from comparing the detected series with theoretical model predictions.
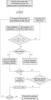 |
Fig. 5 Schematic summary of the methodology described in Sect. 3. While the values of α provided here work well for most γ Dor stars, they can of course be customised for individual stars. |
4. Applications
4.1. Simulations
We first evaluate our method on simulated data with two goals. First, we test that computing the differences between subsequent oscillation periods is a robust method for the detection of spacings for moderate to fast rotators. For slowly rotating stars, on the other hand, the use of échelle diagrams is more advantageous. Secondly, we show that the slope in the period spacing pattern induced by the rotation for prograde or retrograde modes is clearly detectable. For these tests, simulations simplified with respect to the complex physics of γ Doradus stars are sufficient. We therefore generated normalised light curves mimicking the results obtained by Miglio et al. (2008) and Bouabid et al. (2013): ![Mathematical equation: \begin{equation} F(t)\ \ =\ \ A\left(\left[1 + \sum_i a_i\sin\left(2\pi f_it + \phi_i \right)\right]^{2.2} - 1\right) + \sigma. \end{equation}](/articles/aa/full_html/2015/02/aa24585-14/aa24585-14-eq32.png) (5)Here, fi and φi are the frequency and phase of a particular oscillation mode i, A is the overall amplitude of the light curve, ai scales the amplitude of the pulsation mode i, and σ represents a level of Gaussian white noise, similar to what is observed in the Kepler data. The power 2.2 was used to simulate the asymmetry which is often seen in γ Doradus light curves (see also Balona et al. 2011). A typical set of frequencies fi was computed from a MESA model and the GYRE pulsation code for both dipole and quadrupole modes taking into account the frequency shifts caused by rotation (veq = 73 km s-1, i = 77deg, R = 1.7 R⊙) in the approximation by Chlebowski (1978). The full list of frequencies (Table A.1) is available in electronic form at the CDS. The light curve was simulated using the time stamps of real Kepler observations and converted to magnitude scale.
(5)Here, fi and φi are the frequency and phase of a particular oscillation mode i, A is the overall amplitude of the light curve, ai scales the amplitude of the pulsation mode i, and σ represents a level of Gaussian white noise, similar to what is observed in the Kepler data. The power 2.2 was used to simulate the asymmetry which is often seen in γ Doradus light curves (see also Balona et al. 2011). A typical set of frequencies fi was computed from a MESA model and the GYRE pulsation code for both dipole and quadrupole modes taking into account the frequency shifts caused by rotation (veq = 73 km s-1, i = 77deg, R = 1.7 R⊙) in the approximation by Chlebowski (1978). The full list of frequencies (Table A.1) is available in electronic form at the CDS. The light curve was simulated using the time stamps of real Kepler observations and converted to magnitude scale.
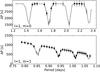 |
Fig. 6 Period spacings corresponding to several input frequencies in a simulated data set. The found spacings with α = 0.5 are indicated by black squares, while spacings found for other values of α (from 0.4 to 0.1) are represented by grey squares, and non-detected spacings by white dots. This is shown for both zonal (top) and prograde (bottom) dipole modes. |
We extracted the oscillation frequencies from the simulated data using a prewhitening method, as described by Degroote et al. (2009), in combination with the comparison criterion defined in Sect. 3, using α = 0.5. We took the frequency resolution fres as the formal error in the obtained frequency values. Since we included the effects of a moderate rotation velocity in this simulation, we searched for period spacing patterns by ordering the oscillation periods monotonically and by computing the differences between subsequent values. The results are shown in Fig. 6, together with the spacing patterns corresponding to the input frequencies. Since we cut off the iterative prewhitening relatively quickly, we only detected a fraction of the input frequencies. This is also illustrated in Fig. 7, where we show the fraction of detected input frequencies with respect to the number of prewhitened frequencies as well as the relative increase in the number of extracted noise frequencies. By using a comparison criterion with α = 0.5, the number of detected false frequencies is almost negligible. As such, the algorithm detected period spacings patterns at a high level of confidence.
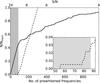 |
Fig. 7 Fraction of extracted to input frequencies as a function of the number of prewhitened frequencies (full black line). The dashed grey line indicates the relative number of detected noise frequencies as a function of the number of prewhitened frequencies when ignoring the comparison criterion. The upper axis provides the signal-to-noise ratio of the last extracted frequency. The shaded area indicates the number of accepted frequencies when adopting the comparison criterion with α = 0.5, for which the number of extracted noise peaks remains modest. |
In a second step we iteratively decreased the value of α from 0.4 to 0.1. This allowed us to extract more oscillation frequencies, which we could match with the period spacings that were already detected. As shown in Fig. 6, this allowed us to extend the period spacing series without including noise peaks.
For slowly rotating stars, period spacing patterns corresponding to different l and m values are more likely to overlap. In this case, the use of échelle diagrams is more robust for the detection of period spacings. To illustrate this, we have plotted the échelle diagram for the zonal dipole modes from our previous simulation in Fig. 8. The zonal dipole modes have not undergone any rotational frequency shifts and as shown in Fig. 8 they form several ridges in the échelle diagram. The phase differences between these ridges are caused by the smaller period spacings that are responsible for the dips in the period spacing pattern in Fig. 6. The detection of such phase-shifted ridges for a star in an échelle diagram is suitable to reveal the presence of a chemical gradient inside the star.
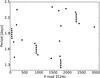 |
Fig. 8 Period échelle diagram showing the input frequencies of the zonal dipole modes from our simulated data. |
4.2. A well-studied Kepler star: KIC 11145123
We applied our method to the hybrid δ Sct / γ Dor pulsator KIC 11145123, which was studied by Kurtz et al. (2014). The authors showed the star to be a slow rotator (Prot ~ 100 d), exhibiting almost-uniform period spacings. A large number of rotationally split multiplets were clearly visible in the frequency spectrum, making this star a good test case for our approach.
For this star there are about four years (Q0-Q17) of Kepler data available. Given that the light curves obtained with the standard extraction algorithm and provided by the Mikulski Archive for Space Telescopes (MAST) were shown to complicate the analyses for g-mode pulators and lead to a fake instrumental low frequencies (Debosscher et al. 2013; Tkachenko et al. 2013a), we applied the light curve extraction code developed based on customised masks by one of us (S.B.) to the pixel data. The resulting light curve was then converted to magnitude scale and detrended for each quarter individually by subtracting a 1st- or 2nd-order polynomial. We concatenated the data from the different quarters and removed the outliers manually.
The pulsation frequencies of KIC 11145123 were extracted in the same way as for the simulated data, i.e. we performed prewhitening in combination with our comparison criterion described in Sect. 3. Since this star is such a slow rotator, we used the obtained frequency values in combination with échelle diagrams to look for period spacings and rotational splitting. As we can see in Fig. 9, we clearly detected part of the spacings and multiplets present in the data. Based on these initial results, we extracted and accepted additional frequencies, allowing us to extend the detected non-uniform period spacing series shown in Fig. 9.
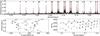 |
Fig. 9 Top: a close-up of the Fourier transform of KIC 11145123 (black) and the accepted oscillation periods (dashed red), showing the detected period spacings. The thick black markers indicate the frequencies that were extracted for α = 0.5. The amplitudes of some of the modes are ~3 mmag, but the figure is zoomed in for clarity. Bottom left: a close-up of the échelle diagram showing the detected prograde (squares), retrograde (circles) and zonal (triangles) dipole modes. The frequencies that were extracted with α = 0.5 are marked in black. Bottom right: the detected period spacings. For clarity, we shifted the spacings of the prograde and retrograde modes 150 s downwards and upwards, respectively. |
We were able to detect the same g-mode frequencies series as found by Kurtz et al. (2014), who used a classical prewhitening analysis without a stop criterion and considered only the 61 frequencies with the highest amplitude for their analysis. We could also detect most of the p-mode multiplets reported by these authors, as illustrated in Fig. 10. This is promising, given that our method was developed with the sole aim to detect non-uniform period spacing patterns. We also detected two (dipole) p-mode doublets, i.e. multiplets without a central peak, which were not listed by Kurtz et al. (2014) (Fig. 10). On the other hand, we did not detect one of the p-mode triplets found by Kurtz et al. (2014) in the sense that one of the frequencies listed by the authors (f = 23.516 d-1) was not extracted by us, independently of the value for α. Interestingly, the non-extracted frequency is part of one of the two multiplets which Kurtz et al. (2014) could not identify as modes with l ≤ 2 for their best model of 1.46 M⊙. Instead, these were listed as l = 6. We also found an additional frequency between the incomplete triplet and a quintuplet, as shown in the bottom plot in Fig. 10. The inclusion of this additional frequency leads to the detection of a larger multiplet. The extracted frequencies and splittings we found in addition to those reported by Kurtz et al. (2014) are listed in Table 1 and will be used in a separate modelling study of this star.
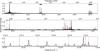 |
Fig. 10 Sections of the p-mode frequency spectrum of KIC 11145123 (black), with the detected frequencies marked by a dashed red line. Frequencies found for α = 0.5 are marked with thick black markers, whereas the one found by Kurtz et al. (2014) but not by us is indicated by a dashed line. The dotted lines indicate frequencies that we extracted, but Kurtz et al. (2014) did not. The triangles (black and white) indicate possible dipole doublets. The upper panel is zoomed in for clarity (the oscillation mode at 17.96 d-1 has an amplitude ~7.2 mmag). |
The application of our method to the light curve of KIC 11145123 has allowed us to accurately detect both the period spacing patterns and the rotational frequency splitting present in the data. We also found that the presented comparison criterion might be suitable for space-based observations of other types of variable stars, when combined with an adapted spacing pattern detection algorithm. However, this requires further extensive testing.
A least-squares fit for the additional p-mode frequencies (∗), which we found compared to the analysis by Kurtz et al. (2014), and for the other frequencies which are part of the same multiplets.
4.3. Four γ Dor stars in the Kepler field
We also applied the proposed method to four of the γ Doradus pulsators from the sample presented by Tkachenko et al. (2013a), for which we have both high-resolution spectroscopy and Kepler photometry at our disposal. For each of those four stars we have obtained four high-resolution spectra with the HERMES spectrograph (377−900 nm, R ~ 85 000, Raskin et al. 2011) at the 1.2 m Mercator Telescope (Observatorio del Roque de los Muchachos, La Palma, Canary Islands). These spectra were reduced with the dedicated HERMES pipeline, and subsequently normalised following the method described by Pápics et al. (2012). We used the improved least-squares deconvolution (LSD) algorithm (Tkachenko et al. 2013c) to compute high S/N average profiles from these spectroscopic observations. The LSD profiles were then checked for the presence of a binary companion and line profile variations, which confirmed that the four stars are single objects (see Table 2). We computed an average spectrum and analysed it to determine the fundamental and atmospheric parameters by means of the spectrum synthesis method implemented in the GSSP code (Lehmann et al. 2013; Tkachenko et al. 2013b). The advantages of using the average spectra are that (i) they have higher signal-to-noise ratios than the individual spectra, and (ii) line profile deformations due to the pulsations are largely smoothed out. The obtained values are listed in Table 2 and place the four stars in the γ Doradus strip.
Atmospheric parameter values obtained for the four γ Dor stars analysed in this study.
For KIC 5350598 and KIC 11721304 about four years of photometric observations (Q0-Q17) were obtained with Kepler, while for KIC 6185513 (Q0-Q1, Q10-Q12, Q14-Q16) and KIC 6778174 (Q0-Q1, Q10-Q17) about two years of observations are available. The pixel data were extracted, reduced and analysed in the same way as the data for KIC 11145123, as described in Sect. 4.2, and unless mentioned otherwise, α was taken to be 0.5. Using the obtained frequency values to compute the period spacing, we discuss the patterns for each star individually.
4.3.1. KIC 11721304
For KIC 11721304 we have detected a period spacing pattern with a clear slope, as shown in Fig. 11. The average period spacing (1200 s) is small compared to typical values for a non-rotating γDoradus star. These are of the order of 3000 s (l = 1) to 2000 s (l = 2), which implies that the pulsations in the detected series are prograde modes. The downward trend of the spacing pattern supports this interpretation.
In addition to the pulsation frequencies belonging to this spacing pattern, we also detected additional frequencies in the same range. These likely correspond with modes of different wavenumbers l and m, but firm conclusions about this requires detailed future modelling, taking into account various mixing processes. However, this kind of modelling is outside of the cope of the current research.
We saw in Sect. 3 that many γ Doradus stars have asymmetric light curves and that this leads to the appearance of linear combinations of the frequencies in their Fourier spectra. In general, we have to make sure that we did not include any of these combination frequencies in the period spacing series. This is not an issue in the case of KIC 11721304 because the combination frequencies are located sufficiently far from the detected period spacing series in the frequency domain (Fig. 12).
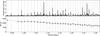 |
Fig. 11 Top: a close-up of part of the Fourier spectrum of KIC 11721304 (black). All the marked frequencies are accepted following the criterion described in Sect. 3, with α = 0.5. Bottom: the period spacing as computed from the accepted frequencies. The black markers and grey lines indicate the frequencies for which we find a smooth spacing pattern. |
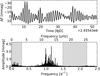 |
Fig. 12 Top: a small part of the light curve of KIC 11721304. Bottom: the Fourier spectrum (black) of KIC 11721304. The grey areas indicate the locations of the linear combinations of the oscillation frequencies, which arise because of the asymmetry of the light curve of KIC 11721304. |
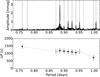 |
Fig. 13 Top: a close-up of the Fourier transform of the light curve of KIC 6678174 (black) and the accepted frequencies in the region where the detected period spacing series is located. The frequencies which were accepted for α = 0.5 are marked with full grey lines, and the ones for which α< 0.5 are marked with dotted lines. Bottom: the period spacing as computed for the (accepted) frequencies shown in the top. The white markers indicate the spacings for frequencies accepted for α< 0.5, while the dotted lines indicate the regions where there are likely frequencies missing. |
4.3.2. KIC 6678174
In the case of KIC 6678174, there is also a clear detection of a period spacing series, though the length of the found series is relatively short (Fig. 13). Similar to the period spacing series we detected for KIC 11721304, there are no dips present in the pattern and the value of the average spacing is similar. This seems to point to a common property in our sample of γDoradus stars (Tkachenko et al. 2013a), although it requires the analysis of the full sample to make any firm conclusions. Such extensive analysis study will be undertaken in the near future as a follow-up of the current methodological paper.
4.3.3. KIC 5350598 and KIC 6185513
For KIC 5350598 and KIC 6185513, we could not detect a period spacing pattern. The analyses suggest that the number of resolved oscillation frequencies is insufficient for these two stars to allow such a pattern. For KIC 5350598 we found frequencies that might be part of a spacing pattern, but there are too many missing frequencies in the series to arrive at a firm conclusion. These missing frequencies could be due excitation with lower amplitude than the other modes that could constitute a pattern but the present data set does not allow a firm conclusion.
For KIC 6185513, we arrive at a candidate spacing pattern with ΔP ~ 400 s for α ≤ 0.3. Even though this is consistent with the star’s vsini value (78 ± 11 km s-1), we treat the result with caution because the pattern consists of only eight frequencies and they are not consecutive as for the case of KIC 11721304.
5. Discussion and conclusions
In this study we have developed a method to detect reliable period spacings in the complex frequency spectra of γ Doradus stars. The various steps are as follows:
-
1.
Extract the frequencies from the light curve using aprewhitening method.
-
2.
Adopt a conservative stop criterion for the prewhitening procedure; we propose to use what we termed the comparison criterion given in Eq. (4), where α = 0.5 was found to be a suitable value for γ Doradus stars for the first iteration.
-
3.
Make a distinction between moderate to fast versus slow rotators when searching for the period spacing patterns. For the former, order the extracted oscillation periods monotonically and compute the differences between subsequent values to look for period spacings. For slow rotators, échelle diagrams were found to be the most robust method to search for period spacing patterns.
-
4.
Iterate over the method while lowering the value for α, allowing us to extract more frequencies from the data. If period spacings were already detected, use these as a guide to check which additional frequency values are reliable and to avoid the influence of frequencies due to noise. If no period spacings were detected yet, the extraction of additional frequency peaks at lower α could lead to a detection, though it is important to keep in mind that the detection of false frequencies due to noise also becomes more likely.
In the present study, we have taken a closer look at the results for KIC 11145123, a hybrid pulsator recently presented by Kurtz et al. (2014), and at four single γDoradus stars from the sample presented by Tkachenko et al. (2013a). From the application of our method on KIC 11145123 we deduced that the method excels in the exclusion of noise peaks. Because of this star’s slow rotation, we detected the frequency splittings and the period spacings using échelle diagrams. For two of the other four stars we studied, KIC 6678174 and KIC 11721304, we were able to detect period spacings that are completely in line with theoretical expectations as presented in Miglio et al. (2008) and Bouabid et al. (2013). The analysis of KIC 11721304 was particularly successful, resulting in a series of 35 pulsation periods, hinting towards strong mixing processes. The frequency analysis of the two additional stars did not lead to firm conclusions.
It is important to keep in mind that the method cannot be automated and it remains necessary for the user to check carefully any detected period spacing pattern. As such, the applicant should be familiar with the basic aspects of the theoretical expectations for non-uniform period spacings. Detected spacings should then be verified and interpreted in terms of interior physics using extensive grids of theoretical pulsation properties from a combination of stellar evolution and pulsation codes. Such modelling will also allow us to assign values to the pulsation parameters l and m.
Acknowledgments
The research leading to these results was based on funding from the Fund for Scientific Research of Flanders (FWO), Belgium, under grant agreement G.0B69.13 and from the European Community’s Seventh Framework Programme FP7-SPACE-2011-1, project number 312844 (SPACEINN). P.P. has received funding from the Research Fund KU Leuven. S.B. is supported by the Foundation for Fundamental Research on Matter (FOM), which is part of the Netherlands Organisation for Scientific Research (NWO). Funding for the Kepler mission is provided by NASA’s Science Mission Directorate. We thank the whole team for the development and operations of the mission. This research made use of the SIMBAD database and the VizieR catalogue access tool operated at CDS, Strasbourg, France, and the SAO/NASA Astrophysics Data System.
References
- Aerts, C., Christensen-Dalsgaard, J., & Kurtz, D. W. 2010, Asteroseismology, Astron. Astrophys. Lib. (Berlin, Heidelberg: Springer) [Google Scholar]
- Auvergne, M., Bodin, P., Boisnard, L., et al. 2009, A&A, 506, 411 [NASA ADS] [CrossRef] [EDP Sciences] [Google Scholar]
- Balona, L. A. 2012, MNRAS, 422, 1092 [NASA ADS] [CrossRef] [Google Scholar]
- Balona, L. A. 2014, MNRAS, 439, 3453 [NASA ADS] [CrossRef] [Google Scholar]
- Balona, L. A., Guzik, J. A., Uytterhoeven, K., et al. 2011, MNRAS, 415, 3531 [NASA ADS] [CrossRef] [Google Scholar]
- Beck, P. G., Bedding, T. R., Mosser, B., et al. 2011, Science, 332, 205 [NASA ADS] [CrossRef] [PubMed] [Google Scholar]
- Beck, P. G., Montalban, J., Kallinger, T., et al. 2012, Nature, 481, 55 [NASA ADS] [CrossRef] [Google Scholar]
- Bedding, T. R., Mosser, B., Huber, D., et al. 2011, Nature, 471, 608 [NASA ADS] [CrossRef] [PubMed] [Google Scholar]
- Bouabid, M.-P., Dupret, M.-A., Salmon, S., et al. 2013, MNRAS, 429, 2500 [NASA ADS] [CrossRef] [Google Scholar]
- Breger, M., Stich, J., Garrido, R., et al. 1993, A&A, 271, 482 [NASA ADS] [Google Scholar]
- Breger, M., Fossati, L., Balona, L., et al. 2012, ApJ, 759, 62 [NASA ADS] [CrossRef] [Google Scholar]
- Brunsden, E., Pollard, K. R., Cottrell, P. L., Wright, D. J., & De Cat, P. 2012, MNRAS, 427, 2512 [NASA ADS] [CrossRef] [Google Scholar]
- Chadid, M., De Ridder, J., Aerts, C., & Mathias, P. 2001, A&A, 375, 113 [NASA ADS] [CrossRef] [EDP Sciences] [Google Scholar]
- Chapellier, E., Mathias, P., Weiss, W. W., Le Contel, D., & Debosscher, J. 2012, A&A, 540, A117 [NASA ADS] [CrossRef] [EDP Sciences] [Google Scholar]
- Chlebowski, T. 1978, Acta Astron., 28, 441 [NASA ADS] [Google Scholar]
- Cuypers, J., Aerts, C., De Cat, P., et al. 2009, A&A, 499, 967 [NASA ADS] [CrossRef] [EDP Sciences] [Google Scholar]
- Davie, M. W., Pollard, K. R., Cottrell, P. L., et al. 2014, PASA, 31, 25 [NASA ADS] [Google Scholar]
- Debosscher, J., Aerts, C., Tkachenko, A., et al. 2013, A&A, 556, A56 [NASA ADS] [CrossRef] [EDP Sciences] [Google Scholar]
- Degroote, P., Briquet, M., Catala, C., et al. 2009, A&A, 506, 111 [NASA ADS] [CrossRef] [EDP Sciences] [Google Scholar]
- Degroote, P., Aerts, C., Baglin, A., et al. 2010, Nature, 464, 259 [NASA ADS] [CrossRef] [PubMed] [Google Scholar]
- Deheuvels, S., Doğan, G., Goupil, M. J., et al. 2014, A&A, 564, A27 [NASA ADS] [CrossRef] [EDP Sciences] [Google Scholar]
- Dupret, M.-A., Grigahcène, A., Garrido, R., Gabriel, M., & Scuflaire, R. 2005, A&A, 435, 927 [NASA ADS] [CrossRef] [EDP Sciences] [Google Scholar]
- Grec, G., Fossat, E., & Pomerantz, M. A. 1983, Sol. Phys., 82, 55 [NASA ADS] [CrossRef] [Google Scholar]
- Guzik, J. A., Kaye, A. B., Bradley, P. A., Cox, A. N., & Neuforge, C. 2000, ApJ, 542, L57 [NASA ADS] [CrossRef] [Google Scholar]
- Handler, G. 1999, MNRAS, 309, L19 [NASA ADS] [CrossRef] [Google Scholar]
- Hareter, M. 2012, Astron. Nachr., 333, 1048 [NASA ADS] [Google Scholar]
- Herwig, F. 2000, A&A, 360, 952 [NASA ADS] [Google Scholar]
- Kaye, A. B., Handler, G., Krisciunas, K., Poretti, E., & Zerbi, F. M. 1999, PASP, 111, 840 [NASA ADS] [CrossRef] [Google Scholar]
- Koch, D. G., Borucki, W. J., Basri, G., et al. 2010, ApJ, 713, L79 [NASA ADS] [CrossRef] [Google Scholar]
- Kurtz, D. W., Saio, H., Takata, M., et al. 2014, MNRAS, 444, 102 [NASA ADS] [CrossRef] [Google Scholar]
- Lehmann, H., Southworth, J., Tkachenko, A., & Pavlovski, K. 2013, A&A, 557, A79 [NASA ADS] [CrossRef] [EDP Sciences] [Google Scholar]
- Miglio, A., Montalbán, J., Noels, A., & Eggenberger, P. 2008, MNRAS, 386, 1487 [NASA ADS] [CrossRef] [Google Scholar]
- Mosser, B., Goupil, M. J., Belkacem, K., et al. 2012, A&A, 548, A10 [NASA ADS] [CrossRef] [EDP Sciences] [Google Scholar]
- Mosser, B., Michel, E., Belkacem, K., et al. 2013, A&A, 550, A126 [NASA ADS] [CrossRef] [EDP Sciences] [Google Scholar]
- Pápics, P. I. 2012, Astron. Nachr., 333, 1053 [NASA ADS] [CrossRef] [Google Scholar]
- Pápics, P. I., Briquet, M., Baglin, A., et al. 2012, A&A, 542, A55 [NASA ADS] [CrossRef] [EDP Sciences] [Google Scholar]
- Pápics, P. I., Moravveji, E., Aerts, C., et al. 2014, A&A, 570, A8 [NASA ADS] [CrossRef] [EDP Sciences] [Google Scholar]
- Paxton, B., Bildsten, L., Dotter, A., et al. 2011, ApJS, 192, 3 [Google Scholar]
- Paxton, B., Cantiello, M., Arras, P., et al. 2013, ApJS, 208, 4 [NASA ADS] [CrossRef] [Google Scholar]
- Raskin, G., van Winckel, H., Hensberge, H., et al. 2011, A&A, 526, A69 [NASA ADS] [CrossRef] [EDP Sciences] [Google Scholar]
- Reed, M. D., Baran, A., Quint, A. C., et al. 2011, MNRAS, 414, 2885 [Google Scholar]
- Savonije, G. J. 2013, A&A, 559, A25 [NASA ADS] [CrossRef] [EDP Sciences] [Google Scholar]
- Tassoul, M. 1980, ApJS, 43, 469 [NASA ADS] [CrossRef] [Google Scholar]
- Tkachenko, A., Aerts, C., Yakushechkin, A., et al. 2013a, A&A, 556, A52 [NASA ADS] [CrossRef] [EDP Sciences] [Google Scholar]
- Tkachenko, A., Lehmann, H., Smalley, B., & Uytterhoeven, K. 2013b, MNRAS, 431, 3685 [NASA ADS] [CrossRef] [Google Scholar]
- Tkachenko, A., Van Reeth, T., Tsymbal, V., et al. 2013c, A&A, 560, A37 [NASA ADS] [CrossRef] [EDP Sciences] [Google Scholar]
- Townsend, R. H. D. 2003, MNRAS, 343, 125 [NASA ADS] [CrossRef] [Google Scholar]
- Townsend, R. H. D., & Teitler, S. A. 2013, MNRAS, 435, 3406 [NASA ADS] [CrossRef] [Google Scholar]
All Tables
A least-squares fit for the additional p-mode frequencies (∗), which we found compared to the analysis by Kurtz et al. (2014), and for the other frequencies which are part of the same multiplets.
Atmospheric parameter values obtained for the four γ Dor stars analysed in this study.
All Figures
|
Fig. 1 Left: part of a 1.6 M⊙ evolution track, computed with MESA. Right: period spacing patterns computed for dipole modes of the marked models on the evolution track in the left plot. For each the hydrogen content of the core (Xc) is provided. |
| In the text | |
|
Fig. 2 Period spacing patterns computed for dipole modes of a 1.6 M⊙ star with Xc = 0.153. Left: spacing patterns with and without diffusive mixing. Right: spacing patterns including the effect of diffusive mixing for a star rotating with veq = 73 km s-1 for the prograde (top) and retrograde (bottom) modes. We note the difference of the scales on the y-axes. |
| In the text | |
|
Fig. 3 Part of the Fourier transform (grey) of a simulated light curve. The full black vertical lines indicate the frequencies which were extracted using traditional prewhitening with S/N ≥ 8.0, while the red vertical lines indicate the remaining frequencies which were extracted with S/N ≥ 4.0. The thick black markers indicate the frequencies which were used as input, and the black triangles show which frequencies were extracted with our definition of the comparison criterion. |
| In the text | |
|
Fig. 4 The Fourier transform (full black curve) of a simulated light curve. Using the presented comparison criterion, the frequency extraction is aborted when the amplitude of an extracted frequency (full red vertical lines) does not agree with the original Fourier transform within a certain margin (grey area). The accepted frequencies are marked with dashed lines. |
| In the text | |
|
Fig. 5 Schematic summary of the methodology described in Sect. 3. While the values of α provided here work well for most γ Dor stars, they can of course be customised for individual stars. |
| In the text | |
|
Fig. 6 Period spacings corresponding to several input frequencies in a simulated data set. The found spacings with α = 0.5 are indicated by black squares, while spacings found for other values of α (from 0.4 to 0.1) are represented by grey squares, and non-detected spacings by white dots. This is shown for both zonal (top) and prograde (bottom) dipole modes. |
| In the text | |
|
Fig. 7 Fraction of extracted to input frequencies as a function of the number of prewhitened frequencies (full black line). The dashed grey line indicates the relative number of detected noise frequencies as a function of the number of prewhitened frequencies when ignoring the comparison criterion. The upper axis provides the signal-to-noise ratio of the last extracted frequency. The shaded area indicates the number of accepted frequencies when adopting the comparison criterion with α = 0.5, for which the number of extracted noise peaks remains modest. |
| In the text | |
|
Fig. 8 Period échelle diagram showing the input frequencies of the zonal dipole modes from our simulated data. |
| In the text | |
|
Fig. 9 Top: a close-up of the Fourier transform of KIC 11145123 (black) and the accepted oscillation periods (dashed red), showing the detected period spacings. The thick black markers indicate the frequencies that were extracted for α = 0.5. The amplitudes of some of the modes are ~3 mmag, but the figure is zoomed in for clarity. Bottom left: a close-up of the échelle diagram showing the detected prograde (squares), retrograde (circles) and zonal (triangles) dipole modes. The frequencies that were extracted with α = 0.5 are marked in black. Bottom right: the detected period spacings. For clarity, we shifted the spacings of the prograde and retrograde modes 150 s downwards and upwards, respectively. |
| In the text | |
|
Fig. 10 Sections of the p-mode frequency spectrum of KIC 11145123 (black), with the detected frequencies marked by a dashed red line. Frequencies found for α = 0.5 are marked with thick black markers, whereas the one found by Kurtz et al. (2014) but not by us is indicated by a dashed line. The dotted lines indicate frequencies that we extracted, but Kurtz et al. (2014) did not. The triangles (black and white) indicate possible dipole doublets. The upper panel is zoomed in for clarity (the oscillation mode at 17.96 d-1 has an amplitude ~7.2 mmag). |
| In the text | |
|
Fig. 11 Top: a close-up of part of the Fourier spectrum of KIC 11721304 (black). All the marked frequencies are accepted following the criterion described in Sect. 3, with α = 0.5. Bottom: the period spacing as computed from the accepted frequencies. The black markers and grey lines indicate the frequencies for which we find a smooth spacing pattern. |
| In the text | |
|
Fig. 12 Top: a small part of the light curve of KIC 11721304. Bottom: the Fourier spectrum (black) of KIC 11721304. The grey areas indicate the locations of the linear combinations of the oscillation frequencies, which arise because of the asymmetry of the light curve of KIC 11721304. |
| In the text | |
|
Fig. 13 Top: a close-up of the Fourier transform of the light curve of KIC 6678174 (black) and the accepted frequencies in the region where the detected period spacing series is located. The frequencies which were accepted for α = 0.5 are marked with full grey lines, and the ones for which α< 0.5 are marked with dotted lines. Bottom: the period spacing as computed for the (accepted) frequencies shown in the top. The white markers indicate the spacings for frequencies accepted for α< 0.5, while the dotted lines indicate the regions where there are likely frequencies missing. |
| In the text | |
Current usage metrics show cumulative count of Article Views (full-text article views including HTML views, PDF and ePub downloads, according to the available data) and Abstracts Views on Vision4Press platform.
Data correspond to usage on the plateform after 2015. The current usage metrics is available 48-96 hours after online publication and is updated daily on week days.
Initial download of the metrics may take a while.