Free Access
Fig. 12
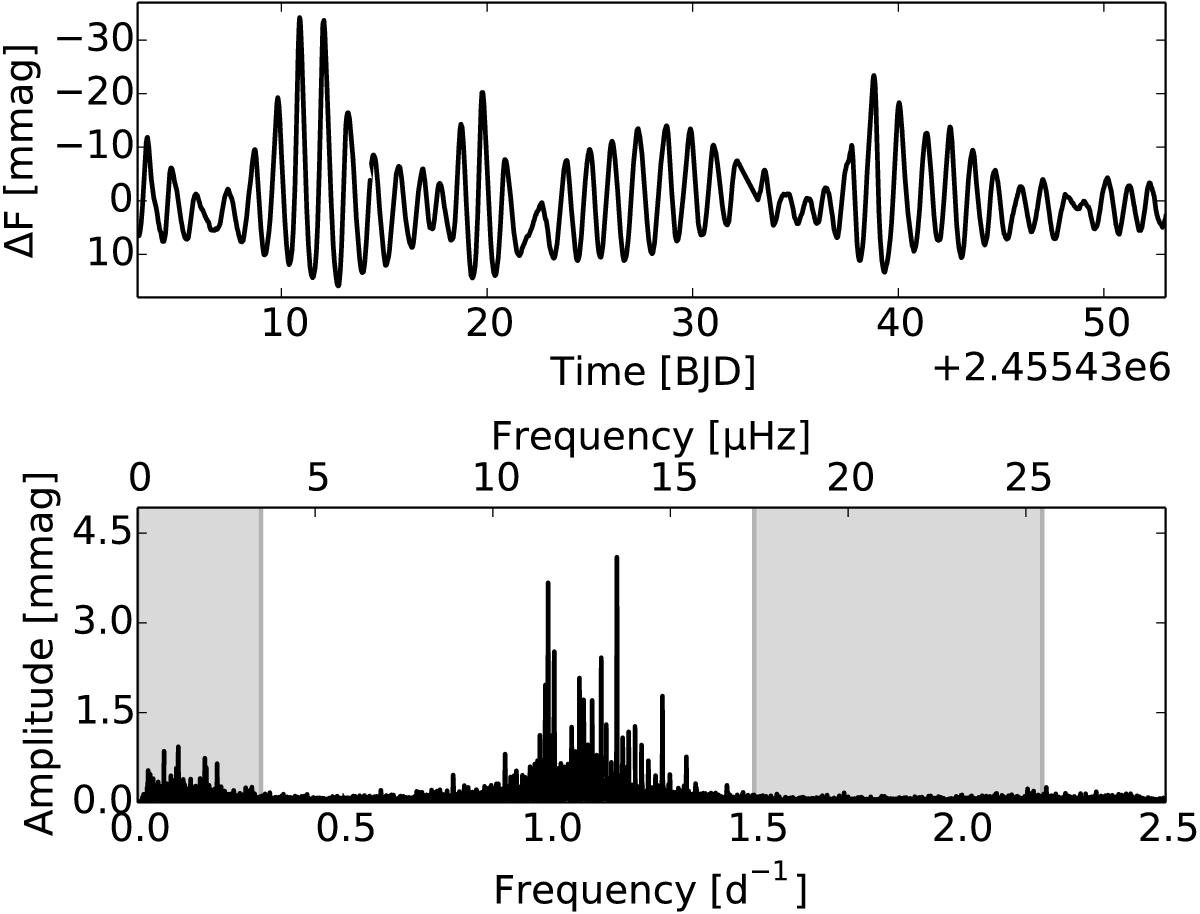
Top: a small part of the light curve of KIC 11721304. Bottom: the Fourier spectrum (black) of KIC 11721304. The grey areas indicate the locations of the linear combinations of the oscillation frequencies, which arise because of the asymmetry of the light curve of KIC 11721304.
Current usage metrics show cumulative count of Article Views (full-text article views including HTML views, PDF and ePub downloads, according to the available data) and Abstracts Views on Vision4Press platform.
Data correspond to usage on the plateform after 2015. The current usage metrics is available 48-96 hours after online publication and is updated daily on week days.
Initial download of the metrics may take a while.