Fig. 9
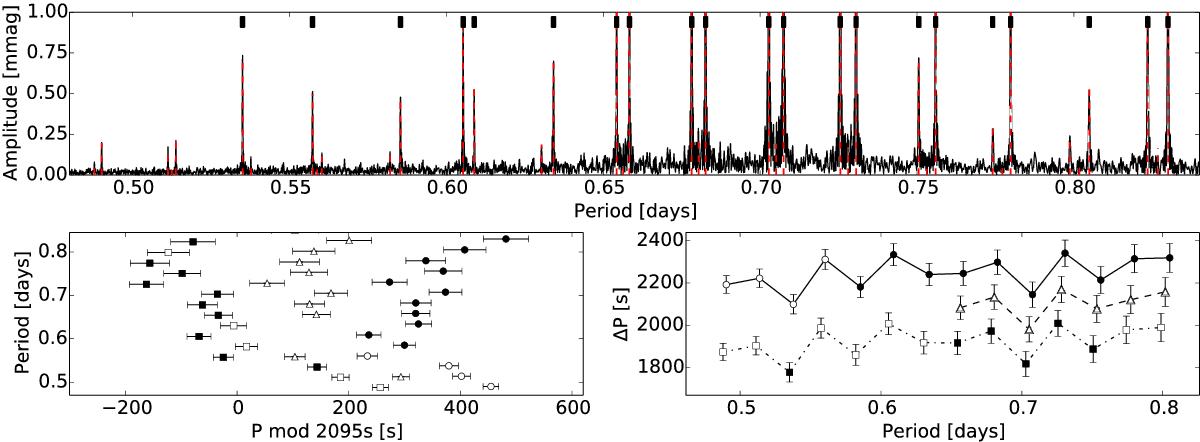
Top: a close-up of the Fourier transform of KIC 11145123 (black) and the accepted oscillation periods (dashed red), showing the detected period spacings. The thick black markers indicate the frequencies that were extracted for α = 0.5. The amplitudes of some of the modes are ~3 mmag, but the figure is zoomed in for clarity. Bottom left: a close-up of the échelle diagram showing the detected prograde (squares), retrograde (circles) and zonal (triangles) dipole modes. The frequencies that were extracted with α = 0.5 are marked in black. Bottom right: the detected period spacings. For clarity, we shifted the spacings of the prograde and retrograde modes 150 s downwards and upwards, respectively.
Current usage metrics show cumulative count of Article Views (full-text article views including HTML views, PDF and ePub downloads, according to the available data) and Abstracts Views on Vision4Press platform.
Data correspond to usage on the plateform after 2015. The current usage metrics is available 48-96 hours after online publication and is updated daily on week days.
Initial download of the metrics may take a while.