Fig. 13
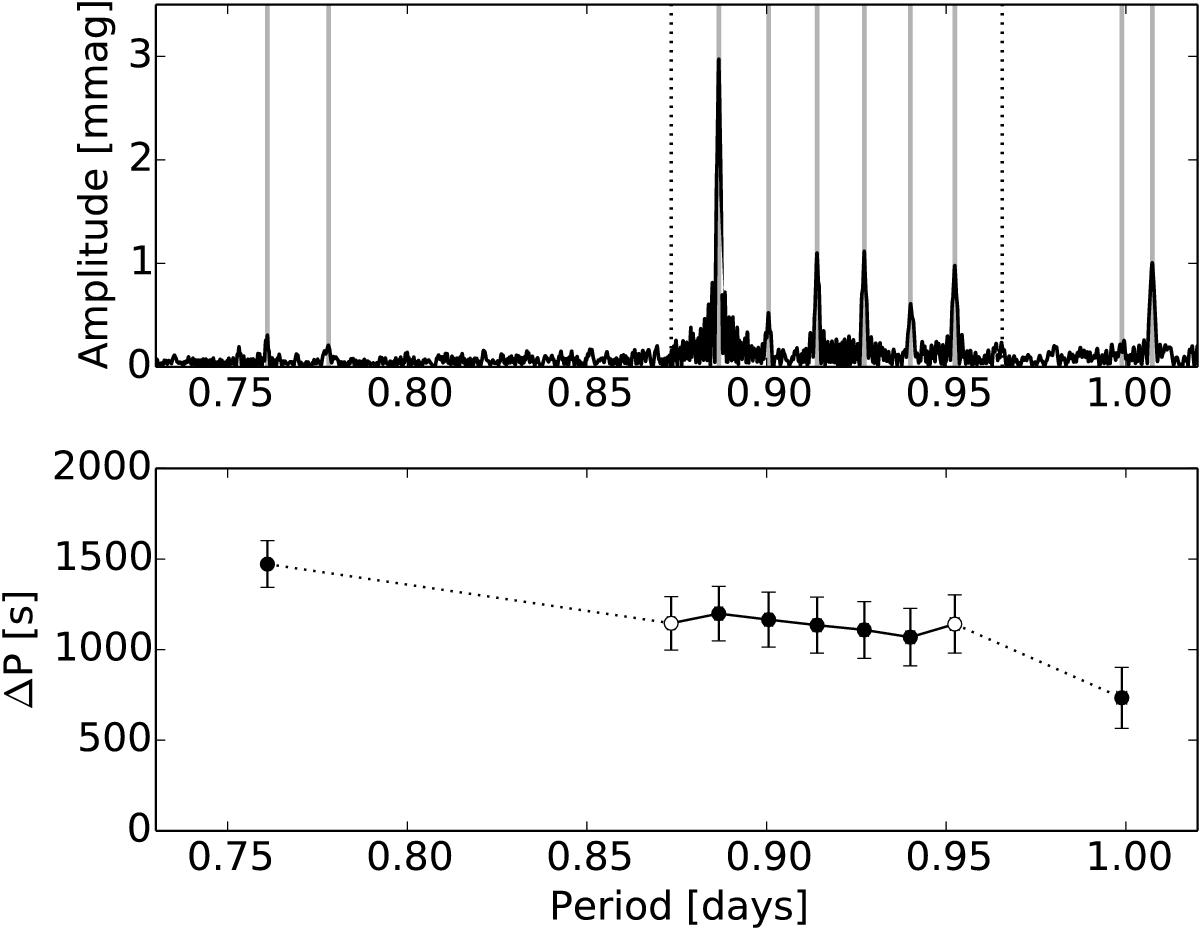
Top: a close-up of the Fourier transform of the light curve of KIC 6678174 (black) and the accepted frequencies in the region where the detected period spacing series is located. The frequencies which were accepted for α = 0.5 are marked with full grey lines, and the ones for which α< 0.5 are marked with dotted lines. Bottom: the period spacing as computed for the (accepted) frequencies shown in the top. The white markers indicate the spacings for frequencies accepted for α< 0.5, while the dotted lines indicate the regions where there are likely frequencies missing.
Current usage metrics show cumulative count of Article Views (full-text article views including HTML views, PDF and ePub downloads, according to the available data) and Abstracts Views on Vision4Press platform.
Data correspond to usage on the plateform after 2015. The current usage metrics is available 48-96 hours after online publication and is updated daily on week days.
Initial download of the metrics may take a while.