Free Access
Fig. 1
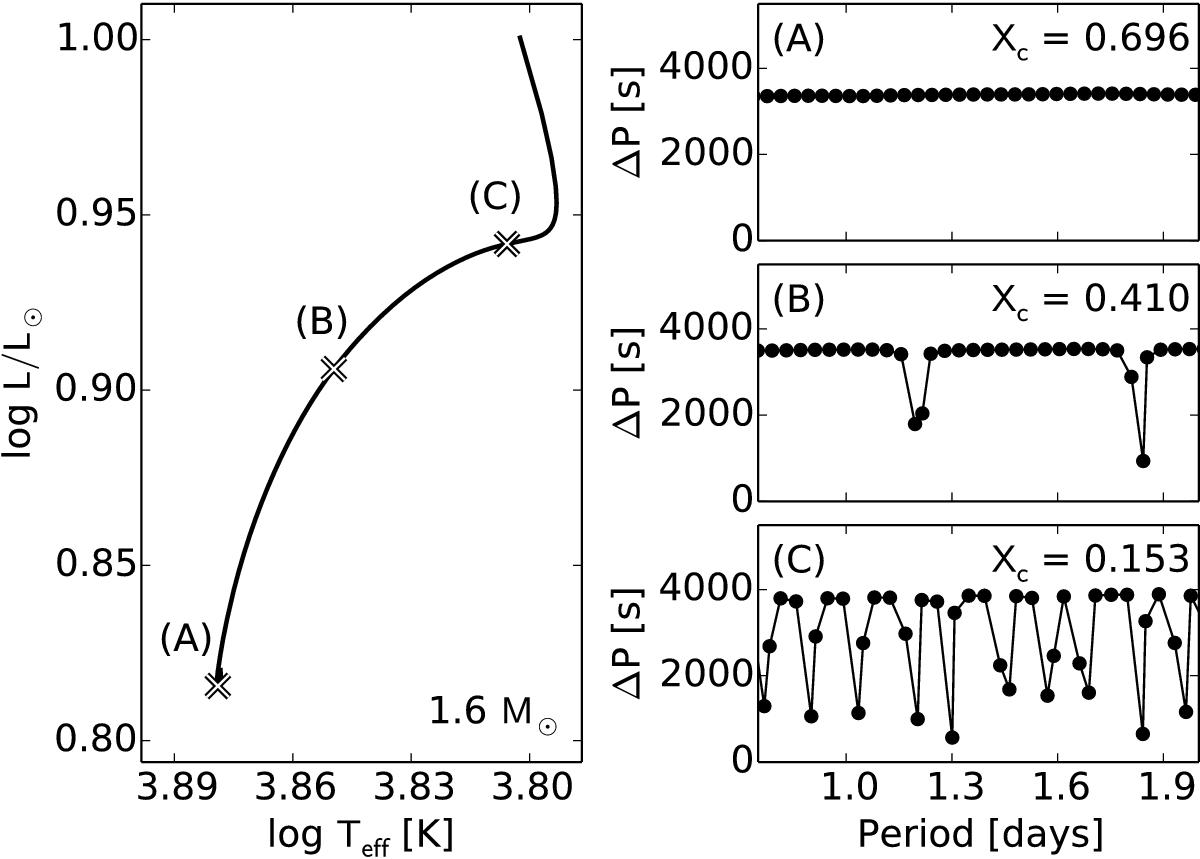
Left: part of a 1.6 M⊙ evolution track, computed with MESA. Right: period spacing patterns computed for dipole modes of the marked models on the evolution track in the left plot. For each the hydrogen content of the core (Xc) is provided.
Current usage metrics show cumulative count of Article Views (full-text article views including HTML views, PDF and ePub downloads, according to the available data) and Abstracts Views on Vision4Press platform.
Data correspond to usage on the plateform after 2015. The current usage metrics is available 48-96 hours after online publication and is updated daily on week days.
Initial download of the metrics may take a while.