Fig. 10
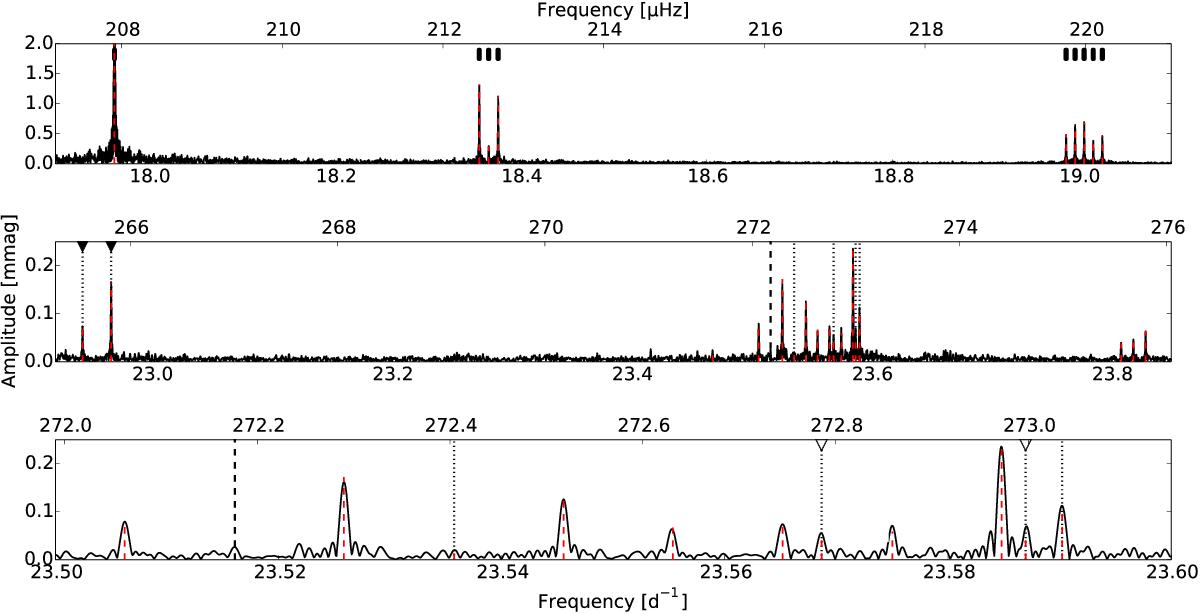
Sections of the p-mode frequency spectrum of KIC 11145123 (black), with the detected frequencies marked by a dashed red line. Frequencies found for α = 0.5 are marked with thick black markers, whereas the one found by Kurtz et al. (2014) but not by us is indicated by a dashed line. The dotted lines indicate frequencies that we extracted, but Kurtz et al. (2014) did not. The triangles (black and white) indicate possible dipole doublets. The upper panel is zoomed in for clarity (the oscillation mode at 17.96 d-1 has an amplitude ~7.2 mmag).
Current usage metrics show cumulative count of Article Views (full-text article views including HTML views, PDF and ePub downloads, according to the available data) and Abstracts Views on Vision4Press platform.
Data correspond to usage on the plateform after 2015. The current usage metrics is available 48-96 hours after online publication and is updated daily on week days.
Initial download of the metrics may take a while.