Fig. 4
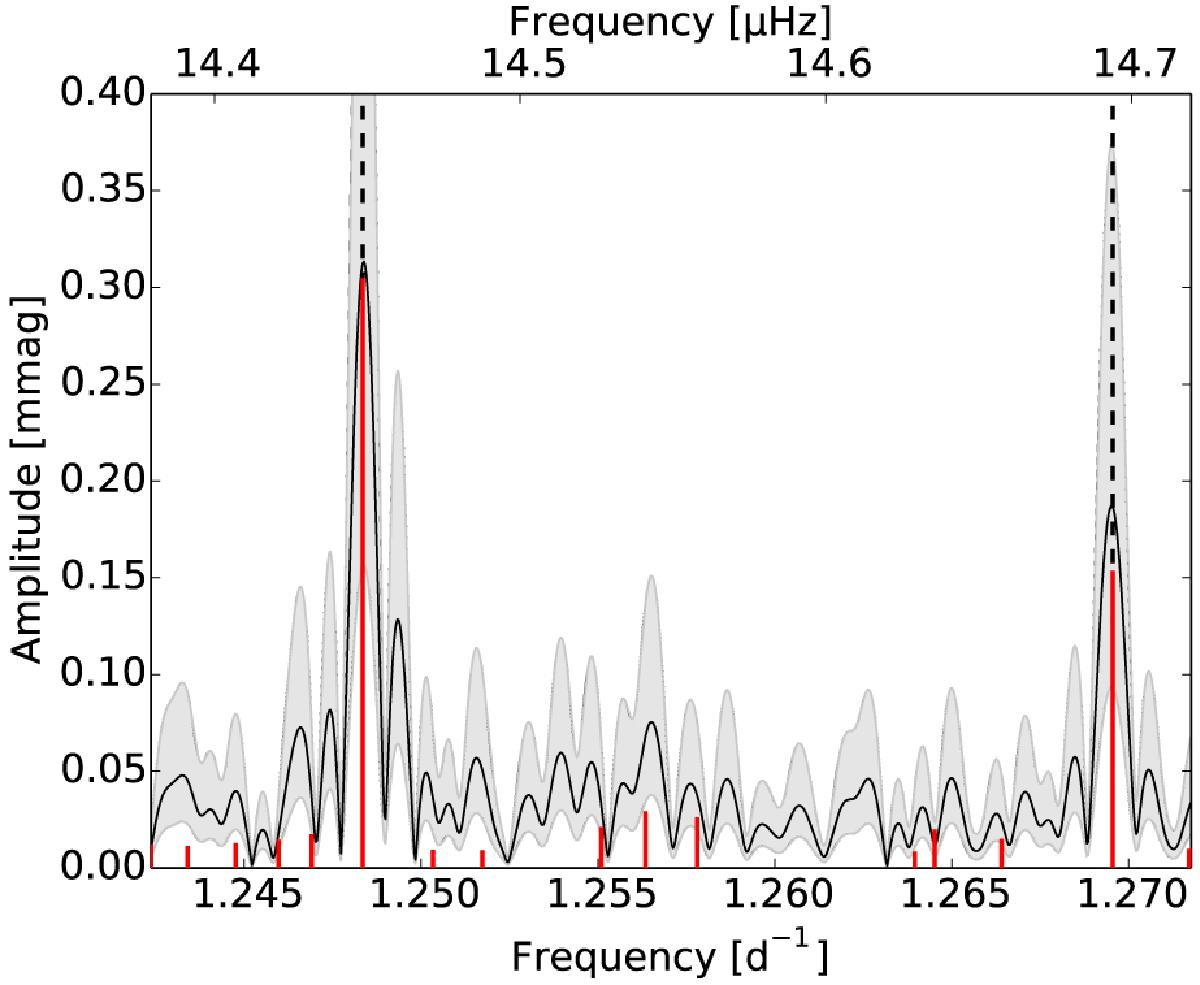
The Fourier transform (full black curve) of a simulated light curve. Using the presented comparison criterion, the frequency extraction is aborted when the amplitude of an extracted frequency (full red vertical lines) does not agree with the original Fourier transform within a certain margin (grey area). The accepted frequencies are marked with dashed lines.
Current usage metrics show cumulative count of Article Views (full-text article views including HTML views, PDF and ePub downloads, according to the available data) and Abstracts Views on Vision4Press platform.
Data correspond to usage on the plateform after 2015. The current usage metrics is available 48-96 hours after online publication and is updated daily on week days.
Initial download of the metrics may take a while.