| Issue |
A&A
Volume 573, January 2015
|
|
|---|---|---|
| Article Number | A73 | |
| Number of page(s) | 21 | |
| Section | Interstellar and circumstellar matter | |
| DOI | https://doi.org/10.1051/0004-6361/201424354 | |
| Published online | 22 December 2014 | |
XMM-Newton study of 30 Doradus C and a newly identified MCSNR J0536−6913 in the Large Magellanic Cloud⋆,⋆⋆
1
Institut für Astronomie und Astrophysik, Kepler Center for Astro and
Particle Physics, Eberhard Karls Universität Tübingen,
Sand 1,
72076
Tübingen,
Germany
e-mail:
This email address is being protected from spambots. You need JavaScript enabled to view it.
2
University of Western Sydney, Locked Bag 1797, Penrith South DC, NSW
1797,
Australia
3
Cerro Tololo Inter-American Observatory,
Casilla 603,
La Serena,
Chile
4
Max-Planck-Institut für extraterrestrische Physik,
Giessenbachstraße,
85748
Garching,
Germany
Received: 8 June 2014
Accepted: 23 September 2014
Abstract
Aims. We present a detailed study of the superbubble 30 Dor C and the newly identified supernova remnant MCSNR J0536-6913 in the Large Magellanic Cloud.
Methods. All available XMM-Newton data (flare-filtered exposure times of 420 ks EPIC-pn, 556 ks EPIC-MOS1, 614 ks EPIC-MOS2) were used to characterise the thermal X-ray emission in the region. An analysis of the non-thermal X-ray emission is also presented and discussed in the context of emission mechanisms previously suggested in the literature. These data are supplemented by X-ray data from Chandra, optical data from the Magellanic Cloud Emission Line Survey, and radio data from the Australia Telescope Compact Array and the Molonglo Observatory Synthesis Telescope.
Results. The brightest thermal emission towards 30 Dor C was found to be associated with a new supernova remnant, MCSNR J0536−6913. X-ray spectral analysis of MCSNR J0536−6913 suggested an ejecta-dominated remnant with lines of O, Ne, Mg, and Si, and a total 0.3−10 keV X-ray luminosity of ~8 × 1034 erg s-1. Based on derived ejecta abundance ratios, we determined the mass of the stellar progenitor to be either ~18 M⊙ or as high as ≳40 M⊙, though the spectral fits were subject to simplifying assumptions (e.g., uniform temperature and well-mixed ejecta). The thermal emission from the superbubble exhibited enrichment by α-process elements, evidence for a recent core-collapse SNR interaction with the superbubble shell. We detected non-thermal X-ray emission throughout 30 Dor C, with the brightest regions being highly correlated with the Hα and radio shells. We created a non-thermal spectral energy distribution for the north-eastern shell of 30 Dor C which was best-fit with an exponentially cut-off synchrotron model.
Conclusions. Thermal X-ray emission from 30 Dor C is very complex, consisting of a large scale superbubble emission at the eastern shell wall with the brightest emission due to MCSNR J0536−6913. The fact that the non-thermal spectral energy distribution of the superbubble shell was observed to roll-off is further evidence that the non-thermal X-ray emission from 30 Dor C is synchrotron in origin.
Key words: ISM: supernova remnants / ISM: bubbles / Magellanic Clouds / X-rays: ISM
Based on observations obtained with XMM-Newton, an ESA science mission with instruments and contributions directly funded by ESA Member States and NASA.
Appendix A is available in electronic form at http://www.aanda.org
© ESO, 2014
1. Introduction
Via stellar winds and later supernovae (SN), massive stars are responsible for energising and enriching the interstellar medium (ISM). The collective mechanical output of massive star clusters into the surrounding ISM creates so-called “superbubbles” (SBs), which are 100−1000 pc diameter shells of swept-up interstellar material that contains a hot (106 K), shock-heated gas (Weaver et al. 1977; Mac Low & McCray 1988). In recent years, non-thermal X-ray emission has been detected from a number of Galactic (RCW 38, Wolk et al. 2002; Westerlund 1, Muno et al. 2006), and extragalactic SBs. These include N 11 (Maddox et al. 2009), N 51D (Cooper et al. 2004), 30 Dor C (Bamba et al. 2004; Smith & Wang 2004; Yamaguchi et al. 2009) in the Large Magellanic Cloud (LMC), and IC 131 in M 33 (Tüllmann et al. 2009)1.
Proposed explanations for the non-thermal emission detected in SBs are synchrotron radiation, inverse Compton (IC) scattering of ambient photons, and non-thermal Bremsstrahlung radiation. A prerequisite for any of these mechanisms is the acceleration of electrons to relativistic or near relativistic energies. Parizot et al. (2004) demonstrate that turbulence and magnetohydrodynamic waves born out of colliding massive stellar winds and SN shocks can accelerate and re-accelerate particles to these energies. Butt & Bykov (2008) also argue that the energy loss to relativistic particle acceleration can be invoked to explain the SB energy discrepancy, which is the persistent problem that the observed combined thermal and mechanical energy in SBs is less than the total energy input of the stellar population (see Cooper et al. 2004; Maddox et al. 2009; Kavanagh et al. 2012, for examples). Because 30 Dor C is by far the strongest non-thermal X-ray emitting SB in the LMC, it provides an ideal laboratory for probing the non-thermal emission mechanisms of and resulting effects on SBs and their evolution.
This SB is located to the southwest of the main 30 Dor complex and was first identified (and named) by Le Marne (1968), then later classified as an SB by Mathewson et al. (1985) using radio and optical emission line data. The SB is powered by the LH 90 (Lucke & Hodge 1970) OB association, which consists of several clusters (ages from ~3−7 Myr, Testor et al. 1993). Discussion of the radio and Hα shells of 30 Dor C can be found in Mathewson et al. (1985) and Smith & Wang (2004, henceforth SW04). The first X-ray detection of 30 Dor C was with Einstein (Long et al. 1981). The SB later had a place in the history of X-ray astronomy, since it was observed in the first-light XMM-Newton observation (Dennerl et al. 2001), presenting a ring-like structure in hard X-rays unlike all other extended sources in the LMC.
Observations with the current generation of X-ray missions (Chandra, XMM-Newton and Suzaku) have provided a wealth of information on this object. Bamba et al. (2004, henceforth BU04) report their analysis of two Chandra ACIS-S and two early XMM-Newton observations of 30 Dor C. Power-law fits to the non-thermal shell emission resulted in best-fit photon indices (Γ) in the range of 2.1−2.9, indicative of a synchrotron origin, and the authors conclude that this is the emission mechanism. SW04 also report an analysis of the same XMM-Newton observations as BU04. However, SW04 argue that the synchrotron mechanism cannot be the origin of the non-thermal X-rays based on energetics considerations. The expansion of the bubble is much too slow to produce the high-energy particles required for non-thermal X-ray synchrotron emission in the shell. SW04 also considered IC and non-thermal Bremsstrahlung mechanisms as the source of the hard X-rays.
While IC scattering of cosmic microwave background (CMB) and IR photons by relativistic electrons from a young pulsar wind could explain the non-thermal X-rays, there is, as yet, no solid observational evidence of any such source of high-energy particles in 30 Dor C. Non-thermal Bremsstrahlung was found to be too inefficient. As with BU04, Yamaguchi et al. (2009, henceforth YB09) suggest a synchrotron origin to the non-thermal X-rays, based on the statistical rejection of a simple power law over an srcut2 model. They posited that a supernova remnant (SNR) from deep in the bubble has freely expanded through the interior and is now interacting with the SB shell walls. However, this interpretation presents problems with regard to standard SB theory. First of all, and as discussed in SW04, there are no shocks fast enough at the shell to sustain this mechanism. Secondly, a remnant does not freely expand from deep in an SB interior to the shell wall since its energy is dissipated by turbulence long before (Mac Low & McCray 1988; Parizot et al. 2004).
In addition to the non-thermal shell, all previous authors have found that the southeastern regions of 30 Dor C exhibited substantial thermal emission. Thermal plasma models with enhanced α-process elements were required to adequately fit this emission. Owing to these metal enhancements, it has been suggested that the emission is the result of a recent SNR interaction with the shell wall. However, there still needs to be a detailed spatially resolved spectral analysis of the thermally emitting regions in 30 Dor C.
In this paper we seek to carry out a comprehensive study of the non-thermal and thermal X-ray emission in 30 Dor C using the ample archival XMM-Newton data. Several hundred ks of XMM-Newton data has been collected in recent years thanks to 30 Dor C being located only a few arcmins from SN 1987A, which has been the subject of a deep monitoring campaign (Heng et al. 2008; Sturm et al. 2010; Maggi et al. 2012). In addition to this abundance of XMM-Newton data, we have new radio observations of 30 Dor C with the Australia Telescope Compact Array (ATCA), supplementing already available radio data from the Molonglo Observatory Synthesis Telescope (MOST), and optical emission line data from the Magellanic Cloud Emission Line Survey (MCELS Smith et al. 2006). Using these multi-wavelength data, our goal is to obtain a clear picture of the physical processes and mechanisms at work in this intriguing object. In Sect. 2 we outline the multi-wavelength observations and data reduction. In Sect. 3 we describe the detailed analysis of the observational datasets. In Sect. 4 we discuss the results of our analysis of the thermal and non-thermal X-ray emission in 30 Dor C in the context of the multi-wavelength picture before giving a summary of our work in Sect. 5.
2. Observations and data reduction
2.1. Optical
We used images obtained during the MCELS (Smith et al. 2006), taken with the 0.6 m University of Michigan/Cerro Tololo Inter-American Observatory (CTIO) Curtis Schmidt Telescope, which is equipped with a SITE 2048 × 2048 CCD, producing individual images of 1.35° × 1.35° on a scale of 2.3″ pixel-1. The survey mapped both the LMC (8° × 8°) and the Small Magellanic Cloud (3.5° × 4.5°) in narrow bands covering [O iii]λ5007 Å, Hα, and [S ii]λ6716, 6731 Å, in addition to matched green and red continuum bands. The survey data were flux-calibrated and combined to produce mosaicked images. We extracted cutouts centred on 30 Dor C from the MCELS mosaics. We subtracted the continuum images from the corresponding emission line images, thereby removing the stellar continuum and revealing the full extent of the faint diffuse emission. We note here that SW04 used the MCELS Hα data to aid in their discussion of the morphological properties of 30 Dor C.
2.2. Radio
Radio-continumm data used in this project include a 36 cm (843 MHz) MOST mosaic image (as described in Mills et al. 1984) and complementary 20 cm (1380 MHz) observations from the ATCA project C221 (PI: J. M. Dickey). These observations include three pointings in the vicinity of 30 Dor C, which were mosaicked to gain a higher quality image of the region. Details of these observations are listed in Table 1. We used the miriad3 (Sault et al. 1995) and karma (Gooch 1995) software packages for reduction and analysis. We created images using miriad multi-frequency synthesis (Sault & Wieringa 1994) and natural weighting. They were deconvolved with primary-beam correction applied. The same procedure was used for both U and Q stokes parameter maps. More information about the data reduction and a number of other LMC SNR studies can be found in Bojičić et al. (2007), and references therein.
Radio-continuum observations used from ATCA project C221.
2.3. X-ray
2.3.1. XMM-Newton
We obtained all of the data on 30 Dor C available from the XMM-Newton Science Archive, consisting of 15 observations spread over 12 years. We assessed each of the observational datasets for their suitability for our analysis. We omitted observations that had flare-filtered exposure times (see Sect. 3.1) less than 10 ks, leaving 11 observations that we used for our analysis. These observations and the flare-filtered exposure times are listed in Table 2.
XMM-Newton observations of 30 Dor C used in the analysis.
The available data were collected over an extended period of time and were subject to varying instrumental performance and response. We therefore required a consistent reduction and analysis method. In addition, the final science products should be free of as much background contaminants as possible to minimise the complexity of the analysis. Thus, we used the XMM-Newton Extended Source Analysis Software (XMM-ESAS), packaged in SAS 12.0.1. XMM-ESAS is based on the software used for the background modelling described in Snowden et al. (2004).
Essentially, XMM-ESAS consists of a set of tasks to produce images and spectra from observational data and to create model quiescent particle background (QPB) images and spectra that can be subtracted from the observational science products (see Kuntz & Snowden 2008; Snowden et al. 2008). We processed each of the observational datasets according to the ESAS Cookbook4. Standard filtering and calibration were applied using the SAS tools epchain, emchain, the XMM-ESAS tools pn-filter, and mos-filter. The CCDs of each of the EPIC instruments were then examined to ensure that none were operating in an anomalous state (where the background at E< 1 keV is strongly enhanced, see Kuntz & Snowden 2008).
The pn-spectra and mos-spectra tasks were used to produce images in the 0.3−1 keV, 1−2 keV, and 2−7 keV energy bands for each dataset. The pn-back and mos-back tasks were then used to produce the corresponding QPB images. We then used merge_comp_xmm to create mosaicked count, exposure, and QPB images. Finally, the adapt_2000 task was implemented to create exposure corrected mosaics in each energy band with the QPB subtracted, bin them into 2 × 2 pixel bins, and adaptively smooth the resulting image. We combined these mosaics to produce an RGB image, shown in Fig. 1 (left).
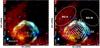 |
Fig. 1 Left: combined XMM-Newton EPIC image of 30 Dor C in false colour with red, green, and blue corresponding to 0.3–1 keV, 1–2 keV, and 2–7 keV. Also shown is the region to the north of 30 Dor C which highlights the highly variable background in the region. The image has been exposure-corrected in each energy band and have the QPB subtracted and binned into 2 × 2 pixel bins before being adaptively smoothed using the XMM-ESAS task adapt-2000. The position of Source 6, which is discussed as a possible compact object in Sect. 4.2.1, is also marked. Right: same as left but with the spectral analysis regions indicated. See Sect. 3.3.1 for a description of the regions. |
The XMM-ESAS task cheese-bands was used to search for point sources in the field of view (FOV). This task performs the source detection on all three EPIC instruments simultaneously in multiple energy bands. We selected the 0.3−1 keV, 1−2 keV, and 2−7 keV bands so that the source detection would be sensitive to both soft and hard sources in the FOV. However, this task operated only on individual observational datasets and not on a final merged product. Thus, the source lists were examined using the final merged images to search for faint sources that were missed. Any sources found were added to the point source mask used for the spectral analysis using the SAS task region and the XMM-ESAS task make_mask.
For extracting spectra and response files, we used the XMM-ESAS tasks pn-spectra and mos-spectra. The tasks pn-back and mos-back were used to produce corresponding QPB spectra to be subtracted from the observational spectra. The spectra were grouped to minimum of 30 counts per bin to allow the use of the χ2-statistic. All fits were performed using XSPEC (Arnaud 1996) version 12.7.1 with ATOMDB5 version 2.0.1. Abundance tables were set to those of Wilms et al. (2000) and photoelectric absorption cross-sections to those of Balucinska-Church & McCammon (1992). For spectral components associated with the LMC, abundances were fixed to 50% the solar value (Russell & Dopita 1992). We limited our analysis to the 0.4−7 keV range as recommended in the ESAS Cookbook. Thus, we avoid the strong low-energy tail of the EPIC-pn quiescent background due to detector noise and the EPIC-pn fluorescence line forest just above 7 keV. In all the forthcoming fits, spectra that have been extracted from a given region from all the observational datasets are fit simultaneously in XSPEC. We consider only those EPIC spectra with >1000 QPB background-subtracted counts to ensure the statistical quality of the spectra in the fits.
2.3.2. Chandra
We also utilised the available Chandra (Weisskopf et al. 1996) data to aid in the discussion in Sect. 4.2.2. The Advanced CCD Imaging Spectrometer S-array (ACIS-S Garmire et al. 2003) has observed 30 Dor C twice during observations of the nearby SN 1987A. These are ObsID 1044 (~18 ks, PI: G. Garmire) and ObsID 1967 (~99 ks, PI: R. McCray). For a detailed analysis of these observations with respect to 30 Dor C, the reader is directed to BU04. We reduced and analysed the Chandra observations using the CIAO v4.6.1 software package (Fruscione et al. 2006) with CALDB v4.5.96. Each data set was reduced using the contributed script chandra_repro. Combined energy-filtered and exposure-corrected images were produced using the merge_obs script.
3. Analysis
3.1. X-ray morphology
The well-known non-thermal shell is seen in unprecedented detail (Fig. 1), with structure visible in regions of stronger emission. In the S-SE region there is an obvious circular emission region, most notable in the 1−2 keV energy range. The morphology and classification of this object is discussed in detail in Sect. 3.2. In addition, the X-ray background is not uniform, with a very obvious dichotomy between the eastern and western regions of 30 Dor C. The eastern side is projected against large scale hot ISM emission. This emission is much less apparent on the western side, most likely because of the known molecular clouds located in the foreground (Johansson et al. 1998, BU04). Due to the background variation, we must, as much as possible, take this into account when treating the background in the spectral analysis of 30 Dor C.
3.2. MCSNR J0536-6913
An additional extended X-ray emitting object is evident as a circular shell in the 1−2 keV band, projected against the southern 30 Dor C shell (see region A1 in Fig. 1right). Object classes that can produce diffuse X-ray structures in extragalactic observations are galaxy clusters, SBs, and SNRs (see Maggi et al. 2014, for a more detailed description of the X-ray properties of these objects). We ruled out the possibility that this object is hot gas in the intracluster medium of a background galaxy cluster since the observed shell morphology of the object is not in keeping with what is expected from the hot gas of a galaxy cluster, which is centrally filled. It is also unlikely that this structure is an SB, since these require a high mass stellar population to drive their expansion, which is absent here. An SNR is a far more likely explanation given the shell morphology. We therefore proceed with the assumption that the object is an SNR and assess other tracers of this object classification.
Typically, objects are classified as SNRs based on satisfying certain observational criteria. For example, the Magellanic Cloud supernova remnant (MCSNR) database7 states that at least two of the following three observational criteria must be met: significant Hα, [S ii], and/or [O iii] line emission with an [S ii]/Hα flux ratio >0.4 (Mathewson & Clarke 1973; Fesen et al. 1985); extended non-thermal radio emission; and extended thermal X-ray emission. A discussion of the significance of each of these classification criteria is given in Filipovic et al. (1998). The new candidate SNR satisfies only one of these three criteria, since Mathewson et al. (1985) found that [S ii]/Hα< 0.4 throughout 30 Dor C and our radio data show no clear indications of an SNR. These multi-wavelength properties are discussed in detail in Sect. 4.2.2. Even in the absence of optical and radio emission tracers, we are confident classifying this object as an SNR given the 1–2 keV shell morphology and X-ray spectral signatures (see Sects. 3.3.3 and 4.2.2), and we hereafter refer to this source as MCSNR J0536−6913 (see forthcoming text for position determination).
The remnant’s shell morphology is extraordinarily circular with a north-south brightness gradient. It is likely that the SNR is located outside of 30 Dor C rather than inside the SB. If the SNR was located inside, we would not expect to observe a shell morphology since the blast wave would only encounter a low density hot plasma. The brighter emission from the north of the SNR suggests it is evolving into a higher density medium than in the south, which again is counter-intuitive to a location in the bubble. If the SNR is located outside 30 Dor C but near enough that the northern shell is evolving towards the SB shell of higher density, the expected density gradient could explain the X-ray morphology.
As discussed later in Sect. 3.3.3, the notable shell in the 1−2 keV band is likely shocked ejecta emission. While the outer edges of the ejecta are somewhat smeared out, the inner edge is much brighter and well defined. This may represent either the progression of the reverse shock into the ejecta or the radius at which the ejecta distribution has fallen to a level where ejecta emission is no longer detectable. We fit a circular region to the inner edge of the ejecta. We took the centre of this circle to be the position of the remnant, which gives a J2000 position of RA = 05h36m17.0s and Dec = −69d13m28s, leading to identifier MCSNR J0536−6913. To estimate the extent of the SNR, we followed a similar prescription to Maggi et al. (2014).
We first created radial profiles of the remnant. Because of the differing local backgrounds and brightness of the ejecta, we split the radial profiles into northern and southern components. The northern ejecta are much brighter than the southern and are immersed in a higher X-ray background due to the shell of 30 Dor C. The southern ejecta is evolving away from the SB emission and has a correspondingly lower background. We took radial bins of 5″ out to an angular distance of 1′, corresponding to ~1.2 pc bins out to ~14.4 pc at the LMC distance of 50 kpc (di Benedetto 2008), and determined the surface brightness of each bin. The north and south radial profiles are shown in Fig. 2. Following Maggi et al. (2014), the dimensions of the remnant are defined where the intensity has fallen to 26% of the peak following background subtraction. If the radial profile is Gaussian, this would enclose 90% of the distribution.
Taking the background from radial bins >10 pc, we determined the radii of the northern and southern shells to be ~8(±1) pc, by simply taking the first bin above the threshold. There is a caveat to be aware of with the determined SNR dimensions. With regard to the outer radius, the X-ray emission due to the ejecta may not represent the furthermost emission from the SNR centre. It is very likely that the forward shock has swept up and shocked ISM, located ahead of the ejecta, but the spatial resolution of XMM-Newton cannot resolve the two components. The outermost edge of the shell in the 1−2 keV range more likely traces the contact discontinuity between ISM shocked by the blast wave and ejecta shocked by the reverse shock. Such an SNR structure is evident in high-spatial resolution images of similar MC remnants from Chandra (e.g. Warren & Hughes 2004; Sasaki et al. 2006).
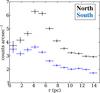 |
Fig. 2 Northern (black) and southern (blue) radial profile of MCSNR J0536−6913 in the 1−2 keV band. |
3.3. X-ray spectral analysis
Following the subtraction of the modelled QPB spectra, the remaining particle-induced background consists of instrumental fluorescence lines and the residual soft-proton (SP) contamination. The instrumental fluorescence lines can be modelled with Gaussian components (gauss in XSPEC) at 1.49 keV in the EPIC-pn spectrum, and 1.49 keV and 1.75 keV for the EPIC-MOS spectra. The level of residual SP contamination varies from observation to observation. We estimated the level of this using the diagnostic tool of De Luca & Molendi (2004)8. This allows us to anticipate observations that may be strongly affected by residual SP contamination that can be accounted for in the spectral modelling. However, owing to the significant straylight contamination in the southern FOV from the high-mass X-ray binary LMC X-1, the results of the diagnostic tool are compromised. Instead, we ran test fits on spectra from each observational dataset individually to search for signs of SP contamination, which manifest as a significant deviation from continuum emission at higher energies. We found that only Obs. ID 0113020201 was badly affected by residual SPs. As such, an additional power-law component not convolved with the instrumental response was included only in this observation. This was achieved using the diagonal response files supplied in the XMM-ESAS CALDB.
Given the strong variation in the astrophysical X-ray background (AXB) of 30 Dor C noted in Sect. 3.1, we decided to split the treatment of the AXB into eastern and western divisions, which we hereafter refer to as BG-E and BG-W, respectively. BG-E contains contributions from the AXB, as well as a bright soft component, likely due to hot ISM in the LMC. This hot ISM is less apparent in BG-W. This could be due to the foreground molecular cloud that covers the western side of 30 Dor C; however, this assumption is simplistic as an intrinsic reduction in surface brightness is also possible. For our analysis we attempted to fit each of the background regions with a physically motivated model that could then themselves be included in the spectral fits to the 30 Dor C spectra.
The AXB typically comprises four or fewer components (Snowden et al. 2008; Kuntz & Snowden 2010), namely the unabsorbed thermal emission from the Local Hot Bubble (LHB, kT ~ 0.1 keV), absorbed cool (kT ~ 0.1 keV) and hot (kT ~ 0.25 keV) thermal emission from the Galactic halo, and an absorbed power law (Γ ~ 1.46, Chen et al. 1997) representing unresolved background active galactic nuclei (AGN). In cases of low Galactic foreground absorption, the LHB and absorbed cool Galactic halo emission are indiscernible and can be modelled as a single component. The normalisation of the background AGN component can be fixed to an equivalent of 10.5 photons keV cm-2 s-1 sr-1, as recommended in the XMM-ESAS documentation. All thermal components were fit with the apec (Smith et al. 2001) thermal plasma model in XSPEC. To model the absorption of the Galactic halo, we used a photoelectric absorption model in XSPEC, namely phabs. The value of the foreground hydrogen absorption column was fixed at 6 × 1020 cm-2 based on the Dickey & Lockman (1990) HI maps, determined using the HEASARC NH Tool9. An additional absorption component (vphabs) was added for the power-law component to account for the absorption of the background cosmological sources by material in the LMC. The abundances of this component were fixed to LMC values.
In principle, the AXBs of BG-E and BG-W should have the same surface brightness because the components do not vary on such small spatial scales. We began by fitting the spectrum of BG-W, which has lower surface brightness, and tested if the increased absorption due to the foreground molecular cloud allows us to constrain the soft AXB emission, akin to a shadowing measurement. A simple fit with the normal AXB components was insufficient to adequately model the spectra. Thus, an additional thermal component (vapec with LMC abundances) was included representing LMC ISM emission. This yielded a much improved fit with reduced χ2 ( ). The best-fit spectra are shown in Fig. 3 (left) with the fit results presented in Table 3.
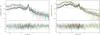 |
Fig. 3 Left: simultaneous spectral fits to the EPIC BG-W spectra. Right: same as left for BG-E. The green and red straight lines represent the residual SP contamination in Obs. ID 0113020201, in which only the EPIC-MOS1 and EPIC-MOS2 cameras were on. |
Spectral fit results for BG-W.
For the brighter BG-E region, we fixed the normal AXB contribution based on the BG-W results. With regard to the LMC ISM emission, we also kept the additional thermal component required in BG-W, fixing its temperature but allowing its normalisation to vary. The resulting fit yielded large residuals in the 0.4−0.7 keV range, with  . Thus, a second thermal component was added (vapec with LMC abundances). While the fit was largely improved, residuals remained at the emission lines of some α-group elements. We therefore allowed O, Ne, and Mg abundances to vary and tied the abundances of the two thermal components representing the LMC ISM emission. This resulted in a substantially improved fit (
 ). The plasma temperatures of the two LMC ISM components are consistent with the ISM in other star-forming galaxies (Mineo et al. 2012). The best-fit spectra are shown in Fig. 3 (right) with the fit results presented in Table 4.
Spectral fit results for BG-E.
From the fits to the background regions, it is obvious that there is very significant LMC ISM emission in the 30 Dor C region. While we attempted to fit this emission with physically motivated models, a truly detailed analysis and interpretation of the ISM emission is beyond the scope of this paper. Such a study of the hot gas in the LMC will be presented in a future work. For our purposes, the best-fit models to the BG-E and BG-W spectra were simply fixed in the fits to the 30 Dor C spectra. We briefly note, however, that other interpretations are possible: e.g., the two-component LMC ISM emission could dominate the foreground Galactic emission, and only the ISM components are required in the fit.
3.3.1. Analysis regions
The substantial XMM-Newton data allowed us to perform a spatially resolved spectral study of 30 Dor C, much in the same way as BU04, only on smaller spatial scales. In this way we can analyse the variation in spectral components in different regions of the remnant in unprecedented detail. We followed the lead of BU04 with the nomenclature of our analysis regions, approximately splitting the superbubble shell into SE, NE, NW, and SW quadrants, which are labelled shells A, B, C, and D, respectively. These shells are further subdivided into regions of interest, selected because of notable features in the three-colour X-ray image (see Fig. 1 right). Shell A is the region of the brightest soft X-ray emission. We have identified the brightest soft emission in shell A as MCSNR J0536−6913, separating it from the thermal superbubble emission. For consistency in nomenclature, we label the SNR region and the bright superbubble emission to the north A1 and A2, respectively. Shell B contains part of the non-thermal shell. The deep XMM-Newton image reveals significant structure in the non-thermal emitting regions, with two bright regions of the outer shell and a fainter filament slightly inside these. We labelled these B1 (SE of outer shell), B2 (NE of outer shell), and B3 (inner filament). Shell C contains the brightest part of the non-thermal shell. As with shell B, much detail is evident in the morphology of the hard emission. We subdivided this shell into C1 (the brightest region to the north) and C2 (the fainter region to the SW). Finally, Shell D, which is connected to Shell C by a thin hard filament, cannot be subdivided so was taken as a single complete region. In addition to the bright shell regions, the data also afford us the opportunity to study the fainter interior regions of 30 Dor C. We labelled these the I-regions, which are defined as follows: I1, located inside shells A and B, contains bright soft emission; I2, taken as the centre of the superbubble, is free of any limb-brightened shell emission; and I3, located inside shells C and D, has hard X-ray structure that is more diffuse than the shell.
3.3.2. Spectral fits
Shell A (SE): owing to its added complexity, the description of the spectral fits to A1 (MCSNR J0536−6913) are deferred to Sect. 3.3.3. Region A2 is a little more distinct than other regions of superbubble thermal emission (see B1 and I1 below) because it is brighter and contains a filamentary structure. Soft emission lines in its spectra cannot be explained by the thermal background components alone. In addition, a hard tail is present that is most likely non-thermal in origin. We therefore fitted the spectra using a thermal plasma (vapec with LMC abundance) plus power-law model. The relatively low number of hard photons made it difficult to constrain the slope of the power-law component if left free. Thus, we fixed the slope of the power law to Γ = 2.55, which is the average of the slopes determined for the adjacent I1 and I2 regions (see below). The resulting fits yielded  . Obvious residuals at ~0.7 keV (O VIII), ~0.9 keV (Ne IX), and ~1.4 keV (Mg XI) remained. Thus, we freed the abundances of these elements, resulting in an improved fit with
  . The best fit model parameters are given in Table 5 with the spectra shown in Fig. 4.
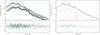 |
Fig. 4 Left: simultaneous spectral fits to the EPIC A2 spectra. Right: EPIC-pn spectrum of A2 from Obs. ID 0601200101 (deepest EPIC-pn observation) with additive model components shown. The red dash-dot-dot-dot lines represent the AXB components, the magenta dash-dot line shows the instrumental fluorescence line, blue dotted lines mark the LMC ISM, and green dashed lines represent the source components (vapec+pow). Best fit parameters are given in Table 5. |
Shell B (NE): B1 contains relatively bright hard emission, as well as part of the enhanced soft emission in the eastern region of 30 Dor C. This shows up in the spectra as obvious emission lines at ~0.7 keV (O VIII), ~0.9 keV (Ne IX), and ~1.4 keV (Mg XI). We therefore fitted the B1 spectra with a thermal plasma with LMC abundance (vapec) plus a power-law model. While the resulting fit statistic ( ) is relatively good, we suspected that this could be improved further since residuals remained at the aforementioned emission lines, as well as below 0.5 keV. As a result, we allowed the abundances of O, Ne, and Mg to vary while fixing the remaining elemental abundances to LMC values. The fit was further improved (
 ). The best fit model parameters are given in Table 5 with the spectra shown in Fig. A.110.
In contrast to B1, the spectrum of B2 is comparatively featureless, which is unsurprising considering that this region is the second brightest in the 2–7 keV band so the hard emission dominates. We fitted the B2 spectra with a power law on top of the background components and found an acceptable fit ( ). Adding thermal plasma models did not improve the fits and were difficult to constrain. The best fit model parameters are given in Table 5 with the spectra shown in Fig. A.2.
Owing to the number of counts being < 1000 for all of the EPIC-MOS spectra, only the B3 EPIC-pn spectra were used for the fits. B3 contains a hard filamentary structure so a non-thermal component was expected in the spectra. This was indeed evident as a hard tail. While the spectra of B3 exhibit some emission lines, preliminary fitting showed that these were most likely due to the background thermal components. We fitted the B3 spectra with a power-law model on top of the background. The resulting fit was relatively poor with a  . Attempts to improve the model by introducing additional thermal components were unsuccessful, resulting in nonsensical values for the fit parameters. The best fit model parameters are given in Table 5 with the spectra shown in Fig. A.3.
Shell C (NW): the Shell C spectrum is rather featureless, which is indicative of a non-thermal origin. Thus, on top of the background model we added a power law to fit each of the subdivided C shells. The resulting fits to the C1 and C2 sub-regions were acceptable (see Table 5), with  and 1.06, respectively. The best fit spectra of C1 and C2 are shown in Figs. A.4 and A.5, respectively, with results in Table 5. YB09 report that a simple power law fit to their “West” spectrum, equivalent to our C shell, could be statistically rejected in favour of a broken power law or with the srcut model in XSPEC, which represents a synchrotron spectrum from an exponentially cut-off power-law distribution of electrons (Reynolds 1998). Thus, we also fitted the brightest region of shell C, namely C1, with an srcut model in XSPEC. We follow the lead of YB09 and fixed the spectral index at 1 GHz to the range of values typical of SNRs, α = −(0.4−0.6). Our fits yielded a spectral roll-off frequency in the range (1.5−3.5) × 1017 Hz, similar to the results of YB09. However, the resulting
  , is not a statistical improvement on a simple power law fit. We applied the srcut models to other regions around 30 Dor C with similar results; i.e., we cannot reject either the simple power law or the srcut models based on our X-ray spectral fits alone. This is most likely due to the lower upper limit to the energy range in our fits (7 keV), with YB09 fitting up to >10 keV. The physical implications of this model are discussed in Sect. 4.3.
Shell D (SW): similar to shell C, the spectrum of shell D is relatively featureless. We fitted this region with a power law in addition to the background, which yielded a  . The best fit model parameters are given in Table 5 with the spectra shown in Fig. A.6.
Interior regions: I1 is substantially different to regions I2 and I3 in that there is very obvious bright thermal emission present. This is evident in the spectra as obvious emission lines at ~0.7 keV (O VIII), ~0.9 keV (Ne IX), ~1.0 keV (Ne X), and ~1.4 keV (Mg XI). In addition, there is a high energy tail, and thus, a non-thermal component may also be present. Motivated by these features, we fitted the I1 spectra with a thermal plasma with LMC abundance (vapec) plus a power law model. The resulting fit, with , failed to properly account for emission lines at 0.9 keV, 1 keV, and 1.4 keV, as well as yielding a photon index of ~3.4, which is inconsistent with the non-thermal emission from adjacent regions of 30 Dor C. Thus, we allowed the abundances of O, Ne, and Mg to vary while fixing the remaining elemental abundances to LMC values. This improved the fit to  and resulted in a more reasonable photon index of Γ = 2.59. The best fit model parameters are given in Table 5 with the spectra shown in Fig. A.7.
No thermal component was required for I2 and I3 with a power law component on top of the astrophysical background sufficient for acceptable fits ( and 1.06, respectively). The best fit model parameters are given in Table 5 with the spectra shown in Figs. A.8 and A.9.
Results of simultaneous spectral fits to 30 Dor C regions.
3.3.3. A1 spectral fits: MCSNR J0536−6913
The spectra of A1 show clear emission lines at ~0.6 keV (O VII), ~0.7 keV (O VIII), ~0.9 keV (Ne IX), ~1.0 keV (Ne X), ~1.4 keV (Mg XI), and ~1.84 keV (Si XIII), which is indicative of a thermal plasma with a temperature of 106−7 K. Fitting the spectrum is not as straightforward as in the other regions because the shell in A1 is immersed in contaminating emission from 30 Dor C. To account for this, we assumed that the SB emission from the adjacent region I1 is representative of the contaminating emission in A1, and include this component in the models accordingly. We first attempted to fit the shell emission using a simple vpshock model with LMC abundance of 0.5 Z/Z⊙ (Russell & Dopita 1992). This failed to adequately account for the strong emission lines of O, Ne, Mg, and Si. As such we allowed the abundances of these elements to vary while keeping the remaining metals fixed to the LMC value. This yielded an acceptable fit with  , the results of which are given in Table 6. However, this model did not provide strong constraints on the abundance parameters. For this simple model, the derived plasma temperature is higher than in the surrounding regions, with large overabundance of α-process elements. This is consistent with an SNR origin, which is most likely in the transition between free-expansion and the Sedov phase.
Assuming that the X-ray emission from this SNR arises from the combination of an ejecta-dominated and an ISM-dominated shock, then a more representative model would consist of two thermal plasma components. We must be cautious, however, as fitting a multi-component SNR model, in addition to the background 30 Dor C components, could lead to problems in the fit; namely, the contributions to the continuum are difficult to constrain. Thus, a simple, though physically plausible, model is required. We assume a pure metal plasma consisting of O, Ne, Mg, and Si for the ejecta and an additional component representing the swept-up ISM shocked by the blast wave. This ISM component is probably more significant in the north of MCSNR J0536−6913 where the soft emission is brightest. We fitted the spectra with a vpshock+vpshock model with the ISM component abundances fixed to the LMC values.
For the ejecta component, we followed the method of Vink et al. (1996), which allows us to fit the ejecta with a simple model, but can provide detailed information on the abundance ratios in the ejecta. We assumed that the ejecta consist mainly of O, fixed the O abundance at a high value (104Z/Z⊙), and allowed the abundances of Ne, Mg, and Si to vary relative to it. All other abundances were fixed to 0. This model is still oversimplified. We must assume that the ejecta components have the same temperature and ionisation conditions. However, given the already complex model, the addition of individual pure-metal plasma components for each element exacerbates the situation so that strong constraints on the model parameters cannot be obtained. We therefore continued with the simplifying assumption of a uniform ejecta temperature. The resulting fit was acceptable with  , the results of which are given in Table 6 and the spectra shown in Fig. 5. These results are discussed in detail in Sect. 4.2.2.
Spectral fit results for A1 (MCSNR J0536−6913).
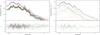 |
Fig. 5 Left: simultaneous spectral fits to the EPIC spectra of MCSNR J0536−6913. Right: EPIC-pn spectrum of MCSNR J0536−6913 from Obs. ID 0601200101 with additive model components shown. The red dash-dot-dot-dot lines represent the AXB components, blue dotted lines mark the LMC ISM, and green dashed lines represent the contamination from 30 Dor C. The black solid line represents the swept-up ISM component and the ejecta emission in shown by the orange solid line. Best-fit parameters are given in Table 6. |
3.4. Radio
Spatial distribution of the spectral indices can be seen in Fig. 6, where the change in flux density is shown across 30 Dor C between wavelengths of 36 cm and 20 cm. We produced this image by reprocessing all observations to a common u − v range and then fitting S ∝ να pixel by pixel using both images simultaneously. This image shows a distinct variation between the western and eastern sides of 30 Dor C, where the eastern side shows steeper spectral indices (−2.0 <α< −0.5), while the western side shows much flatter (−0.5 <α< 0.5), which is indicative of thermal emission. The majority of the SNR exhibits a spectral index of ~−0.7, which is consistent with younger SNRs (examples given in Bozzetto et al. 2014). However, this value is not only constrained to the immediate vicinity of the remnant, and such values can be seen extending well beyond the extent of the SNR in both the eastern and southern directions.
We calculated the fractional polarisation (P) at 20 cm using 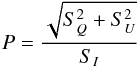 (1)where SQ,SU, and SI are integrated intensities for Q, U, and I Stokes parameters (Fig. 7). We estimate a mean fractional polarisation of 4 ± 1% across the region of 30 Dor C.
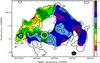 |
Fig. 6 Radio-continuum spectral map of 30 Dor C between 36 cm and 20 cm. 20 cm contours have been superimposed at levels of 1, 3, and 5 mJy. The white circle in the southern shell shows the approximate extent of the SNR. The sidebar on the right quantifies the radio spectral index. |
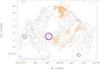 |
Fig. 7 20 cm magnetic-field vectors overlaid on 20 cm contours (1, 3, 5, 20, 50, and 100 mJy) of 30 Dor C from ATCA observations. The magenta annotation shows the approximate extent of the SNR. The ellipse in the lower left corner represents the synthesised beamwidth of 17.3″ × 15.2′′, and the line below the ellipse represents a polarisation vector of 100 per cent. |
3.5. Optical
Mathewson et al. (1985) reported on the analysis of the optical emission from 30 Dor C, including an analysis of the [S ii]/Hα ratio. An [S ii]/Hα flux ratio >0.4 indicates the presence of an SNR (Mathewson & Clarke 1973; Fesen et al. 1985). Mathewson et al. (1985) found that this ratio is < 0.3 around the superbubble. We repeated the optical emission line analysis with the MCELS data (see Fig. 8), the results of which are consistent with those of Mathewson et al. (1985). The interpretation of the lack of optical emission from MCSNR J0536−6913 is discussed in Sect. 4.2.2.
4. Discussion
4.1. 30 Dor C multi-wavelength morphology
The Hα shell of 30 Dor C is very well defined. It confines the thermal superbubble emission in the east (see Fig. 9 left) and correlates well with the non-thermal X-ray shell (see Fig. 9 right). The 20 cm radio emission also follows the morphology of the Hα shell very closely. This is consistent with the standard superbubble picture of a pressure-driven bubble pushing out into the cool ISM with the photoionisation front due to the massive stellar population producing the Hα shell. Indeed, the low [S ii]/Hα ratio (< 0.4) throughout the superbubble (Mathewson et al. 1985) points to photoionisation as the predominant mechanism producing the optical line emission. We have shown that the radio spectral indices around 30 Dor C are highly variable (Fig. 6) with an obvious dichotomy between the eastern and western shells. This was also previously noted by Mathewson et al. (1985, and references therein). The western shell exhibits very flat spectral indices (0.5 ≳ α ≳ −0.5), mostly consistent with a thermal origin. We interpret this flat spectral index as being due to contamination by the foreground molecular cloud covering the west of 30 Dor C. The eastern shell shows much steeper spectral indices (−0.6 ≳ α ≳ −2.2). The mean fractional polarisation at 20 cm is also quite low at 4 ± 1% across the region of 30 Dor C. The X-ray emission from 30 Dor C is also largely consistent with previous works in the literature. We discuss the properties of the X-ray emission in more detail in the forthcoming sections.
4.2. Thermal X-ray emission
4.2.1. Superbubble
We detected thermal emission from the southeastern and eastern regions of the superbubble, as in the previous X-ray works on 30 Dor C. BU04 detected thermal emission from shell A, SW04 from the eastern half11, and YB09 from their SE and NE regions, approximately equivalent to shells A and B. Comparison of derived spectral parameters across the analysis is difficult owing to the choice of analysis regions and, in particular, the identification of a new candidate SNR in shell A. However, it is clear in all cases that a soft thermal component (kT< 1 keV) with enhanced metal abundances is required to fit the thermal emission in 30 Dor C.
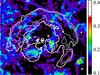 |
Fig. 8 MCELS [S ii]/Hα ratio image of 30 Dor C with 1−2 keV contours from Fig. 9-middle. The colour scale indicates the value of [S ii]/Hα. |
We detected thermal emission in regions A1, B1, and I1, which effectively delineate the south-eastern edge of 30 Dor C. This indicates a limb-brightened morphology that is consistent with the SB picture of thermal evaporation of cool material from the shell into the hot interior, as noted by SW04. There are several reasons for thermal emission not being detected in other regions of 30 Dor C. Firstly, the non-detection of thermal emission from shell C could be because of the higher absorbing column due to the foreground molecular cloud. Secondly, any thermal components present in the spectra of shell C are likely dominated by the non-thermal emission, making their contribution to the spectra difficult to identify. We suspect that this may be the case for the regions B2, B3, and D where the absorption is less (by about half or lower) than in shell C, yet no thermal emission could be identified. However, in the case of B3 we note that the best-fit spectral model yielded a relatively poor fit ( ) with residuals at thermal line energies, most notably at ~0.9 keV (Ne IX). Attempts to improve the model by including a thermal component were unsuccessful, though it seems clear that there must be at least some thermal contribution. A further reason for the non-detection of thermal emission in other regions could simply be that the thermal emission is enhanced in the southeastern and eastern shells. This could be the case if an SN occurred nearby and is now interacting with the shell wall and/or if the ambient density towards the east and southeast is higher.
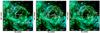 |
Fig. 9 MCELS RGB ([S ii], Hα, [O iii]) image of 30 Dor C with 0.3−1 keV contours (left), 1−2 keV contours (middle), and 2−7 keV contours (right). The contour levels in each case were chosen arbitrarily to highlight X-ray features discussed in Sect. 3.3.1. It is clear from these images that the hard X-ray morphology is tightly correlated with the northern Hα shell. |
The determined plasma temperatures in A2, B1, and I1 reveal slight variations between the regions. I1 exhibits the hottest thermal component with kT = 0.40 (0.37−0.46), B1 being slightly cooler with kT = 0.31 (0.28−0.34), and A2 being the coolest with kT = 0.18 (0.17−0.19). Such plasma temperatures have been observed in many other LMC SBs (e.g., Dunne et al. 2001; Cooper et al. 2004). Another characteristic of the thermal emission is the overabundant O, Ne, and Mg to account for the observed line emission. Such α-enrichment is evidence of a recent core-collapse (CC) SNR interaction with the shell, which also agrees with the suggestion that the thermal emission is enhanced in the southeastern and eastern regions thanks to an SNR impact on the shell. Additionally, the metal enrichment in this region can also result in higher X-ray luminosity (Silich et al. 2001). The interaction of an off-centre SNR with an SB shell wall has also been suggested as an explanation for the overabundances and/or limb-brightened morphologies observed in LMC SBs DEM L50 and DEM L152 (Jaskot et al. 2011).
Evidence of a recent SNR, responsible for the enhanced abundances in the eastern part of the bubble, would be the presence of a compact object. BU04 detected three candidates in 30 Dor C. One of these, their Source 6, is located in the eastern part of the superbubble, immersed in the thermal emission, and may be the compact remnant of the SN explosion responsible for the metal enrichment in the region. BU04 found a featureless spectrum for Source 6 that was best modelled with a power law with Γ = 1.8(1.5−2.3) and the 0.5−9 keV X-ray luminosity of 7.8 × 1033 erg s-1. They also found no evidence for any long-term variability or pulsations from the object.
To add to this analysis, we extracted XMM-Newton spectra from Source 6 taking the backgrounds from a nearby region in 30 Dor C to, as much as possible, account for the contaminating emission. Due to the low count rate of the object and the poorer resolution of XMM-Newton we decided to merge the EPIC spectra from all the observations using the task epicspeccombine12. Spectral fit results to the combined spectrum are fully consistent with those of BU06. We also do not observe any obvious long-term variation in the flux of Source 6 though the low net counts in each observation makes this difficult to identify.
4.2.2. MCSNR J0536-6913
We obtained an acceptable fit for the X-ray spectrum of MCSNR J0536−6913, by assuming a physical model of ejecta plus swept-up ISM components (see Sect. 3.3.3). The detection of emission lines from α-process elements in the ejecta component points to a CC origin for MCSNR J0536−6913. It is possible to determine the abundance ratios in the ejecta based on the abundance parameters of the metals. These ratios can then be compared to theoretical explosive nucleosynthesis yield tables to determine the mass of the stellar progenitor. We assumed that the ejecta are well mixed; i.e., the abundance distribution in the shocked ejecta is representative of the ejecta in general, and it follows that the metals are co-spatial. We can estimate the emission measure of each metal from the normalisation parameter of the fit component. Even if the plasma only comprises metals, XSPEC outputs the normalisation (K) in terms of the emission measure of H (nenHV); i.e, 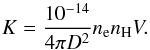 (2)This equation can be adjusted to determine the emission measure (nenXV) for element X by substituting nH for nX = (nX/nH)⊙(ZX/ZX⊙), where (nX/nH)⊙ is the solar abundance of X from Wilms et al. (2000), and (ZX/ZX⊙) is the abundance of X in the spectral fits. We determined the emission measure for O, Ne, Mg, and Si in this manner. Since we assume that the ejecta are well mixed, ne and V can be taken as the same for each emission measure. Finally, we determined the value of [X/O] (the logarithm of the ratio of the X to the O abundance compared to the solar value) for Ne, Mg, and Si in order to compare the abundance ratios to the theoretical models. The value of [O/O] is naturally 0 and without error since we fixed the O abundance in our fits. For the comparison, we used data from the Yields Table 201313 (see also Nomoto et al. 2013, and references therein). In Fig. 10 we show the theoretical explosive nucleosynthesis yields for a range of progenitor masses with approximately LMC metallicity, adopting the canonical explosion energy of 1051 erg. The ejecta’s abundance pattern determined in our spectral analysis is also shown. The values of [Ne/O] and [Mg/O] suggest a progenitor mass of ~18 M⊙, but [Si/O] is out of the range of progenitor masses. A possible reason for this is that, contrary to our earlier assumption, the observed Si abundance in the shocked ejecta is not representative of the ejecta as a whole. This might be the case if the higher mass elements are located closer to the interior of MCSNR J0536−6913 and still have to be shocked by the reverse shock, meaning the [Si/O] value in the outer ejecta is misleading. We also note that the error bars are determined from the 90% confidence intervals of the fit parameters. Applying a more stringent error constraint results in larger error bars. Consequently, the data would be more consistent with a higher mass progenitor of ≳40 M⊙.
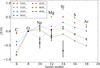 |
Fig. 10 Abundance ratios of metals to O in the ejecta, relative to the corresponding solar ratios. MCSNR J0536−6913 data are in black. Theoretical yields for various progenitor masses determined from the Yields Table 2013 (see also Nomoto et al. 2013) are also included. Error bars are calculated from 90% confidence intervals of fit parameters. |
To investigate the distribution of the ejecta, we made use of the available Chandra data (see Sect. 2.3.2). Since the ACIS-S aimpoint of the observation was SN 1987A, MCSNR J0536−6913 is located ~5′ away on the front-illuminated S4 chip. This results in a degradation of spatial resolution to ~2″ (~0.5 pc at the LMC distance). This is still superior to the XMM-Newton observations. We created exposure-corrected images in the 0.5−0.7 keV (O lines), 0.7−1.1 keV (Ne lines), and 1.1−2 keV (Mg and Si lines), whose RGB composition is shown in Fig. 11. They were binned by a factor of 2 to improve count statistics and smoothed with a Gaussian kernel of 2″. The shell structure detected in the XMM-Newton data is also evident here; however, we can already see that the north-western region contains more O and/or swept-up ISM than in the north-east and that our assumption of a representative well-mixed ejecta is an over-simplification. Unfortunately, with only ~700 background-subtracted counts for the visible northern arc, a robust spectral analysis is simply not possible. Only a very deep on-axis Chandra observation will allow for a detailed analysis of the distribution of ejecta in MCSNR J0536−6913 and lead to a better estimate of the progenitor mass.
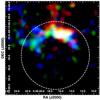 |
Fig. 11 Combined 99+18 ks Chandra image of MCSNR J0536−6913. Red = 0.5−0.7 keV (strong O lines), green =0.7−1.1 keV (Ne lines), and blue = 1.1−2 keV (Mg and Si lines). The images are binned by a factor of 2 to improve count statistics and smoothed with a Gaussian kernel of 2″. The white dashed circle indicates the dimensions of the remnant determined in Sect. 3.1. |
For our spectral fits we assumed contributions from swept-up ISM and ejecta emission. We found that MCSNR J0536−6913 is most likely in the ejecta-dominated stage of its evolution. Many of the best studied Galactic SNRs are currently in this phase (e.g., SN 1006, Tycho, Kepler, and Cas A). Neither the free expansion nor Sedov-Taylor solutions are appropriate for describing the evolution of the remnant during the ejecta-dominated phase since both the swept-up mass and ejecta mass must be considered. The analytical solution for the smooth transition from free expansion to the Sedov phase was given by Truelove & McKee (1999). The characteristic radius, time, and mass of the SNR system are determined using their equations 1, 2, and 3, assuming a uniform ambient ISM (n = 0 case). To calculate these characteristic values for MCSNR J0536−6913, we needed to determine the initial explosion energy (E0), ambient mass density (ρ0), and the ejecta mass (Mej). The value E0 was simply taken as the canonical 1 × 1051 erg.
Since MCSNR J0536−6913 appears to be immersed in an HII region, we can assume that the ISM is consistent with that of the warm-phase (T ~ 104 K) and the ambient number density (n0) is ~0.1 cm-3. The swept-up mass for n0 ~ 0.1 cm-3 and a radius r = 8(±1) pc is 7(±1) M⊙, consistent with the transition phase of MCSNR J0536−6913. If the ambient density were an order of magnitude higher (i.e., n0 ~ 1 cm-3), the mass swept up by the remnant is 74(±9) M⊙, which would dominate the ejecta, and the remnant would be well into the Sedov phase. The parameter n0 is related to ρ0 through ρ0 = n0μ0, where μ0 = 1.4mp is the mean mass per nucleus. Thus, ρ0 = 2.3 × 10⁻²⁵ g cm-3.
From the ejecta abundance ratios of our assumed model fits, we determined the likely mass of the stellar progenitor to be either ~18 M⊙ or as high as ≳40 M⊙. At the LMC metallicity, an ~18 M⊙ star will spend most of its post-main sequence lifetime in the blue-supergiant (BSG) phase (Schaerer et al. 1993). Assuming that the star sheds its H envelope leading up to the SN event, then Mej ~ 7 M⊙ (Yields Table 2013). Using these values we determined the characteristic parameters of MCSNR J0536−6913 and calculated various remnant properties using the shock trajectory parameters of Truelove & McKee (1999) for the n = 0, s = 10 case (see their Table 6) where the s value is appropriate for the ejecta distribution of a BSG progenitor. We determined a value of ~9 pc for the radius at which the SNR will transition (rtr) from the free-expansion to the Sedov phase. We estimated the radius of the remnant to be 8 (±1) pc, suggesting that the remnant is on the verge of the transition. The time at which the r = rtr was determined to be ttr ~ 2.2 kyr, which is a relatively long time to the transition but in keeping with the expansion into a low-density ISM. If MCSNR J0536−6913 is on the boundary of the transition, then ttr must approximately represent its age. For a ~40 M⊙ star, the same treatment results in ttr ~ 4.9 kyr and rtr ~ 12 pc for an ejecta mass of ~18 M⊙ (Yields Table 2013); however, this ejecta mass assumes no fall-back which is likely not the case. In this situation, the remnant is in the very early stages of the transition and the resulting ttr ~ 4.9 kyr is an upper limit to the age. From the progenitor mass estimates, we therefore set a likely age range of 2.2−4.9 kyr for MCSNR J0536−6913. We caution, however, that this age range determination is subject to our assumptions. In addition the model of Truelove & McKee (1999) does not take several effects into account, such as the Rayleigh-Taylor instability, thermal conduction, magnetic fields, or cosmic ray acceleration, all of which may alter the dynamical evolution of the remnant.
With a likely progenitor mass of ≳18 M⊙ and emission lines of O, Ne, and Mg in the ejecta component of its spectrum, MCSNR J0536−6913 appears to fall into the ejecta-dominated O-rich SNR class. These remnants are of particular importance because the stellar interior fragments are exposed, providing direct probes of stellar evolution and nucleosynthesis models. It has been suggested by Blair et al. (2000), for example, that some ejecta-dominated O-rich SNRs result from Type Ib explosions of massive Wolf-Rayet stars. The LMC contains a small number of such remnants, namely N132D (Lasker 1978) and SNR 0540−69.3 (Clark et al. 1982). The SMC also contains a small population, e.g., 1E 0102.2−7219 (E0102) (Seward & Mitchell 1981) and 0103-72.6 (Park et al. 2003).
These objects are also noteworthy for their extraordinarily high X-ray luminosities, with N132D and E0102 being the brightest SNRs in the LMC and SMC, respectively. Progenitor mass estimates for these SNRs are ~60 M⊙ for N132D (Blair et al. 2000) and ~30 M⊙ for E0102 (Finkelstein et al. 2006). Morphologically, MCSNR J0536−6913 is most like E0102 (Seward & Mitchell 1981). The X-ray morphology of E0102 presents as a ring of ejecta with fainter emission behind the blast wave owing to shock-heated ISM. MCSNR J0536−6913 is similar in this regard, assuming that our adopted spectral models are representative of the physical composition of the remnant. MCSNR J0536−6913 is larger than E0102 with their radii of ~8 pc and ~6 pc, respectively, of similar age, 2.2−4.9 kyr and 2±0.55 kyr (Finkelstein et al. 2006), and fainter in X-rays, ~1035 erg s-1 and ~1037 erg s-1 (Gaetz et al. 2000). The most likely reason for these differences is the relatively tenuous environment into which MCSNR J0536−6913 appears to be expanding. Therefore, MCSNR J0536−6913 seems to be a large analogue for the early evolution of an O-rich SNR.
The X-ray shell morphology and spectral signatures derived from our assumed models suggest that a CC SNR is responsible for the extended emission. Multi-wavelength tracers for the SNR are not so clear-cut, however. The classic optical signature is the strength of their [S ii] lines relative to Hα, with an [S ii]/Hα> 0.4 characteristic of SNR emission (Mathewson & Clarke 1973). Mathewson et al. (1985) found no indication of an [S ii]/Hα ratio that is consistent with shock ionisation by an SNR from any region of 30 Dor C, meaning there is no optical signature for an SNR at the position of MCSNR J0536−6913 (see also Sect. 3.5). We repeated this analysis with the MCELS data, and the [S ii]/Hα ratio image is shown in Fig. 8. Dopita (1977) demonstrated that this characteristic ratio was the result of SNR shocks, with velocities 100 km s-1, collisionally ionising and exciting an ambient ISM of sufficiently high density, and subsequent emission line cooling.
It is also possible that overrun clouds containing secondary shocks capable of producing the characteristic [S ii]/Hα signature could exist, even if the primary shock is travelling at ~1000 km s-1. We have shown that MCSNR J0536−6913 is most likely in the transition phase between the free expansion and Sedov phases, so the SNR shock velocities should be of the order of 1000 km s-1. Also, we inferred that the density of the ambient medium is quite low (n0 ~ 0.1 cm-3). As a result, we would not expect to see the characteristic [S ii]/Hα emission from swept-up ISM, but emission due to secondary shocks could be present. However, this is likely to be overwhelmed by contamination by the photoionisation emission from the shell of 30 Dor C, making any identification difficult. Rather, we expect that the optical emission is dominated by emission lines of the O-rich ejecta (e.g., O ii and O iii), such as observed in E0102 (Blair et al. 2000).
We found a relatively steep radio spectral index of ~−0.7 for most of the SNR (see magenta circle in Fig. 6), which is consistent with a young remnant (see examples of Bozzetto et al. 2014). However, this value is not only constrained to the immediate vicinity of the remnant so it is unclear as to whether this radio spectral index is representative of MCSNR J0536−6913 or the result of contamination by 30 Dor C. In addition, we do not find the typical radial magnetic field (which is a property of younger remnants) around MCSNR J0536−6913 (see Fig. 7), so this may infer possible compression of the region by 30 Dor C, rotation through a dense medium, or the possibility that this polarisation is simply not from the SNR. For these reasons, we cannot definitively associate any radio emission with MCSNR J0536−6913.
4.3. Non-thermal X-ray emission
Our analysis of the deep XMM-Newton data has revealed that a non-thermal component is present in all regions of 30 Dor C, not just in the bright shell regions. This verifies that the higher emission levels from the shell is a limb-brightening effect. This is supported further by the multi-wavelength morphology (see Sect. 4.1) because the hard X-ray shell is highly correlated with the Hα and radio shells.
YB09 show that the non-thermal emission mechanism in the shell is most likely synchrotron via their rejection of a simple power law compared to an srcut model for shell C. Thus, the photon spectrum, hence the underlying electron energy spectrum, was observed to roll off. For their fits, the authors assumed a range of radio spectral indices appropriate for young SNRs. Ideally, we would like to use the radio data in combination with the X-ray data to fit the synchrotron spectrum; however, this is problematic for shell C given the significant thermal contamination at radio wavelengths. Instead, we turn our attention to shell-B, which contains the second brightest region of non-thermal X-ray emission in 30 Dor C. In addition, shell B is largely free of thermal radio contamination, and we thus assume that the radio emission is entirely synchrotron. We also assume that the hard X-rays are due to synchrotron emission. We can therefore create a spectral energy distribution (SED) of the photon spectrum due to the underlying relativistic electron population.
For the radio points, we measured the integrated flux density at 36 cm and 20 cm from shell B. Images at both wavelengths were convolved to the same resolution. This resulted in integrated flux density measurements of 420 mJy at 36 cm and 224 mJy at 20 cm. For the X-ray points, we extracted a spectrum from shell B from the EPIC-pn data of Obs. ID 0601200101, the deepest of the EPIC-pn observations. We then extracted and subtracted an adjacent background region to ensure as much as possible that only X-rays due to 30 Dor C were present. We confined our analysis to the 1.5−7 keV energy range because the thermal emission in shell-B becomes significant below this. The radio and X-ray data points are shown in Fig. 12.
We initially fitted the SED with a straight power law. However it was immediately clear the X-ray fluxes were much lower than expected from the radio data. Thus, we introduced a cut-off electron distribution of the form Ne(E) = KE− αe− E/Emax, where E is the electron energy, Emax the cut-off energy, α the spectral index, and K a constant. We make the assumption that each electron emits all its energy at its characteristic frequency (the δ-function approximation), and thus the resulting photon spectrum cuts off as e− (ν/νmax)1 / 2 (Reynolds 1998). This cut-off function provides a much better fit to the SED of shell B with α = 0.75(±0.02), and νmax = 3.1(±0.7) × 1017 Hz. The fit is shown in Fig. 12, along with the extrapolation of the straight power law. In this case, νmax is the characteristic frequency of a photon emitted by an electron at the maximum energy of the electron distribution Emax. This value also depends on the magnetic field and is given by the equation for characteristic frequency νc = 1.82 × 10¹⁸E2B (Reynolds 1998). From this equation, we estimated Emax in terms of the magnetic field to be Emax [ (B/ 10 μG) ] 1 / 2 ~ 80 TeV. That the spectrum is observed to roll off is further evidence that the non-thermal X-ray emission from 30 Dor C is synchrotron in origin.
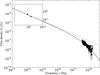 |
Fig. 12 Spectral energy distribution of synchrotron emission from shell B of 30 Dor C. The solid line shows the cut-off power law fit with the dotted line showing the extrapolation of the straight power law. The radio fluxes are at 36 cm and 20 cm, and are shown in the inset to reduce the axis scales of the plot. The X-ray data are the 1.5−7 keV range. |
The main problem with a synchrotron interpretation for the hard shell is the supply of relativistic electrons. In the SNR interpretation of BU04 and YB09, these particles are naturally produced by the strong shocks and associated processes. However, as already discussed, the SNR case should not be possible, and there is no multi-wavelength support to this scenario (e.g., [S ii]/Hα ratio, clear SNR radio shell, fast-moving material). SW04 discussed the possibility that the particles may arise from either the wind-termination shock or the bubble turbulence, though suggesting that these either may not be feasible or be too inefficient. However, the suggestion of the bubble as the source of the particles has merit.
Parizot et al. (2004, and references therein) show that the bubble is capable of efficiently supplying a population of non-thermal particles all the way up to 1017 eV (see also Bykov & Toptygin 2001) through repeated acceleration of low energy particles via turbulence and magnetohydrodynamic (MHD) waves in a superbubble interior caused by the strong stellar wind-wind interactions, interior SNR shocks, and high density clumps of material in the bubble. In addition, Bykov (2001) determined that 20% to 40% of the kinetic energy supplied by the stellar population can be transferred to low energy non-thermal particles, and the efficiency is time dependent, peaking after ~3 Myr (see Butt & Bykov 2008, for an application to the DEM L192 superbubble). Observational evidence for this superbubble particle acceleration process has recently been found through γ-ray emission from the Cygnus superbubble detected by Fermi (Ackermann et al. 2011).
SW04 estimated the integrated stellar wind luminosity to be (1−7) × 1037 erg s-1 for the 26 O-stars in 30 Dor C. In addition, the seven known WR stars located in 30 Dor C (Testor et al. 1993) are also currently supplying a significant amount of mechanical energy via their fast, dense winds. We adopted mass loss rates and velocities from Leitherer et al. (1997) for the known WR-types and corrected the mass loss rates for the metallicity of the LMC according to Crowther (2007). This yielded a combined WR luminosity of ~5 × 1038 erg s-1. The WR lifetimes are ~7 × 10⁵ yr (Leitherer et al. 1997), so when averaged over the age of the bubble (taken as 4 Myr to be consistent with SW04), they supply ~8 × 1037 erg s-1. In addition, SW04 estimated that 5−6 SN have occurred in 30 Dor C. When assuming the canonical 1051 erg input per explosion, this corresponds to an average input of (4−5) × 1037 erg s-1. Thus, the total averaged energy input by the stellar population and SNe is (1−2) × 1038 erg s-1. Then, from Bykov (2001) we have (2−8) × 1037 erg s-1 transferred to non-thermal particles at peak efficiency. Some fraction of these are electrons that eventually diffuse out to the superbubble shell, and if captured in the magnetic field (probably ~10 μG assuming a compressed ISM), they can radiate via the synchrotron process, though it is unclear how efficient a process this would be. The total observed X-ray luminosity of the non-thermal component of the shell is ~1036 erg s-1 which is an order of magnitude less than the energy of the non-thermal particles. Thus, the particle flux from the bubble could potentially explain the observed synchrotron emission.
4.3.1. Why 30 Dor C?
We have addressed the non-thermal X-ray emission of 30 Dor C using a multi-wavelength approach and found that a synchrotron origin is most likely. However, one must also consider why 30 Dor C and no other superbubble in the LMC exhibits such a bright non-thermal shell morphology. If we assume that the non-thermal emission must be due to high energy particles produced in the bubble then shouldn’t all superbubbles exhibit similar properties? The answer could simply be that we are observing 30 Dor C at exactly the right time. Bykov (2001) showed that the efficiency of non-thermal particle production in a superbubble is time dependent, peaking at about 3 Myr, which is near the age of 30 Dor C (assumed to be 4 Myr). In addition, given that 30 Dor C is currently at the stage of containing a high mass stellar population, including several WR stars, and interior SNRs, then the energy available for particle production is quite high. For our calculation of the particle production in Sect. 4.3, we assumed that the input energy is averaged over the age of the bubble. However, this must be an oversimplification because the onset of SNe must cause spikes in shock energies and turbulence in the interior as the strong shock propagates through the bubble. The current energy input from stellar winds alone in 30 Dor C is (5−6) × 1038 erg s-1, dominated by the WR population. This is many times the current stellar input of other LMC SBs with values of ~1 × 1038 erg s-1 for LH9 in N 11 (Maddox et al. 2009), ~6 × 1037 erg s-1 in N 51D (Cooper et al. 2004), ~7 × 1037 erg s-1 for N 70 (Rodríguez-González et al. 2011; De Horta et al. 2014), (1−2) × 1038 erg s-1 in N 158 (Sasaki et al. 2011), and ~9 × 1037 erg s-1 in N 206 (Kavanagh et al. 2012). In addition, we presented evidence of a recent SN near the eastern shell wall in 30 Dor C. Although the eastern blast wave of this SNR interacted with the shell wall, the western side propagated into the bubble, adding to the energy available for particle production. For these reasons we suggest that 30 Dor C is currently undergoing a phase of high energy particle production. If this is the case then other superbubbles must also undergo such stages in their evolution, and the energy losses due to the particle production and non-thermal processes must be considered in their overall energy budgets, which could alleviate the superbubble growth-rate discrepancy, as suggested by Butt & Bykov (2008).
5. Summary
We have presented an analysis of the large amount of XMM-Newton data available for 30 Dor C, supplemented by X-ray data from Chandra, optical emission line data from the MCELS, and radio continuum data from ATCA and MOST. The results of our analysis can be summarised as follows:
-
1.
We detected substantial thermal X-ray emissionfrom the east of 30 Dor C.We analysed the superbubble thermal emissionand determined plasma temperatures in the rangekT = (0.17−0.46) keV with overabundances O, Ne, and Mg. Such α-enrichment is evidence of a recent CC SNR interaction with the shell.
-
2.
The new SNR MCSNR J0536−6913 was identified through its clear shell morphology in the 1−2 keV band. The shell morphology is extraordinarily circular with a north-south brightness gradient. There is no obvious indication of any optical or radio emission associated with the SNR. We suggested that MCSNR J0536−6913 is most likely located outside of 30 Dor C since we would not expect to observe any shell morphology had the blast wave propagated through the SB interior. In addition, the brighter emission from the north of the SNR suggests it is evolving into a higher density medium than in the south, which again goes against its being located in the bubble. We determined a radius of ~8(±1) pc. Our X-ray analysis with assumed physical models shows that the remnant is most likely ejecta-dominated with strong lines of O, Ne, Mg, and Si. Based on the derived ejecta abundance ratios, we determined the likely mass of the stellar progenitor to be either ~18 M⊙ or as high as ≳40 M⊙, though the spectral fits are subject to simplifying assumptions (e.g., uniform temperature and well-mixed ejecta). With this progenitor mass range, we set a likely age range of 2.2−4.9 kyr for MCSNR J0536−6913.
-
3.
Using the XMM-Newton data we detected non-thermal X-ray emission from all regions of 30 Dor C, not just from the bright shell as previously reported, verifying that the higher emission levels from the shell is a limb-brightening effect. This is supported further by the multi-wavelength morphology since the hard X-ray shell is highly correlated with the Hα and radio shells. We found that the non-thermal X-ray emission can be fitted equally well with power-law or srcut models. X-ray and radio data are used to produce an SED for the north-eastern shell region of 30 Dor C, which is the second brightest region of non-thermal X-ray emission, but it is free of thermal contamination of the radio spectrum. We find that an exponentially cut-off synchrotron model is required to fit the SED with α = 0.75(±0.02) and νmax = 3.1(±0.7) × 1017 Hz. We estimate the maximum energy of the underlying electron distribution in terms of the magnetic field to be Emax [ (B/ 10 μG) ] 1 / 2 ~ 80 TeV. That the spectrum is observed to roll off is evidence that the non-thermal X-ray emission from 30 Dor C is synchrotron in origin, which was previously suggested by YU09. However, we argued that this synchrotron emission is not due to an expanding SNR but rather to non-thermal particles produced in the bubble interior being captured in the magnetic field of the shell, which then radiate via the synchrotron process. We showed that the bubble is capable of supplying the required particle flux. We argued that 30 Dor C is currently undergoing a phase of high energy particle production owing to its high-mass stellar population and possibly a recent interior SNR.
Online material
Appendix A: Spectral fit figures
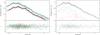 |
Fig. A.1 Left: simultaneous spectral fits to the EPIC spectra of B1. Right: EPIC-pn spectrum of MCSNR J0536−6913 from Obs. ID 0601200101 (deepest EPIC-pn observation) with additive model components shown. The red dash-dot-dot-dot lines represent the AXB components, the magenta dash-dot line shows the instrumental fluorescence line, blue dotted lines mark the LMC ISM, and green dashed lines represent the source components (source model = vapec+pow). Best-fit parameters are given in Table 5. |
We note that the non-thermal detection in LMC SBs N 11, N 51D, and N 70 has been called into question (Yamaguchi et al. 2010; De Horta et al. 2014).
Synchrotron spectrum from an exponentially cut off power-law distribution of electrons in a homogeneous magnetic field (Reynolds 1998).
Available at http://heasarc.gsfc.nasa.gov/docs/xmm/xmmhp_xmmesas.html
Both available at http://cxc.harvard.edu/ciao/
The remaining spectral fit figures are deferred to Appendix A.
We note that these authors also included a thermal component in their fits to the western half of 30 Dor C; however, it was dominated by their non-thermal emission component.
The epicspeccombine task only became available in version 13 of the SAS. The observational data was re-processed accordingly to ensure compatibility with the newer version.
Available at http://star.herts.ac.uk/~chiaki/works/YIELD_CK13.DAT
Acknowledgments
We wish to thank the anonymous referee for the constructive suggestions for improving the paper. This work made use of the XMM-Newton Extended Source Analysis Software. Cerro Tololo Inter-American Observatory (CTIO) is operated by the Association of Universities for Research in Astronomy Inc. (AURA), under a cooperative agreement with the National Science Foundation (NSF) as part of the National Optical Astronomy Observatories (NOAO). We gratefully acknowledge the support of CTIO and all the assistance that was provided for upgrading the Curtis Schmidt telescope. The MCELS project has been supported in part by NSF grants AST-9540747 and AST-0307613, and through the generous support of the Dean B. McLaughlin Fund at the University of Michigan, a bequest from the family of Dr. Dean B. McLaughlin in memory of his lasting impact on Astronomy. We used the karma software package developed by the ATNF. The Australia Telescope Compact Array is part of the Australia Telescope, which is funded by the Commonwealth of Australia for operation as a National Facility managed by CSIRO. P.J.K. acknowledges support from the Bundesministerium für Wirtschaft und Technologie/Deutsches Zentrum für Luft- und Raumfahrt (BMWi/DLR) grants FKZ 50 OR 1209 and FKZ 50 OR 1309, and P. M. from grant FKZ 50 OR 1201. M.S. acknowledges support by the Deutsche Forschungsgemeinschaft through the Emmy Noether Research Grant SA2131/1-1.
References
- Ackermann, M., Ajello, M., Allafort, A., et al. 2011, Science, 334, 1103 [NASA ADS] [CrossRef] [PubMed] [Google Scholar]
- Arnaud, K. A. 1996, in Astronomical Data Analysis Software and Systems V, eds. G. H. Jacoby, & J. Barnes, ASP Conf. Ser., 101, 17 [Google Scholar]
- Balucinska-Church, M., & McCammon, D. 1992, ApJ, 400, 699 [NASA ADS] [CrossRef] [Google Scholar]
- Bamba, A., Ueno, M., Nakajima, H., & Koyama, K. 2004, ApJ, 602, 257 [NASA ADS] [CrossRef] [Google Scholar]
- Blair, W. P., Morse, J. A., Raymond, J. C., et al. 2000, ApJ, 537, 667 [NASA ADS] [CrossRef] [Google Scholar]
- Bojičić, I. S., Filipović, M. D., Parker, Q. A., et al. 2007, MNRAS, 378, 1237 [NASA ADS] [CrossRef] [Google Scholar]
- Bozzetto, L. M., Filipović, M. D., Urošević, D., Kothes, R., & Crawford, E. J. 2014, MNRAS, 440, 3220 [NASA ADS] [CrossRef] [Google Scholar]
- Butt, Y. M., & Bykov, A. M. 2008, ApJ, 677, L21 [NASA ADS] [CrossRef] [Google Scholar]
- Bykov, A. M. 2001, Space Sci. Rev., 99, 317 [Google Scholar]
- Bykov, A. M., & Toptygin, I. N. 2001, Astron. Lett., 27, 625 [NASA ADS] [CrossRef] [Google Scholar]
- Chen, L.-W., Fabian, A. C., & Gendreau, K. C. 1997, MNRAS, 285, 449 [NASA ADS] [CrossRef] [Google Scholar]
- Clark, D. H., Tuohy, I. R., Dopita, M. A., et al. 1982, ApJ, 255, 440 [NASA ADS] [CrossRef] [Google Scholar]
- Cooper, R. L., Guerrero, M. A., Chu, Y.-H., Chen, C.-H. R., & Dunne, B. C. 2004, ApJ, 605, 751 [NASA ADS] [CrossRef] [Google Scholar]
- Crowther, P. A. 2007, ARA&A, 45, 177 [NASA ADS] [CrossRef] [Google Scholar]
- De Horta, A. Y., Sommer, E. R., Filipović, M. D., et al. 2014, AJ, 147, 162 [NASA ADS] [CrossRef] [Google Scholar]
- De Luca, A., & Molendi, S. 2004, A&A, 419, 837 [NASA ADS] [CrossRef] [EDP Sciences] [Google Scholar]
- Dennerl, K., Haberl, F., Aschenbach, B., et al. 2001, A&A, 365, L202 [NASA ADS] [CrossRef] [EDP Sciences] [Google Scholar]
- di Benedetto, G. P. 2008, MNRAS, 390, 1762 [NASA ADS] [Google Scholar]
- Dickey, J. M., & Lockman, F. J. 1990, ARA&A, 28, 215 [NASA ADS] [CrossRef] [MathSciNet] [Google Scholar]
- Dopita, M. A. 1977, ApJS, 33, 437 [NASA ADS] [CrossRef] [Google Scholar]
- Dunne, B. C., Points, S. D., & Chu, Y.-H. 2001, ApJS, 136, 119 [NASA ADS] [CrossRef] [Google Scholar]
- Fesen, R. A., Blair, W. P., & Kirshner, R. P. 1985, ApJ, 292, 29 [NASA ADS] [CrossRef] [Google Scholar]
- Filipovic, M. D., Haynes, R. F., White, G. L., & Jones, P. A. 1998, A&AS, 130, 421 [NASA ADS] [CrossRef] [EDP Sciences] [Google Scholar]
- Finkelstein, S. L., Morse, J. A., Green, J. C., et al. 2006, ApJ, 641, 919 [NASA ADS] [CrossRef] [Google Scholar]
- Fruscione, A., McDowell, J. C., Allen, G. E., et al. 2006, in SPIE Conf. Ser., 6270 [Google Scholar]
- Gaetz, T. J., Butt, Y. M., Edgar, R. J., et al. 2000, ApJ, 534, L47 [NASA ADS] [CrossRef] [Google Scholar]
- Garmire, G. P., Bautz, M. W., Ford, P. G., Nousek, J. A., & Ricker, Jr., G. R. 2003, in X-Ray and Gamma-Ray Telescopes and Instruments for Astronomy, eds. J. E. Truemper, & H. D. Tananbaum, SPIE Conf. Ser., 4851, 28 [Google Scholar]
- Gooch, R. 1995, in Astronomical Data Analysis Software and Systems IV, eds. R. A. Shaw, H. E. Payne, & J. J. E. Hayes, ASP Conf. Ser., 77, 144 [Google Scholar]
- Heng, K., Haberl, F., Aschenbach, B., & Hasinger, G. 2008, ApJ, 676, 361 [NASA ADS] [CrossRef] [Google Scholar]
- Jaskot, A. E., Strickland, D. K., Oey, M. S., Chu, Y.-H., & García-Segura, G. 2011, ApJ, 729, 28 [NASA ADS] [CrossRef] [Google Scholar]
- Johansson, L. E. B., Greve, A., Booth, R. S., et al. 1998, A&A, 331, 857 [NASA ADS] [Google Scholar]
- Kavanagh, P. J., Sasaki, M., & Points, S. D. 2012, A&A, 547, A19 [NASA ADS] [CrossRef] [EDP Sciences] [Google Scholar]
- Kuntz, K. D., & Snowden, S. L. 2008, A&A, 478, 575 [NASA ADS] [CrossRef] [EDP Sciences] [Google Scholar]
- Kuntz, K. D., & Snowden, S. L. 2010, ApJS, 188, 46 [NASA ADS] [CrossRef] [Google Scholar]
- Lasker, B. M. 1978, ApJ, 223, 109 [NASA ADS] [CrossRef] [Google Scholar]
- Leitherer, C., Chapman, J. M., & Koribalski, B. 1997, ApJ, 481, 898 [NASA ADS] [CrossRef] [Google Scholar]
- Le Marne, A. E. 1968, MNRAS, 139, 461 [NASA ADS] [CrossRef] [Google Scholar]
- Long, K. S., Helfand, D. J., & Grabelsky, D. A. 1981, ApJ, 248, 925 [NASA ADS] [CrossRef] [Google Scholar]
- Lucke, P. B., & Hodge, P. W. 1970, AJ, 75, 171 [NASA ADS] [CrossRef] [Google Scholar]
- Mac Low, M.-M., & McCray, R. 1988, ApJ, 324, 776 [NASA ADS] [CrossRef] [Google Scholar]
- Maddox, L. A., Williams, R. M., Dunne, B. C., & Chu, Y.-H. 2009, ApJ, 699, 911 [NASA ADS] [CrossRef] [Google Scholar]
- Maggi, P., Haberl, F., Sturm, R., & Dewey, D. 2012, A&A, 548, L3 [NASA ADS] [CrossRef] [EDP Sciences] [Google Scholar]
- Maggi, P., Haberl, F., Kavanagh, P. J., et al. 2014, A&A, 561, A76 [NASA ADS] [CrossRef] [EDP Sciences] [Google Scholar]
- Mathewson, D. S., & Clarke, J. N. 1973, ApJ, 179, 89 [NASA ADS] [CrossRef] [Google Scholar]
- Mathewson, D. S., Ford, V. L., Tuohy, I. R., et al. 1985, ApJS, 58, 197 [NASA ADS] [CrossRef] [Google Scholar]
- Mills, B. Y., Turtle, A. J., Little, A. G., & Durdin, J. M. 1984, Aust. J. Phys., 37, 321 [NASA ADS] [CrossRef] [Google Scholar]
- Muno, M. P., Law, C., Clark, J. S., et al. 2006, ApJ, 650, 203 [NASA ADS] [CrossRef] [Google Scholar]
- Mineo, S., Gilfanov, M., & Sunyaev, R. 2012, MNRAS, 426, 1870 [NASA ADS] [CrossRef] [Google Scholar]
- Nomoto, K., Kobayashi, C., & Tominaga, N. 2013, ARA&A, 51, 457 [NASA ADS] [CrossRef] [Google Scholar]
- Parizot, E., Marcowith, A., van der Swaluw, E., Bykov, A. M., & Tatischeff, V. 2004, A&A, 424, 747 [NASA ADS] [CrossRef] [EDP Sciences] [Google Scholar]
- Park, S., Hughes, J. P., Burrows, D. N., et al. 2003, ApJ, 598, L95 [NASA ADS] [CrossRef] [Google Scholar]
- Reynolds, S. P. 1998, ApJ, 493, 375 [NASA ADS] [CrossRef] [Google Scholar]
- Rodríguez-González, A., Velázquez, P. F., Rosado, M., et al. 2011, ApJ, 733, 34 [NASA ADS] [CrossRef] [Google Scholar]
- Russell, S. C., & Dopita, M. A. 1992, ApJ, 384, 508 [NASA ADS] [CrossRef] [Google Scholar]
- Sasaki, M., Gaetz, T. J., Blair, W. P., et al. 2006, ApJ, 642, 260 [NASA ADS] [CrossRef] [Google Scholar]
- Sasaki, M., Breitschwerdt, D., Baumgartner, V., & Haberl, F. 2011, A&A, 528, A136 [NASA ADS] [CrossRef] [EDP Sciences] [Google Scholar]
- Sault, R. J., & Wieringa, M. H. 1994, A&AS, 108, 585 [NASA ADS] [Google Scholar]
- Sault, R. J., Teuben, P. J., & Wright, M. C. H. 1995, in Astronomical Data Analysis Software and Systems IV, eds. R. A. Shaw, H. E. Payne, & J. J. E. Hayes, ASP Conf. Ser., 77, 433 [Google Scholar]
- Schaerer, D., Meynet, G., Maeder, A., & Schaller, G. 1993, A&AS, 98, 523 [NASA ADS] [Google Scholar]
- Seward, F. D., & Mitchell, M. 1981, ApJ, 243, 736 [NASA ADS] [CrossRef] [Google Scholar]
- Silich, S. A., Tenorio-Tagle, G., Terlevich, R., Terlevich, E., & Netzer, H. 2001, MNRAS, 324, 191 [NASA ADS] [CrossRef] [Google Scholar]
- Smith, D. A., & Wang, Q. D. 2004, ApJ, 611, 881 [NASA ADS] [CrossRef] [Google Scholar]
- Smith, R. C., Points, S. D., & Winkler, F. 2006, NOAO Newsletter, 85, 6 [Google Scholar]
- Smith, R. K., Brickhouse, N. S., Liedahl, D. A., & Raymond, J. C. 2001, ApJ, 556, L91 [NASA ADS] [CrossRef] [Google Scholar]
- Snowden, S. L., Collier, M. R., & Kuntz, K. D. 2004, ApJ, 610, 1182 [NASA ADS] [CrossRef] [Google Scholar]
- Snowden, S. L., Mushotzky, R. F., Kuntz, K. D., & Davis, D. S. 2008, A&A, 478, 615 [NASA ADS] [CrossRef] [EDP Sciences] [Google Scholar]
- Sturm, R., Haberl, F., Aschenbach, B., & Hasinger, G. 2010, A&A, 515, A5 [NASA ADS] [CrossRef] [EDP Sciences] [Google Scholar]
- Testor, G., Schild, H., & Lortet, M. C. 1993, A&A, 280, 426 [NASA ADS] [Google Scholar]
- Truelove, J. K., & McKee, C. F. 1999, ApJS, 120, 299 [NASA ADS] [CrossRef] [Google Scholar]
- Tüllmann, R., Long, K. S., Pannuti, T. G., et al. 2009, ApJ, 707, 1361 [NASA ADS] [CrossRef] [Google Scholar]
- Vink, J., Kaastra, J. S., & Bleeker, J. A. M. 1996, A&A, 307, L41 [NASA ADS] [Google Scholar]
- Warren, J. S., & Hughes, J. P. 2004, ApJ, 608, 261 [NASA ADS] [CrossRef] [Google Scholar]
- Weaver, R., McCray, R., Castor, J., Shapiro, P., & Moore, R. 1977, ApJ, 218, 377 [NASA ADS] [CrossRef] [Google Scholar]
- Weisskopf, M. C., O’dell, S. L., & van Speybroeck, L. P. 1996, in Multilayer and Grazing Incidence X-Ray/EUV Optics III, eds. R. B. Hoover, & A. B. Walker, SPIE Conf. Ser., 2805, 2 [Google Scholar]
- Wilms, J., Allen, A., & McCray, R. 2000, ApJ, 542, 914 [NASA ADS] [CrossRef] [Google Scholar]
- Wolk, S. J., Bourke, T. L., Smith, R. K., Spitzbart, B., & Alves, J. 2002, ApJ, 580, L161 [NASA ADS] [CrossRef] [Google Scholar]
- Yamaguchi, H., Bamba, A., & Koyama, K. 2009, PASJ, 61, 175 [NASA ADS] [Google Scholar]
- Yamaguchi, H., Sawada, M., & Bamba, A. 2010, ApJ, 715, 412 [NASA ADS] [CrossRef] [Google Scholar]
All Tables
All Figures
|
Fig. 1 Left: combined XMM-Newton EPIC image of 30 Dor C in false colour with red, green, and blue corresponding to 0.3–1 keV, 1–2 keV, and 2–7 keV. Also shown is the region to the north of 30 Dor C which highlights the highly variable background in the region. The image has been exposure-corrected in each energy band and have the QPB subtracted and binned into 2 × 2 pixel bins before being adaptively smoothed using the XMM-ESAS task adapt-2000. The position of Source 6, which is discussed as a possible compact object in Sect. 4.2.1, is also marked. Right: same as left but with the spectral analysis regions indicated. See Sect. 3.3.1 for a description of the regions. |
| In the text | |
|
Fig. 2 Northern (black) and southern (blue) radial profile of MCSNR J0536−6913 in the 1−2 keV band. |
| In the text | |
|
Fig. 3 Left: simultaneous spectral fits to the EPIC BG-W spectra. Right: same as left for BG-E. The green and red straight lines represent the residual SP contamination in Obs. ID 0113020201, in which only the EPIC-MOS1 and EPIC-MOS2 cameras were on. |
| In the text | |
|
Fig. 4 Left: simultaneous spectral fits to the EPIC A2 spectra. Right: EPIC-pn spectrum of A2 from Obs. ID 0601200101 (deepest EPIC-pn observation) with additive model components shown. The red dash-dot-dot-dot lines represent the AXB components, the magenta dash-dot line shows the instrumental fluorescence line, blue dotted lines mark the LMC ISM, and green dashed lines represent the source components (vapec+pow). Best fit parameters are given in Table 5. |
| In the text | |
|
Fig. 5 Left: simultaneous spectral fits to the EPIC spectra of MCSNR J0536−6913. Right: EPIC-pn spectrum of MCSNR J0536−6913 from Obs. ID 0601200101 with additive model components shown. The red dash-dot-dot-dot lines represent the AXB components, blue dotted lines mark the LMC ISM, and green dashed lines represent the contamination from 30 Dor C. The black solid line represents the swept-up ISM component and the ejecta emission in shown by the orange solid line. Best-fit parameters are given in Table 6. |
| In the text | |
|
Fig. 6 Radio-continuum spectral map of 30 Dor C between 36 cm and 20 cm. 20 cm contours have been superimposed at levels of 1, 3, and 5 mJy. The white circle in the southern shell shows the approximate extent of the SNR. The sidebar on the right quantifies the radio spectral index. |
| In the text | |
|
Fig. 7 20 cm magnetic-field vectors overlaid on 20 cm contours (1, 3, 5, 20, 50, and 100 mJy) of 30 Dor C from ATCA observations. The magenta annotation shows the approximate extent of the SNR. The ellipse in the lower left corner represents the synthesised beamwidth of 17.3″ × 15.2′′, and the line below the ellipse represents a polarisation vector of 100 per cent. |
| In the text | |
|
Fig. 8 MCELS [S ii]/Hα ratio image of 30 Dor C with 1−2 keV contours from Fig. 9-middle. The colour scale indicates the value of [S ii]/Hα. |
| In the text | |
|
Fig. 9 MCELS RGB ([S ii], Hα, [O iii]) image of 30 Dor C with 0.3−1 keV contours (left), 1−2 keV contours (middle), and 2−7 keV contours (right). The contour levels in each case were chosen arbitrarily to highlight X-ray features discussed in Sect. 3.3.1. It is clear from these images that the hard X-ray morphology is tightly correlated with the northern Hα shell. |
| In the text | |
|
Fig. 10 Abundance ratios of metals to O in the ejecta, relative to the corresponding solar ratios. MCSNR J0536−6913 data are in black. Theoretical yields for various progenitor masses determined from the Yields Table 2013 (see also Nomoto et al. 2013) are also included. Error bars are calculated from 90% confidence intervals of fit parameters. |
| In the text | |
|
Fig. 11 Combined 99+18 ks Chandra image of MCSNR J0536−6913. Red = 0.5−0.7 keV (strong O lines), green =0.7−1.1 keV (Ne lines), and blue = 1.1−2 keV (Mg and Si lines). The images are binned by a factor of 2 to improve count statistics and smoothed with a Gaussian kernel of 2″. The white dashed circle indicates the dimensions of the remnant determined in Sect. 3.1. |
| In the text | |
|
Fig. 12 Spectral energy distribution of synchrotron emission from shell B of 30 Dor C. The solid line shows the cut-off power law fit with the dotted line showing the extrapolation of the straight power law. The radio fluxes are at 36 cm and 20 cm, and are shown in the inset to reduce the axis scales of the plot. The X-ray data are the 1.5−7 keV range. |
| In the text | |
|
Fig. A.1 Left: simultaneous spectral fits to the EPIC spectra of B1. Right: EPIC-pn spectrum of MCSNR J0536−6913 from Obs. ID 0601200101 (deepest EPIC-pn observation) with additive model components shown. The red dash-dot-dot-dot lines represent the AXB components, the magenta dash-dot line shows the instrumental fluorescence line, blue dotted lines mark the LMC ISM, and green dashed lines represent the source components (source model = vapec+pow). Best-fit parameters are given in Table 5. |
| In the text | |
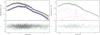 |
Fig. A.2 As in Fig. A.1 for B2 (source model = pow). Best-fit parameters are given in Table 5. |
| In the text | |
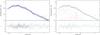 |
Fig. A.3 As in Fig. A.1 for B3 (source model = pow). Best-fit parameters are given in Table 5. |
| In the text | |
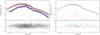 |
Fig. A.4 As in Fig. A.1 for C1 (source model = pow). Best-fit parameters are given in Table 5. |
| In the text | |
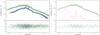 |
Fig. A.5 As in Fig. A.1 for C2 (source model = pow). Best-fit parameters are given in Table 5. |
| In the text | |
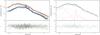 |
Fig. A.6 As in Fig. A.1 for D (source model = pow). Best-fit parameters are given in Table 5. |
| In the text | |
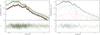 |
Fig. A.7 As in Fig. A.1 for I1 (source model = vapec+pow). Best-fit parameters are given in Table 5. |
| In the text | |
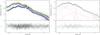 |
Fig. A.8 As in Fig. A.1 for I2 (source model = pow). Best-fit parameters are given in Table 5. |
| In the text | |
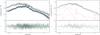 |
Fig. A.9 As in Fig. A.1 for I3 (source model = pow). Best-fit parameters are given in Table 5. |
| In the text | |
Current usage metrics show cumulative count of Article Views (full-text article views including HTML views, PDF and ePub downloads, according to the available data) and Abstracts Views on Vision4Press platform.
Data correspond to usage on the plateform after 2015. The current usage metrics is available 48-96 hours after online publication and is updated daily on week days.
Initial download of the metrics may take a while.