Fig. 1
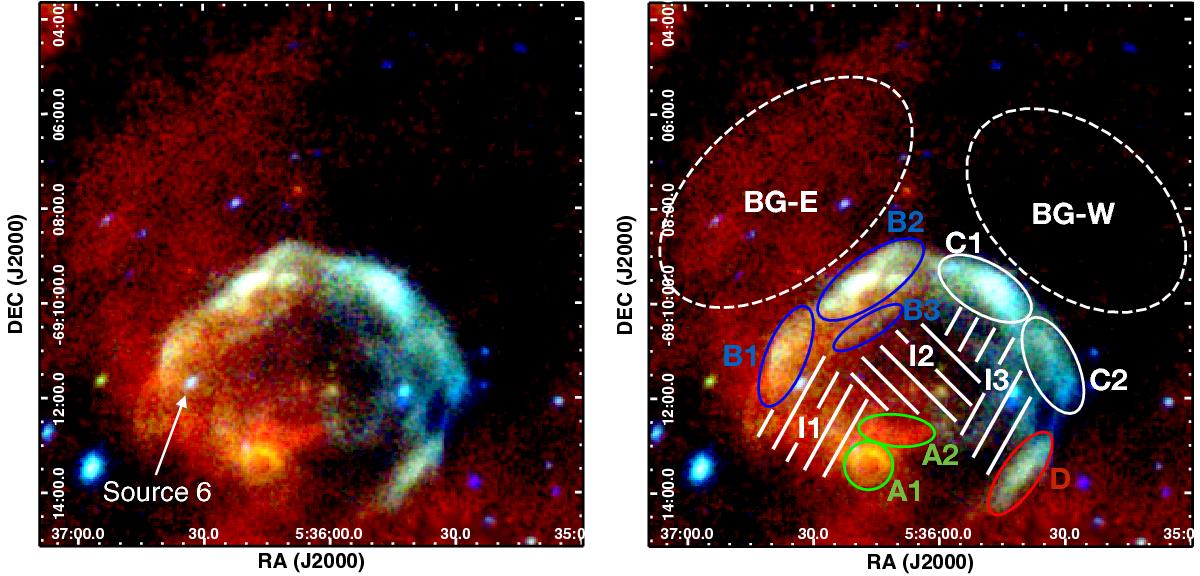
Left: combined XMM-Newton EPIC image of 30 Dor C in false colour with red, green, and blue corresponding to 0.3–1 keV, 1–2 keV, and 2–7 keV. Also shown is the region to the north of 30 Dor C which highlights the highly variable background in the region. The image has been exposure-corrected in each energy band and have the QPB subtracted and binned into 2 × 2 pixel bins before being adaptively smoothed using the XMM-ESAS task adapt-2000. The position of Source 6, which is discussed as a possible compact object in Sect. 4.2.1, is also marked. Right: same as left but with the spectral analysis regions indicated. See Sect. 3.3.1 for a description of the regions.
Current usage metrics show cumulative count of Article Views (full-text article views including HTML views, PDF and ePub downloads, according to the available data) and Abstracts Views on Vision4Press platform.
Data correspond to usage on the plateform after 2015. The current usage metrics is available 48-96 hours after online publication and is updated daily on week days.
Initial download of the metrics may take a while.