Fig. 5
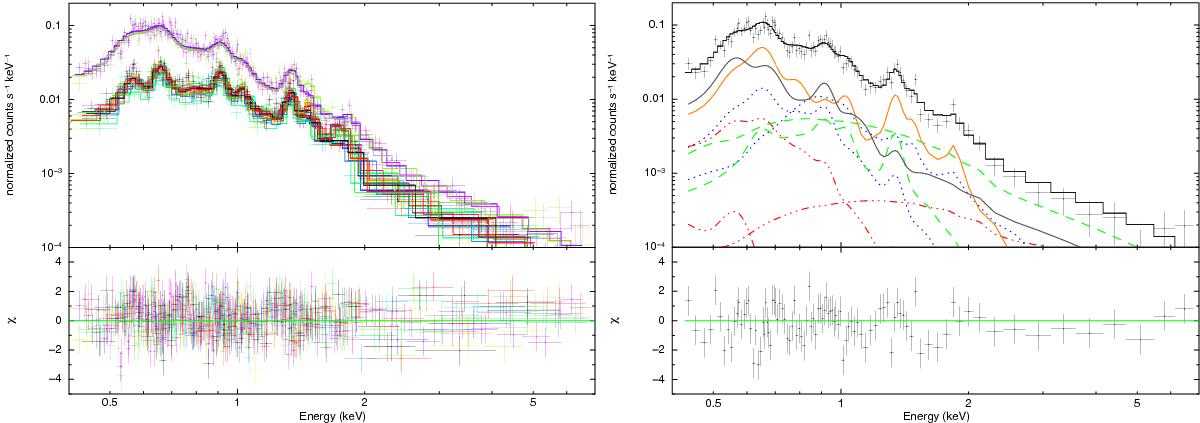
Left: simultaneous spectral fits to the EPIC spectra of MCSNR J0536−6913. Right: EPIC-pn spectrum of MCSNR J0536−6913 from Obs. ID 0601200101 with additive model components shown. The red dash-dot-dot-dot lines represent the AXB components, blue dotted lines mark the LMC ISM, and green dashed lines represent the contamination from 30 Dor C. The black solid line represents the swept-up ISM component and the ejecta emission in shown by the orange solid line. Best-fit parameters are given in Table 6.
Current usage metrics show cumulative count of Article Views (full-text article views including HTML views, PDF and ePub downloads, according to the available data) and Abstracts Views on Vision4Press platform.
Data correspond to usage on the plateform after 2015. The current usage metrics is available 48-96 hours after online publication and is updated daily on week days.
Initial download of the metrics may take a while.