Fig. 12
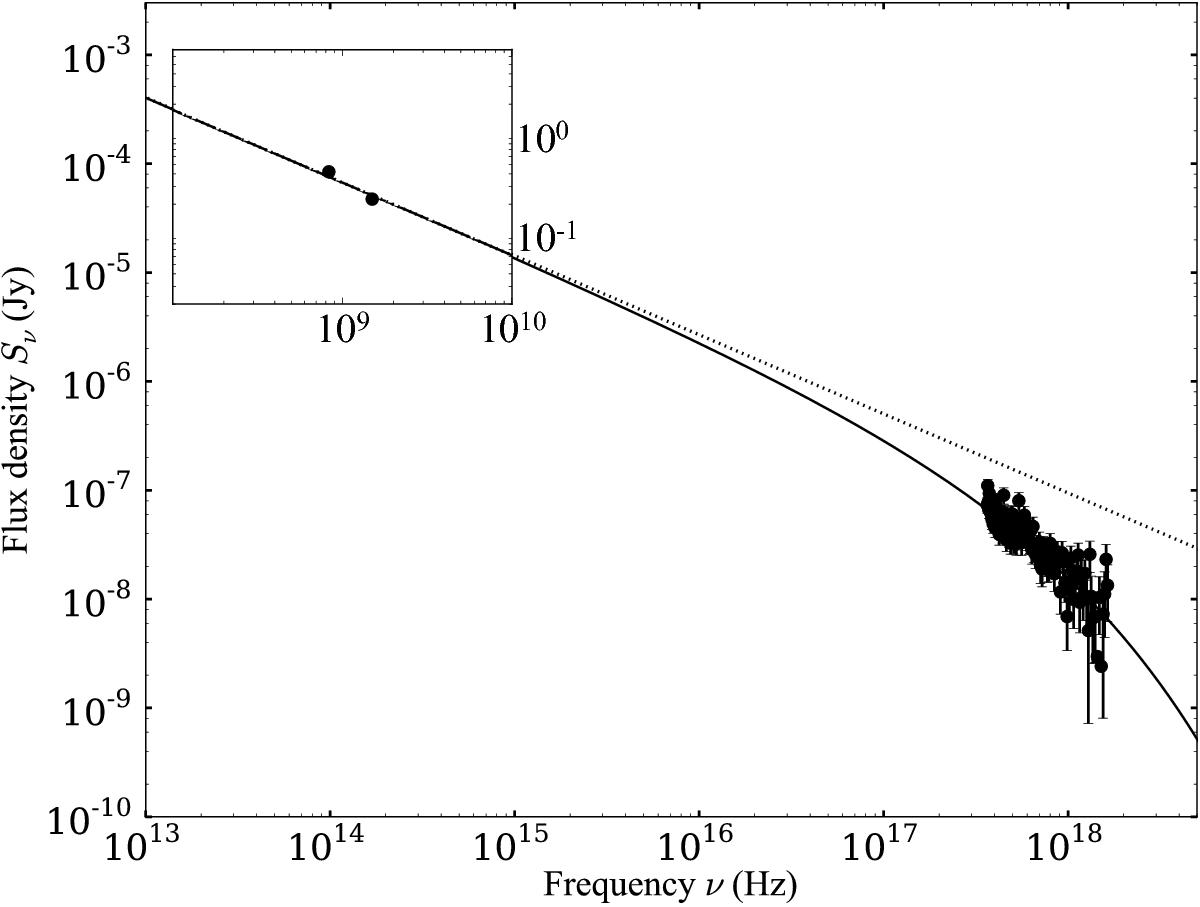
Spectral energy distribution of synchrotron emission from shell B of 30 Dor C. The solid line shows the cut-off power law fit with the dotted line showing the extrapolation of the straight power law. The radio fluxes are at 36 cm and 20 cm, and are shown in the inset to reduce the axis scales of the plot. The X-ray data are the 1.5−7 keV range.
Current usage metrics show cumulative count of Article Views (full-text article views including HTML views, PDF and ePub downloads, according to the available data) and Abstracts Views on Vision4Press platform.
Data correspond to usage on the plateform after 2015. The current usage metrics is available 48-96 hours after online publication and is updated daily on week days.
Initial download of the metrics may take a while.