Fig. 9
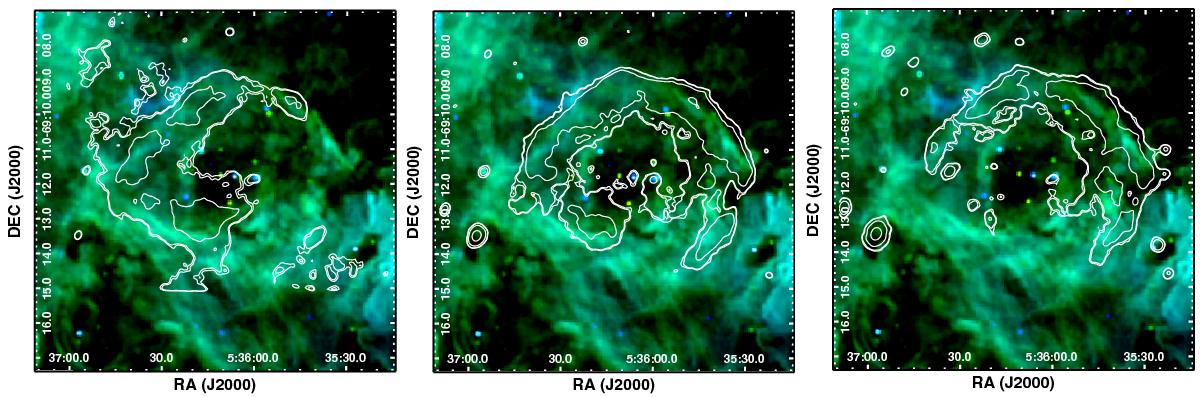
MCELS RGB ([S ii], Hα, [O iii]) image of 30 Dor C with 0.3−1 keV contours (left), 1−2 keV contours (middle), and 2−7 keV contours (right). The contour levels in each case were chosen arbitrarily to highlight X-ray features discussed in Sect. 3.3.1. It is clear from these images that the hard X-ray morphology is tightly correlated with the northern Hα shell.
Current usage metrics show cumulative count of Article Views (full-text article views including HTML views, PDF and ePub downloads, according to the available data) and Abstracts Views on Vision4Press platform.
Data correspond to usage on the plateform after 2015. The current usage metrics is available 48-96 hours after online publication and is updated daily on week days.
Initial download of the metrics may take a while.