| Issue |
A&A
Volume 572, December 2014
|
|
|---|---|---|
| Article Number | A107 | |
| Number of page(s) | 12 | |
| Section | Planets and planetary systems | |
| DOI | https://doi.org/10.1051/0004-6361/201424343 | |
| Published online | 04 December 2014 | |
Forming the cores of giant planets from the radial pebble flux in protoplanetary discs
Lund ObservatoryDepartment of Astronomy and Theoretical Physics, Lund
University,
Box 43,
22100
Lund,
Sweden
e-mail:
This email address is being protected from spambots. You need JavaScript enabled to view it.
Received: 5 June 2014
Accepted: 26 September 2014
Abstract
The formation of planetary cores must proceed rapidly in order for the giant planets to accrete their gaseous envelopes before the dissipation of the protoplanetary gas disc (≲3 Myr). In orbits beyond 10 AU, direct accumulation of planetesimals by the cores is too slow. Fragments of planetesimals could be accreted faster, but planetesimals are likely too large for fragmentation to be efficient, and resonant trapping poses an additional hurdle. Here we instead investigate the accretion of small pebbles (mm-cm sizes) that are the natural outcome of an equilibrium between the growth and radial drift of particles. We construct a simplified analytical model of dust coagulation and pebble drift in the outer disc, between 5 AU and 100 AU, which gives the temporal evolution of the solid surface density and the dominant particle size. These two key quantities determine how core growth proceeds at various orbital distances. We find that pebble surface densities are sufficiently high to achieve the inside-out formation of planetary cores within the disc lifetime. The overall efficiency by which dust gets converted to planets can be high, close to 50% for planetary architectures similar to the solar system. Growth by pebble accretion in the outer disc is sufficiently fast to overcome catastrophic type I migration of the cores. These results require protoplanetary discs with large radial extent (≳100 AU) and assume a low number of initial seed embryos. Our findings imply that protoplanetary discs with low disc masses, as expected around low-mass stars (<1 M⊙), or with sub-solar dust-to-gas ratios, do not easily form gas-giant planets (M ≳ 100 ME), but preferentially form Neptune-mass planets or smaller (M ≲ 10 ME). This is consistent with exoplanet surveys which show that gas giants are relatively uncommon around stars of low mass or low metallicity.
Key words: planets and satellites: formation / planets and satellites: gaseous planets / planets and satellites: composition / planets and satellites: interiors / protoplanetary disks
© ESO, 2014
1. Introduction
The giant planets in our solar system have a large fraction of heavy elements in their interiors (Guillot 2005). Models of giant exoplanets in short orbits show similar core masses, on the order of 10 Earth masses (ME) or larger (Guillot et al. 2006; Miller & Fortney 2011; Moutou et al. 2013). In the core accretion scenario, the formation of these cores is the critical first step in a process of attracting a gaseous envelope (Pollack et al. 1996).
However, core formation faces two hurdles. Firstly, growth by pairwise collisions comes to a halt when particles reach radii between mm and cm. Gas drag on these pebbles leads to a rapid radial migration on time scales of 100−1000 yr (Weidenschilling 1977). This prevents continued particle growth by coagulation (Brauer et al. 2008), except possibly in the inner disc with large particle seeding (Windmark et al. 2012) or porous dust aggregates (Kataoka et al. 2013). Therefore the migration of solids leads to a decrease in the solid surface in the outer disc and stops particle growth beyond pebble-size.
Secondly, even if solids would overcome the radial drift barrier and reach sizes larger than kilometer (“planetesimals”), collisional growth towards core-sizes remains too slow. Observationally, gas discs are estimated to survive only for a few Myr (Haisch et al. 2001; Kraus et al. 2012). Models which assume that core growth occurs by the accretion of planetesimals larger than km in size (Pollack et al. 1996; Kobayashi et al. 2011) cannot form the cores of the giant planets at distances of ~5 AU or larger within this time scale, without evoking significantly enhanced solid surface densities compared to the minimum mass solar nebula (MMSN, Hayashi 1981). Destruction of large planetesimals into smaller fragments can speed up core growth (Rafikov 2004; Ormel & Klahr 2010). However, in order to collide sufficiently frequently planetesimals have to be small (~1 km, Chambers 2014), below current estimates (~100 km, Morbidelli et al. 2009), and global disc simulations show that growth is hampered by trapping large fragments in resonances (Levison et al. 2010).
These two issues – the loss of solids by pebble drift and slow planetesimal accretion – can be overcome by considering the accretion of pebbles onto larger planetesimals and cores. Firstly, numerical simulations find very high accretion rates, which allows core formation well within disc lifetimes (Lambrechts & Johansen 2012). This is due to gas drag operating on pebbles that enter the gravitational reach of a core, resulting in kinetic energy dissipation and accretion (Johansen & Lacerda 2010; Ormel & Klahr 2010). Larger planetesimals would need much closer encounters to be gravitationally focussed onto the core. Secondly, a large fraction of drifting pebbles can be accreted by the growing cores (Morbidelli & Nesvorny 2012), therefore avoiding the loss of pebbles to sublimation at evaporation fronts interior to the giant planet formation zone.
The evolution of the solid surface density and the dominant pebble size on the scale of the protoplanetary disc are critical parameters in determining core growth rates and accretion efficiencies. The aim of this paper is to explore pebble accretion in global models of particle growth and pebble drift. We introduce a simplified model of dust growth that relies on separating the population of stationary dust grains from larger drifting pebbles (Sect. 2). We verify that this model is in agreement with more detailed numerical coagulation codes and observational constraints. The growth of planetary cores is subsequently explored at various orbital distances, based on parametrized pebble accretion rates from hydrodynamical simulations (Sect. 3). In this regime of fast pebble accretion, we find that type I migration does not lead cores into the star, a result which validates our approximation of in situ growth (Sect. 4). Planetary architectures like our solar system can form efficiently in an inside-out fashion, under standardly assumed gas column densities and dust-to-gas ratios. However, variations in these parameters can radically change the mass of the planets that form in these systems (Sect. 5). Finally, we conclude the paper with highlighting some areas for future exploration (Sect. 6) and a brief summary of our results (Sect. 7).
2. The evolution of the solid surface density
2.1. The protoplanetary disc
We start by setting up a model for the gas component of the protoplanetary disc. Although complex prescriptions can in principle be included in our model, we choose a simple prescription of the gas surface density as  (1)where we can either choose β = β0 a fixed normalisation constant or β = β0exp(−t/τdis) in order to mimic gas dissipation, as done for example by McNeil et al. (2005) and Walsh et al. (2011). This radial power law profile is expected from the viscous evolution of an accretion disc (Lynden-Bell & Pringle 1974) and supported by the observed disc profile of the nearby protoplanetary disc around the star TW Hya (Andrews et al. 2012). For simplicity we will use here τdis = 3 Myr (Haisch et al. 2001), but disc lifetimes could be even shorter for stars above a solar mass (Hernández et al. 2005).
The thermal profile of the disc (T,cs,H/r) follows the standard MMSN values, which should be fairly accurate in the outer parts of the disc where viscous heating is negligible (Bitsch et al. 2013, 2014), and we will find that our results only depend weakly on these choices.
2.2. Dust growth
We employ a simple, but robust, model for particle growth which takes into account the vertical settling of particles in the disc, inspired by the approach by Garaud (2007) and Birnstiel et al. (2012). The growth rate of a particle can be expressed as  (2)when a particle of size R and material density ρ• sweeps up particles of sizes smaller than R in a midplane layer of particle density ρ0,d. The relative velocity, Δvt, between particles is driven by the turbulent gas motions. In the so-called intermediate regime (Ormel & Cuzzi 2007), the collision velocities are parametrized by
  (3)with cs the sound speed, αt the turbulent viscosity parameter and τf the Stokes number (the product of the friction time of the particle and the Keplerian frequency ΩK). Since the vertical scale height of particles depends on the strength of the turbulence in the disc through
  (4)(Youdin & Lithwick 2007), the growth rate becomes independent of αt,
  (5)(Brauer et al. 2008). Here Z is the local ratio of the dust and gas column densities and ρ0 is the midplane gas density. The Stokes number τf is connected to the particle size via
  (6)Here we have assumed the Epstein drag regime, which is generally valid in the giant planet formation zone where the gas mean free path is larger than pebble sizes. Therefore the growth time scale does not depend on the internal density (porosity) of the particles,
  (7)Here we have introduced ϵg, a parameter that can be used to modify the growth efficiency between particles.
In our calculation we have ignored growth driven by Brownian motion and radial and azimuthal differential drift, which are small contributions in turbulent discs (Brauer et al. 2008). Our analysis also assumes that the sticking coefficient ϵg is independent of particle size. This is certainly not the case, especially for larger particles, for which relative velocities become large. However for small dust grains, perfect sticking is a relatively good approximation. For larger mm-sized particles, collision outcomes predominantly lead to fragmentation (Blum & Wurm 2008), but collision outcomes between icy particles are not well known. With the help of the free parameter ϵg we can explore the coagulation efficiency.
2.3. Dust mass flux
The outer parts of the protoplanetary discs act as reservoir of solid particles (Youdin & Shu 2002; Garaud 2007). At wide orbits small stationary dust slowly grows into inwards-drifting pebbles, which in turn drive pebble accretion in the zone where the giant planets form. At an orbital radius r, the characteristic time scale tg,d for dust to grow is given by Eq. (7), with Z taken to be the initial dust-to-gas ratio Z0 and ϵg taken to be the dust sticking efficiency ϵg,d. We choose a standard dust-to-gas ratio of Z0 = 0.01 (Draine et al. 2007), unless mentioned otherwise. For the sticking efficiency we take ϵg,d = 0.5, which produces results consistent with more advanced coagulation codes (Birnstiel et al. 2012). The particle-growth time scale is independent of particle size (Eq. (7)). However, the actual time used to grow from ISM-like dust with radius R0 to the size at which pebbles start drifting Rdrift is given by  (8)with a weak logarithmic dependence on the size ratio Rdrift/R0. The size of Rdrift is not known a priori, but we find that Rdrift ≈ 1−10 mm is a characteristic size and consistent with observations. ISM grains are predominantly about 0.1−1 μm in size (Weingartner & Draine 2001), which would result in ξ ≈ 10. For simplicity, we now write
  (9)with ϵd = ϵg,dξ-1 encapsulating the two particle growth parameters.
After a time Δt of exponential growth, a particle will reach a size where the growth rate and drift rate become comparable, and the pebble starts drifting towards the star. We can now find, for a certain time t, where in the disc particles have just grown to pebble sizes (by setting t = Δt in Eq. (9)),  (10)Here G is the gravitational constant and M∗ the stellar mass. This expression has previously been found to be in good agreement with more detailed numerical coagulation models (Garaud 2007). The pebble production line, rg(t), moves outwards and sweeps up a pebble mass flux
  (11)Here, the derivative drg/ dt denotes the speed at which the pebble front expands radially,
  (12)When we assume that the initial dust surface density is a constant fraction of the gas surface density,
  (13)the radial pebble flux through the protoplanetary disc can be expressed as
  (14)showing only a weak time dependence. Here M⊙ is the solar mass. Although, as expected, the radial pebble flux depends on the initial dust-to-gas ratio and the coagulation efficiency, this expression only depends on the disc structure through the gas surface density, but not on the temperature.
2.4. Evolution of the solid surface density
Once the pebble mass flux is set by the production of pebbles in the outer disc, we can calculate the surface density interior to rg. From the continuity requirement, we find  (15)where Σp(r) is the pebble surface density interior to this outer reservoir. In this expression, the particle velocity vr depends on the pebble size, which is also a function of Σp. The particle size can be estimated from balancing the growth time scale with the drift timescale. Following Eq. (7), we find the growth time scale for drifting pebbles to be
  (16)with ϵp the coagulation efficiency between pebbles (we will assume ϵp = 0.5, similar to the dust coagulation efficiency ϵg,d).
Particles drift radially inwards with a velocity  (17)(Weidenschilling 1977; Nakagawa et al. 1986), where vK is the Keplerian velocity at orbital radius r and η is a dimensionless measure of radial gas pressure support,
  (18)The turbulent motion of the pebbles in the radial direction can be safely ignored for the purpose of determining the bulk radial drift1. In the limit of a particle with τf ≲ 1, we then find a radial drift time scale
  (19)We now obtain, by setting tg,p = tr, the dominant particle size of
  (20)(Brauer et al. 2008; Birnstiel et al. 2012). Equivalently, the above expression for the size of pebbles can also be found by combining Eqs. (5) and (17), resulting in
  (21)After integration we find
 ![Mathematical equation: \begin{eqnarray} \tau_{\rm f} =- \frac{\sqrt{3} \epsilon_{\rm p}}{8} \frac{\xi_0}{\beta_0 \eta_0} \frac{1}{\psi+1/2} \left[ \left( \frac{r}{\rm AU} \right)^{\psi+1/2} \right]^{r/{\rm AU}}_{r_0/{\rm AU}} +\tau_{\rm f,0} , \label{eq:full_deriv2} \end{eqnarray}](/articles/aa/full_html/2014/12/aa24343-14/aa24343-14-eq79.png) (22)where we have assumed the pebble surface density can be described as a power law function of the form Σp = ξ0(r/ AU)ψ, with ψ< −1/2 (which we verify later to be valid). Similarly, we used η = η0(r/ AU)1/2. The particles are of size τf,0 at initial location r0, but at r ≪ r0 their size is approximately given by
(22)where we have assumed the pebble surface density can be described as a power law function of the form Σp = ξ0(r/ AU)ψ, with ψ< −1/2 (which we verify later to be valid). Similarly, we used η = η0(r/ AU)1/2. The particles are of size τf,0 at initial location r0, but at r ≪ r0 their size is approximately given by  (23)comparable to Eq. (20).
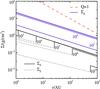 |
Fig. 1 Solid surface density as function of orbital distance (black), at different times (indicated by the labels representing the time in years). The solid black lines represent the dust surface density and the dotted lines the pebble surface density. The exponentially decaying gas surface density is represented in blue, for the same times as the solid surface density. We have here assumed a gas disc dissipation time scale of τdis = 3 Myr. Gas surface densities larger than the red dashed line (which represent Toomre Q = 1), would be gravitationally unstable (see also Sect. 2.6). |
Therefore, knowing the pebble size, we can rewrite Eq. (15) as  (24)Notice that the pebble surface density no longer depends on the pressure profile and gas disc scale height through η. The same expression is found in Birnstiel et al. (2012), although we can here combine it with our analytical expression for the pebble flux Ṁℱ from Eq. (14). In this way we obtain the temporal and radial dependency of the pebble column densities,
  (25)which is valid in the region r<rg. The value of the pebble surface density should be quite robust, as it does not depend on the temperature structure of the disc through H/r. Also, there is only a weak dependency on the coagulation efficiency through the ratio
  .
.
Figure 1 illustrates the gas and solid surface densities as function of orbital radius and time. While the dust surface density inherits the radial profile of the gas surface density (Σd ∝ r-1), the slope of the pebble surface density falls off as r− 3/4. In principle, one could interpolate between the two regimes, but an instantaneous transition is sufficient for our purposes. Similarly, we have not included an exponential edge to the disc here, but this mainly affects the disc beyond ≈100 AU (Birnstiel et al. 2012).
The power law profile for the pebble column density is based here on a simplified model for pebble formation and is very different compared to often used MMSN estimates, which yield Σp = 0.5(r/ 10 AU)-1.5 g cm-2. However, advanced coagulation codes modelling compact particle growth yield very similar results as the analytic calculation (Brauer et al. 2008; Birnstiel et al. 2012; Okuzumi et al. 2012). In particular, Fig. 3 of Okuzumi et al. (2012) is quantitatively similar to our Fig. 1 (but note that the authors used a gas profile Σg ∝ r− 3/2 as in the MMSN, which results in Σp ∝ r-1). Intriguingly, a radial slope of −3/4 in the pebble surface density has been inferred for the outer regions of the protoplanetary disc around TW Hydra (Andrews et al. 2012; Birnstiel et al. 2012; Menu et al. 2014).
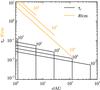 |
Fig. 2 Dominant particle size, as function of orbital distance and time. Black lines represent the particle size expressed by the Stokes number, the dimensionless friction time of the particle (labels correspond to the disc age in yr). Yellow lines give the particle size in cm assuming the Epstein regime (103 and 107 yr omitted for clarity). Particle sizes decrease at wider orbits and at later times, but typically remain in the mm-cm regime in the giant planet formation zone (5−50 AU). Pebbles are spread to the orbital location where dust is still growing to pebble sizes rg. Beyond this orbit most of the solid mass will be in smaller dust particles. The disc dissipation time scale was set to τdis = 3 Myr. |
2.5. Dominant pebble size
Figure 2 shows the dominant pebble size as function of semi-major axis and time, based on Eqs. (20) and (25). The pebble size is about τf ≈ 0.02–0.04 around t = 1 Myr, in good agreement with results from advanced coagulation codes (Brauer et al. 2008; Birnstiel et al. 2012). Such particle sizes, between 1 cm at 5 AU and 1 mm at 30 AU are in agreement with observations of the spectral slope of the dust emission from protoplanetary discs at mm to cm wavelengths. A large fraction of young discs contain a significant dust mass fraction in solids of mm sizes which remain present over the lifetime of discs (Draine 2006; Natta et al. 2007; Ricci et al. 2010; Ubach et al. 2012). In particular, observations in cm wavelengths of the nearby young star TW Hya2 have revealed that as much as ~10-3M⊙ of the solid mass is present in cm-sized pebbles (Wilner et al. 2005), while simultaneously containing ≳0.05 M⊙ in gas (Bergin et al. 2013). Other examples are WW Cha and GG Tau A (ages ~0.5 and ~1.5 Myr), which have very similar pebble discs, with dust mass Md ~ 10-3M⊙ and outer radii r0 ≈ 250 AU (Lommen et al. 2009; Scaife 2013).
As illustrated in Fig. 2, the sizes of the pebbles are smaller in wider orbits. Hints of a decrease in pebble size from cm in the inner disc to sub-mm in the outer disc (≳75 AU) have also been seen in the protoplanetary disc of AS 209 (Pérez et al. 2012), CQ Tauri (Trotta et al. 2013) and TW Hydra (Menu et al. 2014). The sharp cut-off in the particle size at the pebble production line in Fig. 2 is an artefact of our model. In reality a smooth connection exists between the pebbles and growing dust in wider orbits.
2.6. Radial extent of the dust disc
It is well established that discs need a large radial extent (≳100 AU) to explain mm-observations (Brauer et al. 2008), which do not indicate any depletion of the dust mass before gas dissipation (Ricci et al. 2010). The need for a large disc to act as a mass reservoir can also be seen in Fig. 1, where the pebble formation edge rg moves out in time. Such large radii are not inconsistent with those inferred from protoplanetary discs (Isella et al. 2009; Williams & Cieza 2011) and debris discs (Wyatt 2008). CO observations tracing the gas component of the disc suggest a mean outer disc radii larger than ro ≈ 210 AU, for stars with ages ≲7 Myr, nearly independent of the stellar spectral type (Dent et al. 2005). Similarly, sub-mm/mm surveys find outer radii of ~100 AU, with some protoplanetary discs much larger (Kitamura et al. 2002; Mohanty et al. 2013). Protoplanetary discs are expected to have a large radial extent at late times, because of the viscous expansion of the disc (Lynden-Bell & Pringle 1974). The outer edge is typically characterized by a sharp exponential cut-off. However, this solution is unreliable as it in fact violates the assumption of a disc where the radial pressure gradient can be ignored compared to the central gravity of the star, which is required for these self-similar solutions (Ono et al. 2014).
We have verified that our large disc models do not become gravitationally unstable anywhere in the disc (Toomre 1964), see for example Fig. 1 where we plot the line of Q = 1, above which a disc would become gravitationally unstable. The parameter Q is defined as Q ≈ csΩK/ (πGΣ).
2.7. Model assumptions
The calculation of this model for the equilibrium pebble surface density and dominant particle size relies on two important assumptions. Firstly, particles remain small with τ ≲ 1 and in the Epstein regime, in both the dust growth and pebble drift regimes. Secondly, the pebble disc is in equilibrium between growth and drift (as in Eq. (15)). Therefore the time scale on which the radial pebble flux changes, τℱ = rg/ṙg = (3/2)t, must be larger than the pebble-drift time scale (tr, Eq. (19)) at r ≤ rg. This criterion is satisfied for the parameters we have chosen. If, on the other hand, the pebble coagulation efficiency would be very small, ϵp → 0, these small and slow pebbles would lead to unphysical results such as the pebble surface density obtaining a higher value then the original dust density.
Additionally, we have made the approximation that the growth of pebbles occurs dominantly by collisions with other pebbles, as opposed to dust, in the region with r<rg (Eq. (16)). The ratio of pebble growth by collisions with pebbles relative to collisions with unsedimented dust is equal to the ratio of pebble and dust midplane densities, 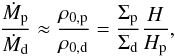 (26)because the collision speed between two pebbles is comparable to the collision speed between a pebble and a small dust grain (Weidenschilling 1984). For particles of size τf = 0.1 and turbulence strength αt = 10-3, we find H/Hp ~ 10 (Eq. (4)). Therefore the contribution of dust can be safely ignored, especially since we assume that at orbital radii where r<rg dust is efficiently turned into pebbles (Σp ≫ Σd). The assumption that sweep-up of dust is negligible might break down in a strongly turbulent outer disc where small pebbles are prevented from settling to the midplane and large amounts of dust are produced in catastrophic collisions.
Our calculation is valid for the smooth power law disc models that are typically used. It does however not include the possible presence of “pressure bumps”, regions where locally η ≲ 0. In such areas, the particle surface density cannot be described by a globally smooth profile and the particle size estimate of Eq. (23) no longer holds.
Finally, one could think that our results are sensitive to the porosity of the icy particles. However, as demonstrated by Okuzumi et al. (2012), in the Epstein regime (valid in the giant planet formation zone) the growth time scale is independent of the solid density of the particles (Eq. (7)).
3. Core growth
3.1. Accretion rate
The presence of pebbles in the outer disc will drive the rapid growth of the cores of the giant planets. In the previous section we outlined how particles grow by coagulation to pebble sizes and start drifting inwards. Subsequently, pebbles are rapidly accreted by large planetesimals, provided that the planetesimal mass is above the transition mass, 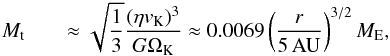 (27)which depends cubicly on the uncertain value of η(r) (Lambrechts & Johansen 2012). Here, we adopted the value given in Eq. (18).
In this paper, we assume that these core seed masses have already formed, but leave their formation and expected number for future work. These initial cores could be the result of streaming instabilities in the coupled motion between pebbles and gas, leading to the formation of planetesimals of about ~0.1 Mt (Johansen et al. 2012), aided by continued growth by pebble accretion in the so-called drift branch (Lambrechts & Johansen 2012). Interestingly, there is a lack of bodies larger than Mt in the solar system, which is encouraging because in our model such planetesimals would have grown to planetary sizes.
Given the surface densities of pebbles and their sizes, we use the numerical results from Lambrechts & Johansen (2012) to find the core accretion rates. A core accretes pebbles with Stokes numbers τf< 0.1 at a rate of 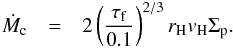 (28)This corresponds to the cores accreting all pebbles with τf ≈ 0.1 that enter the Hill sphere, with radius
  (29)at a velocity vH = ΩKrH. This is the result of gas drag on the pebble operating on a time scale similar to the crossing time of the particle past the core (≈
 ). Therefore, gas drag on a particle entering the Hill sphere slows it down, leading to accretion by the core. Smaller particles are more tightly coupled to the gas, so the accretion radius diminishes, leading to the size-dependent factor in the accretion rate in Eq. (28). Finally, we have here implicitly made the assumption that the particle scale height is comparable to or smaller than the Hill radius, which is satisfied for standard turbulent strengths. For example, the particle scale height is about Hp/H ≈ 0.1, for αt = 10-3 and τf = 0.1 (Eq. (4)). This is comparable to the Hill radius for a core of 0.1 ME,
  (30)assuming H/r = 0.06 (r/ 10 AU)1/4. Therefore, only in the short time between the masses Mt and 0.1 ME will the accretion rates be somewhat reduced by not accreting from the full particle layer. Furthermore, low viscosity regions, as found in dead zone models and disc wind models (Turner et al. 2014), could severely reduce the particle scale height.
We can make use of our disc model to express the pebble accretion rate as  (31)by inserting Eqs. (20) and (25) into Eq. (28). The growth rates of the cores are thus only weakly dependent on time and orbital distance. This is encouraging because Uranus and Neptune have very similar core masses, respectively Mc,U ≈ 13 ME and Mc,N ≈ 15 ME (Helled et al. 2011).
Only a fraction f of the pebbles that drift past the core are accreted (Morbidelli & Nesvorny 2012; Ormel & Kobayashi 2012; Guillot et al. 2014). We can express this fraction as the ratio of the accreted pebbles over the rate at which pebbles drift radially through the disc  (32)By combining Eqs. (15) and (28), we find
  (33)The ratio of accreted to drifting pebbles depends only weakly on the pebble surface density through the dominant particle size τf. However, the filtering factor is a strong function of the embryo mass. For low core masses, f is very small, and cores only take up a negligible fraction of the total pebble flux through the disc. Larger cores accrete more pebbles, but f remains smaller than unity up to critical/final cores masses are reached. We discuss the filtering factor in systems with multiple cores in Sect. 5.
3.2. Critical core mass
The embryo accretes pebbles and grows in mass, which leads to the attraction of a gaseous envelope around the core. This atmosphere becomes more massive over time, but remains pressure supported by the heat deposited from accreted solid material. However, for a given accretion rate there exist a point where the atmosphere is no longer hydrostatically stable, triggering rapid gas accretion (Mizuno 1980). The mass of the embryo at this point is standardly identified as the critical core mass, which is typically of the order of 10 ME.
In an accompanying paper (Lambrechts et al. 2014), we numerically determine the critical core mass for the pebble accretion model. At face value, the high pebble accretion rates (Eq. (31)), lead to critical core masses on the order of 100 ME. However, there exists a pebble isolation mass, a mass where the core perturbs the gas disc and halts pebble accretion abruptly (Morbidelli & Nesvorny 2012). Consequently, after pebble isolation, the core is super-critical. The envelope is no longer supported by accretional heat, the thermal balance is broken and gas is accreted at a high rate. The pebble isolation mass is the result of the gravity of the core locally perturbing the gas density, in a process similar to gap formation. In these pressure bumps, locally the pressure gradient, and thus η, becomes zero, stopping the drift of pebbles (Eq. (19)). The mass necessary to cause this perturbation and halt the accretion of pebbles by a core is  (34)as determined from hydrodynamical simulations (Lambrechts et al. 2014). Thus, when Miso is reached we also reach the critical core mass. If planets do not grow past this mass, M<Miso, this typically indicates that the planet does not become critical, leading to the formation of an ice giant planet (a planet with a gaseous envelope much less massive than the core). An exception to this are planets in very wide orbits (≳50 AU), where the critical core mass can be reached before pebble isolation (see Sect. 5.4.3, Fig. 9).
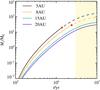 |
Fig. 3 Core growth as function of time. The different orbital separations (5−8−15−20 AU) resemble the compact orbital configuration expected after disc dissipation (Tsiganis et al. 2005). The red points identify the critical mass where a phase of rapid gas accretion is triggered necessary for the formation of gas giants (Lambrechts et al. 2014). Core growth comes to a halt after reaching the critical core mass. The dashed lines represent an extrapolation ignoring this halt in accretion. The yellow shaded area marks the dissipation of the gas disc after τdis = 3 Myr. |
3.3. Core growth
The mass of the core depends weakly on the orbital distance, but strongly on the metallicity and surface density. Given the pebble accretion rates, we can find the mass of the core as function of time. Integration of Eq. (31) yields ![Mathematical equation: \begin{eqnarray} M_{\rm c}(t) &=& \left( c r^{-5/12} \left[ t^{13/18} \right]^{t}_{t_{\rm i}} +M_{\rm c, 0}^{1/3} \right)^{3} \nonumber\\ & &\approx 11 \left( \frac{Z_0}{0.01} \right)^{25/6} \left( \frac{M_*}{ {M}_\odot} \right)^{-11/12} \left( \frac{\beta_0}{500\,{\rm g\,cm}^{-2}} \right)^{3} \nonumber \\ &&\times \left( \frac{r}{10\,{\rm AU}} \right)^{-5/4} \left( \frac{t}{10^6\,{\rm yr}} \right)^{13/6} \,{ {M}_{\rm E},} \label{eq:Mt_small} \end{eqnarray}](/articles/aa/full_html/2014/12/aa24343-14/aa24343-14-eq159.png) (35)where c is the product of the mass, time and orbital radius independent terms and ti the time when the seed core of mass Mc,0 is introduced in the disc. Here we have assumed a surface density which does not evolve in time3. The second line of Eq. (35) is a valid approximation in the limit where the core is much larger than the initial seed mass Mc(t) ≫ Mc,0, at a time later than t ≫ ti in a disc with constant surface density.
(35)where c is the product of the mass, time and orbital radius independent terms and ti the time when the seed core of mass Mc,0 is introduced in the disc. Here we have assumed a surface density which does not evolve in time3. The second line of Eq. (35) is a valid approximation in the limit where the core is much larger than the initial seed mass Mc(t) ≫ Mc,0, at a time later than t ≫ ti in a disc with constant surface density.
Figure 3 illustrates how the growth of the core depends little on the separation from the host star. The initial embryo masses were taken to be 10-3ME and inserted at a time ti = 105 yr. Embryo growth depends little on these assumptions4, as can be seen in Eq. (35). The model parameters are the metallicity Z = 0.01 and the initial gas surface density of 500 g cm-2 at 1 AU. Planets within approximately 10 AU reach the critical core mass and trigger rapid gas accretion (the red dot marks the pebble isolation mass), while planets at wider orbits, which do not reach Miso, are stranded as ice giants.
Core growth is highly sensitive to the metallicity, as can be seen from Eq. (35). Figure 4 shows the difference between an initial dust-to-gas ratio of Z = 0.005 and Z = 0.02 (while keeping other parameters fixed). The evolution of the core mass is similarly sensitive to the choice of the (initial) gas surface density. Figure 5 illustrates the growth of planetary cores for a gas surface density half and double that of our standard choice (β0 = 500 g cm-2), both for the cases with exponential gas dissipation over time and without. We discuss the sensitivity of planetary growth to the metallicity and gas surface density in more detail in Sect. 5.4.
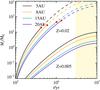 |
Fig. 4 Core growth as function of time, for different values of the initial dust-to-gas ratio Z0. Cores are placed on the same orbits as in Fig. 3, and similar labeling is used. Core growth is very sensitive to the initial metallicity: a twice as high value as the canonical dust-to-gas ratio of Z0 = 0.01 leads to the formation of exclusively gas giants, while lowering the metallicity by a factor 2 leads to systems of small ice giants. |
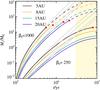 |
Fig. 5 Core growth as function of time, for two values of the initial gas surface density β0, which has been altered by a factor of two from the standard value used here (β0 = 500 g cm-2). Cores are placed on the same orbits as in Fig. 3, and similar labeling is used. The grey lines give the evolution in a disc with a temporally constant gas surface density profile, corresponding to Eq. (35). |
4. Planetary migration
We have assumed that cores grow approximately in situ. However, while the core grows to embryo size, it is susceptible to type I migration. Due to a torque asymmetry, the planet migrates relative to the disc towards the star (Goldreich & Tremaine 1980; Ward 1997). The rate of this migration can be expressed as: 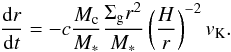 (36)Here, c is a parameter that depends on the radial pressure and temperature structure of the protoplanetary disc. Kretke & Lin (2012) give an overview of the migration rates in power-law discs (Tanaka et al. 2002; Paardekooper et al. 2010, 2011). We adopt c = 2.8 in the isothermal regime (Paardekooper et al. 2010), but other prescriptions would only weakly change migration rates by order unity for our simple disc model.
By combining the planetary accretion rate (Eq. (28)) and the migration rate, we can find the relation between the planetary mass and the migrated distance, 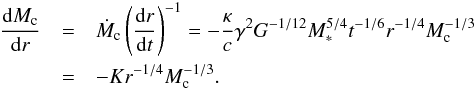 (37)This expression no longer depends on β, and thus the gas surface density. We have assumed here H/r = γr1/4, with γ = 0.033 AU−1/4, and defined
  . To ease the calculation, we also fixed the pebble surface density, which only slowly changes with time, to the profile at t = 106 yr and assumed a constant pebble size of τf = 0.05. The constant K has the value of
  AU−3/4. After integration we find the planetary mass as a function of the migrated distance,
  (38)Here, r0 and M0 are the initial orbital radius and mass of the embryo. This expression allows us to identify the lower mass above which a planetary core rapidly moves towards the star
 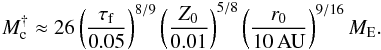 (39)This mass is in the regime where standard type I migration prescription no longer holds, and slower type II migration is expected to take over (Ward 1997). Furthermore, around these masses, cores become critical and transition to a phase of rapid growth in mass through gas accretion. Therefore, our planetary cores are not expected to migrate catastrophically into the star, unless migration is faster than prescribed here, by a factor ≳3, or pebbles are very small.
An extended discussion on planetary migration is beyond the scope of this paper. We can however consider cores in orbits similar to the early solar system. Figure 6 shows the migration trajectories, by giving the planetary mass as function of orbital radius. The inner planet, initially placed at 5 AU (with a mass of 10-3 ME) drifts inwards for about 2 AU, before reaching the critical core mass (here calculated taking the migration of the core into account). By triggering rapid gas accretion, the core leaves the type I migration regime. Here we have not taken into account that the disc structure around the location of Jupiter could significantly deviate from the simple power-law disc assumed here. In such regions where the viscosity or the opacity sharply changes, the migration of the giant planet cores can come to a complete halt (Masset et al. 2006; Lyra et al. 2010; Kretke & Lin 2012; Bitsch et al. 2013; Pierens et al. 2013). Our Saturn-like analogue similarly drifts a modest distance before reaching the critical core mass. Again, convergence zones could change this picture somewhat, and also the earlier growth of a Jupiter-like planet could halt the migration of the Saturn-analogue.
For the ice giants we find that cores in wide orbits undergo similarly little migration, because of the rapid core growth by pebble accretion. As opposed to the gas giants, ice giants cannot benefit from convergence zones, because they are generally not found to occur in the outer disc (Bitsch et al. 2014). Therefore, for planets in wider orbits growth really must be as fast as in the pebble accretion scenario in order to prevent the embryos from being lost to regions closer to the star.
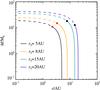 |
Fig. 6 Migration of cores due to type I migration, during the pebble accretion phase. Cores are placed initially at different initial orbital radii (r0 = 5,8,15,20 AU). Red dots mark the critical core mass and black dots the time at which the disc dissipates. Overall, migration is modest in discs where cores grow rapidly by pebble accretion. |
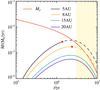 |
Fig. 7 Accretion rates of planetary cores at different orbital distances and the mass flux in pebbles past the cores (red curve). The cores of the gas giants reach their critical core mass before they achieve complete filtering (5−8 AU curves). In wider orbits (15−20 AU curves) planets only accrete a minor fraction of the full pebble flux, because the gas and dust disc dissipate after τdis = 3 Myr (yellow dashed area), well before sizes with efficient filtering are reached. |
5. Planetary systems
5.1. Dust disc mass
Based on the growth of the innermost core, we can estimate a minimally required mass of solids in the disc in order to form giant planets. As illustrated in Fig. 3 growth occurs inside-out, and therefore the pebble flux is not significantly reduced when multiple cores are considered. Figure 7 illustrates the accretion rates of the cores, as a function of time, for planets in the same orbits as in Fig. 3. For a limited number of embryos that grow into planets there is no real “competition” for pebbles. Thus, Fig. 3 which does not include reduction in the pebble flux on the inner planets from the accretion of pebbles by the outer planets is also a good description of a system of multiple planets.
We can estimate the total mass of pebbles necessary to drift towards the core, Mℱ, in order for a planet to grow to the critical core mass. To increase the core in mass by an amount dMc, we need a mass of pebbles dMℱ = f-1dMc. After integration and using the filtering factor f from Eq. (33), we find 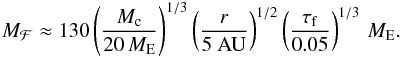 (40)We have taken here Mc = 20 ME for the final core mass, corresponding to the critical core mass at 5 AU (Sect. 3.2). The efficiency of converting pebbles into a single core is thus on the order of Mc/Mℱ ≈ 15%.
The minimum solid mass estimated in Eq. (40) does not increase significantly when considering multiple cores, because of the inside-out formation we propose. This also implies that if there is sufficient material available in the disc to form one core, then there is enough mass to form several more. Therefore, planetary systems formed by pebble accretion likely consist of multiple gas and ice-giant planets.
We briefly comment that in planetesimal-driven scenarios (Pollack et al. 1996), it is difficult to estimate the initial total mass in solids required to form the cores of giant planets, because the conversion efficiency of dust to planetesimals is poorly known. In contrast, for core growth by pebble accretion, we can assume that pebbles formed very efficiently. Particles of mm-sizes appear to be a robust outcome of dust coagulation, both theoretically (Brauer et al. 2008; Birnstiel et al. 2012), observationally (Ricci et al. 2010) and in the laboratory (Blum & Wurm 2008). Therefore, the estimate made in Eq. (40) directly ties the initial dust mass in the protoplanetary disc to the efficiency of planet formation by pebble accretion.
5.2. Observed dust disc masses
The required total dust mass estimated in Eq. (40) of about 130 ME is consistent with estimates of dust masses inferred in protoplanetary discs, roughly between 1–300 ME (Andrews et al. 2013; Mohanty et al. 2013). These measurements of disc masses should be interpreted with caution, as they are in fact lower limits (Hartmann 2008). For example, particles could grow larger than mm in which case the opacity would be overestimated or the metallicity in the disc could decrease over time, as we see in our model (Fig. 1). For one of the best characterized protoplanetary discs, found around the young star TW Hya, the gas mass is measured to be Mgas ≳ 0.05 M⊙ (Bergin et al. 2013). For Z = 0.01, this would result in a dust disc mass of more than 167 ME.
The total dust mass placed in our disc model is comparable to what would be obtained from the MMSN integrated to 100 AU (≈138 ME). However, by construction the MMSN does not take into account the solids that were not accreted onto the planets. The required total dust mass in our model remains significantly lower than the solid surface densities enriched 4 to 6 times with respect to the MMSN required in core growth models with planetesimals (Pollack et al. 1996), which additionally assume perfect dust to planetesimal conversion. Recent work even suggests that dust enhancements by more than a factor 10 are necessary to explain growth of the cores of the gas giants by planetesimals (Kobayashi et al. 2011).
5.3. Systems similar to the solar system
In Fig. 3, we showed the growth of cores placed at 5−20 AU, similar to the compact configuration of the solar system giant planets expected after disc dissipation (Tsiganis et al. 2005). These results should be approached with caution, as we merely intend to demonstrate the plausibility of forming planetary systems in pebble discs, rather than to explore the exact conditions under which the solar system formed. It is nevertheless of interest to highlight some of the relatively robust characteristics of planetary systems formed from the pebble flux in protoplanetary discs.
We first focus on the two inner cores that turn into gas giants. Our model naturally leads to the formation of the core of Jupiter before the core of Saturn, and the latter typically forms close to the time of disc dissipation. This is a desirable feature for the Grand Tack scenario (Masset & Snellgrove 2001; Morbidelli & Crida 2007; Walsh et al. 2011), where Saturn catches up with Jupiter to share a common gap, which leads to outward migration. This only occurs when Saturn remains smaller than Jupiter (Pierens & Raymond 2011).
The cores of the gas giant planets appear only relatively late in the disc lifetime, after ≈1 Myr. Pebble accretion rates are reduced compared to an MMSN-based estimate, because the instantaneous pebble column density in the evolving pebble disc is lower. This slowdown is actually a desirable feature, as it can explain the limited gas accretion onto Jupiter and Saturn (Szulágyi et al. 2014) and the high noble gas content of the gas giants (Owen et al. 1999; Guillot & Hueso 2006) as gas dissipation increases the fraction of all condensable species.
In the outer disc cores remain small and of similar size, between 10 and 20 ME. We have verified that pebble accretion rates remain sufficiently high at all times to prevent runaway gas accretion, unless the core reaches isolation from pebbles (Sect. 3.2). In Fig. 3, the Uranus analogue grows slightly larger than the Neptune analogue (18 and 13 ME respectively). In reality, Uranus has MU = 14.5 ME and Neptune has MN = 17.2 ME. However, here we have not included effects of gravitational perturbations between the embryos or from the planetesimals, which could displace the planets. Indeed, the probability that Uranus and Neptune exchanged positions after disc dissipation is high (Tsiganis et al. 2005).
At the time of disc dissipation (here taken to be ≈3 Myr), of the order of 50 ME of drifting pebbles are left in the giant planet zone5. One can therefore imagine a scenario where during the disc dissipation phase the metallicity is elevated by gas removal and pebbles are efficiently converted into planetesimals by the streaming instability (Johansen et al. 2009; Bai & Stone 2010). In the Nice model (Tsiganis et al. 2005), planetesimal scattering after disc dissipation forces the giant planets into their final orbital architecture. To do so, a mass in planetesimals of about 50 ME is required (Morbidelli et al. 2007; Batygin & Brown 2010; Levison et al. 2011), in good agreement with our estimate.
It is difficult to extrapolate our results towards the inner disc, where the terrestrial planets formed. In our simple model, at the time a planet at 5 AU reaches isolation, ≈55 ME of pebbles have drifted past the core. This value was calculated by integrating the pebble flux between t = 105 yr and the time at which the Jupiter analogue reaches its critical mass, and subtracting the mass in the cores at that time. After these pebbles cross the ice line, about 27 ME of solids are deposited in the terrestrial planet zone, assuming a rock-to-ice fraction of 50%. This is large compared to the total mass required to form the terrestrial planets, which is typically between 2.5−10 ME (Raymond et al. 2013). However, the drift of pebbles could be halted by a pressure bump at the ice line (Kretke & Lin 2007) or reduced by the rapid growth of solids through a sublimation-condensation cycle (Ros & Johansen 2013). However, for planetary systems different than the solar system, emptying a reservoir of small solids into the inner planetary system has previously been proposed to explain the rich systems of small planets detected by the Kepler satellite (Lissauer et al. 2011).
In summary, pebble accretion leads to inside-out planet formation, where cores in the inner disc become gas giants, and cores in the outer disc become ice giants. The gas giants form at a time close to disc dissipation, and with a favourable mass ratio for a late Grand Tack migration. The amount of remnant pebbles converted to planetesimals is sufficient for planetesimal driven planet migration as envisioned in the Nice model.
5.4. Exoplanetary systems
5.4.1. Metallicity
Core growth is very sensitive to the initially assumed metallicity Z0 (Eq. (35)). In Fig. 4 we demonstrated the effect of an increase and decrease of the initial dust-to-gas ratio by a factor 2. In systems with a low initial dust content, below solar values, the formation of gas giants is suppressed. Such a sharp cut-off could explain why exoplanet surveys find that, at least for close in exoplanets, gas giants are nearly absent around stars with sub-solar metallicities (Fischer & Valenti 2005). Neptune-mass planets and super-Earths, on the other hand, appear around both low- and high-metallicity stars (Buchhave et al. 2012).
5.4.2. Dependence on disc and stellar mass
We can also explore the formation of cores in systems where we decrease the stellar mass and the disc mass, which are observed to be approximately proportional to each other (Mohanty et al. 2013; Andrews et al. 2013). For example, Fig. 8 shows the growth of cores when the stellar and disc mass are half that of the standard values used here (M∗ = 0.5 M⊙ and an initial surface density of 250 g cm-2 at 1 AU). No gas giant planets are formed under these conditions. This also seems to be supported by radial velocity and lensing surveys. Low mass stars (≈0.5 M⊙) rarely host gas giants (M> 100 ME), compared to ice giants which are found 10 times as often, in orbits between 2.3 and 7.2 AU (Clanton & Gaudi 2014). Also planetary candidates in the Kepler satellite data, found in close orbits, show a similar trend where stars with masses below ≈0.8 M⊙ rarely host gas giant planets (Wu & Lithwick 2013).
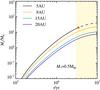 |
Fig. 8 Core growth as function of time, for a low mass star. Cores are placed on the same orbits as in Fig. 3, and similar labeling is used. Here we have assumed that a star with half the mass of the Sun has a circumstellar disc half as massive than considered in our solar case. The formation of giant planets that reach the critical core mass and become gas giants becomes much harder. |
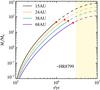 |
Fig. 9 Core growth as function of time, for a system with orbital distances taken from the current orbits of the known exoplanets in HR8799. In order to comfortably form the critical core at the widest separation of 68 AU, we increased the disc mass by a factor three compared to the solar system case depicted in Fig. 3. The outer two cores reach the critical core mass before reaching pebble isolation (see also Sect. 3.2). |
5.4.3. The planetary system around HR8799
The planetary system around HR8799 consists of at least 4 planets in wide orbits between 15 and 70 AU (Marois et al. 2010). In situ formation is hard to explain in the context of planetesimal-driven core accretion theory, because planetesimal accretion rates are too slow in wide orbits (Dodson-Robinson et al. 2009). Although likely a rare system (Lafrenière et al. 2007), such planets in wide orbits can be formed in the pebble accretion scenario. For example, we modelled a planetary system similar to HR8799, illustrated in Fig. 9. Here, we assumed Z0 = 0.01, consistent with the metallicity inferred for HR8799 (Baines et al. 2012) and similarly kept all parameters the same as in our standard model, but increased the initial gas surface density by a factor 3, corresponding to 1500 g cm-2 at 1 AU and changed the mass the star to that of HR8799 (1.47 M⊙). Other choices to form the system are also possible, for example one could half the initial gas column density, but extend the disc lifetime to τdis = 5 Myr or alter the metallicity, etc.
Alternatively, the HR8799 planets could have formed by gravitational instabilities, during the formation of the protoplanetary disc (Helled & Bodenheimer 2010). However, planetary-mass objects are difficult too form at these orbital distances (Kratter et al. 2010) and numerical simulations show that it is difficult not to catastrophically disrupt multiple systems formed by self-gravity (Vorobyov 2013). Nevertheless, if these planets are the result of gravitational instabilities of the disc, they would have a low, solar-like heavy element content, while our pebble accretion model predicts a significant enrichment in heavy elements.
6. Future directions
We identify three areas for future work. Especially important is the incorporation of the H2O, CO2 and CO icelines. The latter has recently been identified in the protoplanetary disc around TW Hya (Qi et al. 2013). In these regions we can expect particle growth to large pebble sizes and large pebble surface densities (Ros & Johansen 2013), possibly aided by the emergence of a pressure bump (Kretke & Lin 2007). Therefore, core growth rates would increase significantly near icelines. Furthermore, icelines recycle solid material that otherwise would be lost by radial migration. This could reduce the total disc masses necessary to form the giant planets even more.
A second important issue is that we have only traced those seeds that formed the cores of the giant planets. However, it is possible that many more embryos emerged during the evolution of the protoplanetary disc. It is uncertain how many seeds form with sizes that are large enough to enter the Hill accretion regime. This depends on the initial planetesimal size distribution and pebble accretion in the Bondi regime for such smaller planetesimals. If a large amount of such seeds form initially, their continued evolution and survival would depend on gravitational interactions between cores and planetesimals combined with type I migration (Kretke & Levison 2013).
A better understanding of the temporal evolution of the gas component of the protoplanetary disc is warranted. In principle, one could introduce a full “alpha”-model in order to evolve the gas surface density in time (Lynden-Bell & Pringle 1974). However, the validity of such models can be questioned. Self-similar solutions with an alpha model for the disc viscosity while maintaining a constant temperature, such as in Hartmann et al. (1998) should be improved with models including more detailed heating physics that capture the thermal profile of the disc (Chambers 2009). More crucially, it is by now rather well established that a large fraction of protoplanetary discs cannot drive ideal MRI turbulence, weakening the case for a simple alpha prescription. Disc winds have recently emerged as the possible main driver of angular momentum transport (Turner et al. 2014). It will thus be necessary to re-address the evolution of key quantities such as the gas surface density, the gas scale height and turbulent strength αt in disc-wind models (e.g., Armitage et al. 2013). Nevertheless, unless vertical field strengths show strong radial dependence, discs evolve homologously: they decline equally on all radii and surface densities are approximately inversely proportional to the orbital radius, in agreement with the simple prescription used here. Finally, the evolution of gas discs is possibly even more complicated if they are not isolated, as is typically assumed, but fueled by ingoing gas and dust accretion (Nordlund et al. 2014).
7. Summary
A sufficiently high radial flux of pebbles has to be maintained over the lifetime of a protoplanetary disc in order to explain the rapid growth of the cores of the giant planets. In this paper, we have demonstrated that such a pebble flow naturally emerges when taking into account dust growth and radial migration of pebbles due to gas drag.
We first introduced a simple analytical model of particle growth and pebble migration, which yields results in good agreement with advanced coagulation codes (Birnstiel et al. 2012). We obtain the following results regarding the pebble component:
-
1.
Pebbles with radii of approximately mm-cm are present in the giant planet formation zone during the entire lifetime of the protoplanetary disc, provided that the disc is large (≈100 AU).
-
2.
The radial mass flux in pebbles is high, of the order of 10-4 ME/yr, corresponding to a solid surface densities in pebbles of about Σp ≈ 0.1(r/ 10 AU)− 3 / 4 g cm-2.
-
1.
A single core forms rapidly, within about 1 Myr at 5 AU.
-
2.
The efficiency with which a core forms, here calculated as the ratio of accreted pebbles over those that drift by, is approximately 20%.
-
3.
Outside 5 AU, cores can grow sufficiently fast to avoid rapid orbital decay by type I migration.
-
1.
Systems similar to the solar system appear readily understandard assumptions for the protoplanetary disc.
-
2.
However, core growth is very sensitive to the initial dust-to-gas ratio. Below the solar metallicity cores for gas giant planets can no longer form.
-
3.
Gas giant formation is also suppressed around low mass stars (≲0.5 M⊙).
These latter two points agree well with the findings from exoplanet surveys (Buchhave et al. 2012; Clanton & Gaudi 2014).
We investigated the system similar to the early solar system in more detail. There we identify the following key points:
-
1.
Jupiter forms first, within ≈1 Myr, even under conditions where the solid surface density is much lower than in standard core accretion scenarios with planetesimals.
-
2.
Saturn forms later (at ≈2.5 Myr) explaining the smaller mass of Saturn necessary for outwards migration of Jupiter and Saturn.
-
3.
After the formation of the giant planets, a sufficient amount of solids is left for a planetesimal disc which can drive the planetary instability described in the Nice scenario.
-
4.
The solid mass delivered to the terrestrial region is sufficiently large to form the terrestrial planets.
In summary, we have demonstrated that the pebble column density in typical protoplanetary discs is sufficiently high to form the cores of giant planets by pebble accretion within disc lifetimes (≈3 Myr), even in wide orbits outside 10 AU. Additionally, such fast core growth likely overcomes inward migration by disc torques (known as type I migration). The efficiency with which embryos grow from the radial pebble flux is high. Therefore, an initial mass of about 150 ME in dust is sufficient and in agreement with observations of protoplanetary discs. Finally, in our model, gas-giant planets do not easily grow in low-mass discs and usually do not form in discs with dust-to-gas ratios below solar. This is in agreement with results from exoplanet surveys.
The average radial particle velocity is given to good approximation by Eq. (17), even when considering turbulence and collective particle effects (Weidenschilling 2006). Because the diffusive timescale over a length l is given by tdiff = l2/ (αtH2ΩK) and the radial drift time scale by tdrift = l/ (2τfηvK), diffusion only dominates on scales smaller than (l/H) ≈ α(H/r)/(2τfη) ≈ 0.062(αt/ 10-3)(τf/ 0.1)-1(r/ 10 AU)− 1/4. This is much smaller than the global scale of the disc, r, over which pebble transport occurs.
The age of TW Hya is estimated to be 5−10 Myr, but the star is possibly as young as ~3 Myr based on near-infrared spectroscopy by Vacca & Sandell (2011).
The solution with exponential disc dissipation, which takes the form of an incomplete gamma function, is calculated numerically for all results illustrated in Fig. 3 and following similar figures.
However, for consistency one has to verify that ti is chosen such that the pebble production line rg has passed the orbit of the planet r, so the seed planetesimal can form by the streaming instability and accrete pebbles.
This mass in pebbles was obtained by integrating the pebble flux between the time at which Jupiter reaches the critical core mass, halting the inwards pebble drift, and the time of disc dissipation, while subtracting the growth of the other three planets during that time.
Acknowledgments
M.L. thanks Alessandro Morbidelli, Akimasa Kataoka, Katrin Ros, Katherine Kretke, Bertram Bitsch, Seth Jacobson, Tristan Guillot and Til Birnstiel for valuable comments. The authors are grateful for the constructive feedback by an anonymous referee. A.J. and M.L. thank the Royal Swedish Academy of Sciences and the Knut and Alice Wallenberg Foundation for their financial support. A.J. was also supported by the Swedish Research Council (grant 2010-3710) and the European Research Council (ERC Starting Grant 278675-PEBBLE2PLANET).
References
- Andrews, S. M., Wilner, D. J., Hughes, A. M., et al. 2012, ApJ, 744, 162 [NASA ADS] [CrossRef] [Google Scholar]
- Andrews, S. M., Rosenfeld, K. A., Kraus, A. L., & Wilner, D. J. 2013, ApJ, 771, 129 [NASA ADS] [CrossRef] [Google Scholar]
- Armitage, P. J., Simon, J. B., & Martin, R. G. 2013, ApJ, 778, L14 [NASA ADS] [CrossRef] [Google Scholar]
- Bai, X.-N., & Stone, J. M. 2010, ApJ, 722, 1437 [NASA ADS] [CrossRef] [Google Scholar]
- Baines, E. K., White, R. J., Huber, D., et al. 2012, ApJ, 761, 57 [NASA ADS] [CrossRef] [Google Scholar]
- Batygin, K., & Brown, M. E. 2010, ApJ, 716, 1323 [NASA ADS] [CrossRef] [Google Scholar]
- Bergin, E. A., Cleeves, L. I., Gorti, U., et al. 2013, Nature, 493, 644 [NASA ADS] [CrossRef] [PubMed] [Google Scholar]
- Birnstiel, T., Klahr, H., & Ercolano, B. 2012, A&A, 539, A148 [NASA ADS] [CrossRef] [EDP Sciences] [Google Scholar]
- Bitsch, B., Crida, A., Morbidelli, A., Kley, W., & Dobbs-Dixon, I. 2013, A&A, 549, A124 [NASA ADS] [CrossRef] [EDP Sciences] [Google Scholar]
- Bitsch, B., Morbidelli, A., Lega, E., & Crida, A. 2014, A&A, 564, A135 [NASA ADS] [CrossRef] [EDP Sciences] [Google Scholar]
- Blum, J., & Wurm, G. 2008, ARA&A, 46, 21 [NASA ADS] [CrossRef] [EDP Sciences] [Google Scholar]
- Brauer, F., Dullemond, C. P., & Henning, T. 2008, A&A, 480, 859 [NASA ADS] [CrossRef] [EDP Sciences] [Google Scholar]
- Buchhave, L. A., Latham, D. W., Johansen, A., et al. 2012, Nature, 486, 375 [NASA ADS] [Google Scholar]
- Chambers, J. E. 2009, ApJ, 705, 1206 [NASA ADS] [CrossRef] [Google Scholar]
- Chambers, J. E. 2014, Icarus, 233, 83 [NASA ADS] [CrossRef] [Google Scholar]
- Clanton, C., & Gaudi, B. S. 2014, ApJ, 791, 91 [NASA ADS] [CrossRef] [Google Scholar]
- Dent, W. R. F., Greaves, J. S., & Coulson, I. M. 2005, MNRAS, 359, 663 [NASA ADS] [CrossRef] [Google Scholar]
- Dodson-Robinson, S. E., Veras, D., Ford, E. B., & Beichman, C. A. 2009, ApJ, 707, 79 [NASA ADS] [CrossRef] [Google Scholar]
- Draine, B. T. 2006, ApJ, 636, 1114 [NASA ADS] [CrossRef] [Google Scholar]
- Draine, B. T., Dale, D. A., Bendo, G., et al. 2007, ApJ, 663, 866 [NASA ADS] [CrossRef] [Google Scholar]
- Fischer, D. A., & Valenti, J. 2005, ApJ, 622, 1102 [NASA ADS] [CrossRef] [Google Scholar]
- Garaud, P. 2007, ApJ, 671, 2091 [NASA ADS] [CrossRef] [Google Scholar]
- Goldreich, P., & Tremaine, S. 1980, ApJ, 241, 425 [NASA ADS] [CrossRef] [MathSciNet] [Google Scholar]
- Guillot, T. 2005, Ann. Rev. Earth Planet. Sci., 33, 493 [NASA ADS] [CrossRef] [MathSciNet] [PubMed] [Google Scholar]
- Guillot, T., & Hueso, R. 2006, MNRAS, 367, L47 [CrossRef] [Google Scholar]
- Guillot, T., Santos, N. C., Pont, F., et al. 2006, A&A, 453, L21 [NASA ADS] [CrossRef] [EDP Sciences] [Google Scholar]
- Guillot, T., Ida, S., & Ormel, C. W. 2014, A&A, 572, A72 [NASA ADS] [CrossRef] [EDP Sciences] [Google Scholar]
- Haisch, Jr., K. E.,Lada, E. A., & Lada, C. J. 2001, ApJ, 553, L153 [NASA ADS] [CrossRef] [Google Scholar]
- Hartmann, L. 2008, Phys. Scr., 130, 4012 [Google Scholar]
- Hartmann, L., Calvet, N., Gullbring, E., & D’Alessio, P. 1998, ApJ, 495, 385 [NASA ADS] [CrossRef] [Google Scholar]
- Hayashi, C. 1981, Prog. Theor. Phys. Suppl., 70, 35 [NASA ADS] [CrossRef] [MathSciNet] [Google Scholar]
- Helled, R., & Bodenheimer, P. 2010, Icarus, 207, 503 [NASA ADS] [CrossRef] [Google Scholar]
- Helled, R., Anderson, J. D., Podolak, M., & Schubert, G. 2011, ApJ, 726, 15 [NASA ADS] [CrossRef] [Google Scholar]
- Hernández, J., Calvet, N., Hartmann, L., et al. 2005, AJ, 129, 856 [NASA ADS] [CrossRef] [Google Scholar]
- Isella, A., Carpenter, J. M., & Sargent, A. I. 2009, ApJ, 701, 260 [NASA ADS] [CrossRef] [Google Scholar]
- Johansen, A., & Lacerda, P. 2010, MNRAS, 404, 475 [NASA ADS] [Google Scholar]
- Johansen, A., Youdin, A., & Mac Low, M.-M. 2009, ApJ, 704, L75 [NASA ADS] [CrossRef] [Google Scholar]
- Johansen, A., Youdin, A. N., & Lithwick, Y. 2012, A&A, 537, A125 [NASA ADS] [CrossRef] [EDP Sciences] [Google Scholar]
- Kataoka, A., Tanaka, H., Okuzumi, S., & Wada, K. 2013, A&A, 557, L4 [NASA ADS] [CrossRef] [EDP Sciences] [Google Scholar]
- Kitamura, Y., Momose, M., Yokogawa, S., et al. 2002, ApJ, 581, 357 [NASA ADS] [CrossRef] [Google Scholar]
- Kobayashi, H., Tanaka, H., & Krivov, A. V. 2011, ApJ, 738, 35 [NASA ADS] [CrossRef] [Google Scholar]
- Kratter, K. M., Murray-Clay, R. A., & Youdin, A. N. 2010, ApJ, 710, 1375 [NASA ADS] [CrossRef] [Google Scholar]
- Kraus, A. L., Ireland, M. J., Hillenbrand, L. A., & Martinache, F. 2012, ApJ, 745, 19 [NASA ADS] [CrossRef] [Google Scholar]
- Kretke, K. A., & Levison, H. F. 2013, in AAS/Division for Planetary Sciences Meeting Abstracts, 45, 41511 [Google Scholar]
- Kretke, K. A., & Lin, D. N. C. 2007, ApJ, 664, L55 [NASA ADS] [CrossRef] [Google Scholar]
- Kretke, K. A., & Lin, D. N. C. 2012, ApJ, 755, 74 [NASA ADS] [CrossRef] [Google Scholar]
- Lafrenière, D., Doyon, R., Marois, C., et al. 2007, ApJ, 670, 1367 [NASA ADS] [CrossRef] [Google Scholar]
- Lambrechts, M., & Johansen, A. 2012, A&A, 544, A32 [Google Scholar]
- Lambrechts, M., Johansen, A., & Morbidelli, A. 2014, A&A, 572, A35 [NASA ADS] [CrossRef] [EDP Sciences] [Google Scholar]
- Levison, H. F., Thommes, E., & Duncan, M. J. 2010, AJ, 139, 1297 [NASA ADS] [CrossRef] [Google Scholar]
- Levison, H. F., Morbidelli, A., Tsiganis, K., Nesvorný, D., & Gomes, R. 2011, AJ, 142, 152 [NASA ADS] [CrossRef] [Google Scholar]
- Lissauer, J. J., Fabrycky, D. C., Ford, E. B., et al. 2011, Nature, 470, 53 [NASA ADS] [CrossRef] [PubMed] [Google Scholar]
- Lommen, D., Maddison, S. T., Wright, C. M., et al. 2009, A&A, 495, 869 [NASA ADS] [CrossRef] [EDP Sciences] [Google Scholar]
- Lynden-Bell, D., & Pringle, J. E. 1974, MNRAS, 168, 603 [NASA ADS] [CrossRef] [Google Scholar]
- Lyra, W., Paardekooper, S.-J., & Mac Low, M.-M. 2010, ApJ, 715, L68 [NASA ADS] [CrossRef] [Google Scholar]
- Marois, C., Zuckerman, B., Konopacky, Q. M., Macintosh, B., & Barman, T. 2010, Nature, 468, 1080 [NASA ADS] [CrossRef] [PubMed] [Google Scholar]
- Masset, F., & Snellgrove, M. 2001, MNRAS, 320, L55 [NASA ADS] [CrossRef] [Google Scholar]
- Masset, F. S., Morbidelli, A., Crida, A., & Ferreira, J. 2006, ApJ, 642, 478 [NASA ADS] [CrossRef] [Google Scholar]
- McNeil, D., Duncan, M., & Levison, H. F. 2005, AJ, 130, 2884 [NASA ADS] [CrossRef] [Google Scholar]
- Menu, J., van Boekel, R., Henning, T., et al. 2014, A&A, 564, A93 [NASA ADS] [CrossRef] [EDP Sciences] [Google Scholar]
- Miller, N., & Fortney, J. J. 2011, ApJ, 736, L29 [NASA ADS] [CrossRef] [Google Scholar]
- Mizuno, H. 1980, Prog. Theor. Phys., 64, 544 [Google Scholar]
- Mohanty, S., Greaves, J., Mortlock, D., et al. 2013, ApJ, 773, 168 [NASA ADS] [CrossRef] [Google Scholar]
- Morbidelli, A., & Crida, A. 2007, Icarus, 191, 158 [NASA ADS] [CrossRef] [Google Scholar]
- Morbidelli, A., & Nesvorny, D. 2012, A&A, 546, A18 [NASA ADS] [CrossRef] [EDP Sciences] [Google Scholar]
- Morbidelli, A., Tsiganis, K., Crida, A., Levison, H. F., & Gomes, R. 2007, AJ, 134, 1790 [NASA ADS] [CrossRef] [Google Scholar]
- Morbidelli, A., Bottke, W. F., Nesvorný, D., & Levison, H. F. 2009, Icarus, 204, 558 [NASA ADS] [CrossRef] [Google Scholar]
- Moutou, C., Deleuil, M., Guillot, T., et al. 2013, Icarus, 226, 1625 [NASA ADS] [CrossRef] [Google Scholar]
- Nakagawa, Y., Sekiya, M., & Hayashi, C. 1986, Icarus, 67, 375 [NASA ADS] [CrossRef] [Google Scholar]
- Natta, A., Testi, L., Calvet, N., et al. 2007, Protostars and Planets V, eds. B. Reipurth, D. Jewitt, & K. Keil (University of Arizona Press), 767 [Google Scholar]
- Nordlund, Å., Haugbølle, T., Küffmeier, M., Padoan, P., & Vasileiades, A. 2014, in IAU Symp. 299, eds. M. Booth, B. C. Matthews, & J. R. Graham, 131 [Google Scholar]
- Okuzumi, S., Tanaka, H., Kobayashi, H., & Wada, K. 2012, ApJ, 752, 106 [NASA ADS] [CrossRef] [Google Scholar]
- Ono, T., Nomura, H., & Takeuchi, T. 2014, ApJ, 787, 37 [NASA ADS] [CrossRef] [Google Scholar]
- Ormel, C. W., & Cuzzi, J. N. 2007, A&A, 466, 413 [NASA ADS] [CrossRef] [EDP Sciences] [Google Scholar]
- Ormel, C. W., & Klahr, H. H. 2010, A&A, 520, A43 [NASA ADS] [CrossRef] [EDP Sciences] [Google Scholar]
- Ormel, C. W., & Kobayashi, H. 2012, ApJ, 747, 115 [NASA ADS] [CrossRef] [Google Scholar]
- Owen, T., Mahaffy, P., Niemann, H. B., et al. 1999, Nature, 402, 269 [NASA ADS] [CrossRef] [Google Scholar]
- Paardekooper, S.-J., Baruteau, C., Crida, A., & Kley, W. 2010, MNRAS, 401, 1950 [NASA ADS] [CrossRef] [Google Scholar]
- Paardekooper, S.-J., Baruteau, C., & Kley, W. 2011, MNRAS, 410, 293 [NASA ADS] [CrossRef] [Google Scholar]
- Pérez, L. M., Carpenter, J. M., Chandler, C. J., et al. 2012, ApJ, 760, L17 [NASA ADS] [CrossRef] [Google Scholar]
- Pierens, A., & Raymond, S. N. 2011, A&A, 533, A131 [NASA ADS] [CrossRef] [EDP Sciences] [Google Scholar]
- Pierens, A., Cossou, C., & Raymond, S. N. 2013, A&A, 558, A105 [NASA ADS] [CrossRef] [EDP Sciences] [Google Scholar]
- Pollack, J. B., Hubickyj, O., Bodenheimer, P., et al. 1996, Icarus, 124, 62 [NASA ADS] [CrossRef] [Google Scholar]
- Qi, C., Öberg, K. I., Wilner, D. J., et al. 2013, Science, 341, 630 [NASA ADS] [CrossRef] [PubMed] [Google Scholar]
- Rafikov, R. R. 2004, AJ, 128, 1348 [NASA ADS] [CrossRef] [Google Scholar]
- Raymond, S. N., Kokubo, E., Morbidelli, A., Morishima, R., & Walsh, K. J. 2013, in Protostars and Planets VI, eds. H. Beuther, R. Klessen, C. Dullemond, & Th. Henning (University of Arizona Press), in press [arXiv:1312.1689] [Google Scholar]
- Ricci, L., Testi, L., Natta, A., et al. 2010, A&A, 512, A15 [NASA ADS] [CrossRef] [EDP Sciences] [Google Scholar]
- Ros, K., & Johansen, A. 2013, A&A, 552, A137 [NASA ADS] [CrossRef] [EDP Sciences] [Google Scholar]
- Scaife, A. M. M. 2013, MNRAS, 435, 1139 [NASA ADS] [CrossRef] [Google Scholar]
- Szulágyi, J., Morbidelli, A., Crida, A., & Masset, F. 2014, ApJ, 782, 65 [NASA ADS] [CrossRef] [Google Scholar]
- Tanaka, H., Takeuchi, T., & Ward, W. R. 2002, ApJ, 565, 1257 [NASA ADS] [CrossRef] [Google Scholar]
- Toomre, A. 1964, ApJ, 139, 1217 [NASA ADS] [CrossRef] [Google Scholar]
- Trotta, F., Testi, L., Natta, A., Isella, A., & Ricci, L. 2013, A&A, 558, A64 [NASA ADS] [CrossRef] [EDP Sciences] [Google Scholar]
- Tsiganis, K., Gomes, R., Morbidelli, A., & Levison, H. F. 2005, Nature, 435, 459 [NASA ADS] [CrossRef] [PubMed] [Google Scholar]
- Turner, N. J., Fromang, S., Gammie, C., et al. 2014, Protostars and Planets VI, eds. H. Beuther, R. Klessen, C. Dullemond, & Th. Henning (University of Arizona Press), in press [arXiv:1401.7306] [Google Scholar]
- Ubach, C., Maddison, S. T., Wright, C. M., et al. 2012, MNRAS, 425, 3137 [NASA ADS] [CrossRef] [Google Scholar]
- Vacca, W. D., & Sandell, G. 2011, ApJ, 732, 8 [NASA ADS] [CrossRef] [Google Scholar]
- Vorobyov, E. I. 2013, A&A, 552, A129 [NASA ADS] [CrossRef] [EDP Sciences] [Google Scholar]
- Walsh, K. J., Morbidelli, A., Raymond, S. N., O’Brien, D. P., & Mandell, A. M. 2011, Nature, 475, 206 [NASA ADS] [CrossRef] [PubMed] [Google Scholar]
- Ward, W. R. 1997, Icarus, 126, 261 [NASA ADS] [CrossRef] [Google Scholar]
- Weidenschilling, S. J. 1977, MNRAS, 180, 57 [NASA ADS] [CrossRef] [Google Scholar]
- Weidenschilling, S. J. 1984, Icarus, 60, 553 [NASA ADS] [CrossRef] [Google Scholar]
- Weidenschilling, S. J. 2006, Icarus, 181, 572 [NASA ADS] [CrossRef] [Google Scholar]
- Weingartner, J. C., & Draine, B. T. 2001, ApJ, 548, 296 [NASA ADS] [CrossRef] [Google Scholar]
- Williams, J. P., & Cieza, L. A. 2011, ARA&A, 49, 67 [NASA ADS] [CrossRef] [Google Scholar]
- Wilner, D. J., D’Alessio, P., Calvet, N., Claussen, M. J., & Hartmann, L. 2005, ApJ, 626, L109 [NASA ADS] [CrossRef] [Google Scholar]
- Windmark, F., Birnstiel, T., Güttler, C., et al. 2012, A&A, 540, A73 [NASA ADS] [CrossRef] [EDP Sciences] [Google Scholar]
- Wu, Y., & Lithwick, Y. 2013, ApJ, 772, 74 [NASA ADS] [CrossRef] [Google Scholar]
- Wyatt, M. C. 2008, ARA&A, 46, 339 [NASA ADS] [CrossRef] [Google Scholar]
- Youdin, A. N., & Lithwick, Y. 2007, Icarus, 192, 588 [NASA ADS] [CrossRef] [Google Scholar]
- Youdin, A. N., & Shu, F. H. 2002, ApJ, 580, 494 [NASA ADS] [CrossRef] [Google Scholar]
All Figures
|
Fig. 1 Solid surface density as function of orbital distance (black), at different times (indicated by the labels representing the time in years). The solid black lines represent the dust surface density and the dotted lines the pebble surface density. The exponentially decaying gas surface density is represented in blue, for the same times as the solid surface density. We have here assumed a gas disc dissipation time scale of τdis = 3 Myr. Gas surface densities larger than the red dashed line (which represent Toomre Q = 1), would be gravitationally unstable (see also Sect. 2.6). |
| In the text | |
|
Fig. 2 Dominant particle size, as function of orbital distance and time. Black lines represent the particle size expressed by the Stokes number, the dimensionless friction time of the particle (labels correspond to the disc age in yr). Yellow lines give the particle size in cm assuming the Epstein regime (103 and 107 yr omitted for clarity). Particle sizes decrease at wider orbits and at later times, but typically remain in the mm-cm regime in the giant planet formation zone (5−50 AU). Pebbles are spread to the orbital location where dust is still growing to pebble sizes rg. Beyond this orbit most of the solid mass will be in smaller dust particles. The disc dissipation time scale was set to τdis = 3 Myr. |
| In the text | |
|
Fig. 3 Core growth as function of time. The different orbital separations (5−8−15−20 AU) resemble the compact orbital configuration expected after disc dissipation (Tsiganis et al. 2005). The red points identify the critical mass where a phase of rapid gas accretion is triggered necessary for the formation of gas giants (Lambrechts et al. 2014). Core growth comes to a halt after reaching the critical core mass. The dashed lines represent an extrapolation ignoring this halt in accretion. The yellow shaded area marks the dissipation of the gas disc after τdis = 3 Myr. |
| In the text | |
|
Fig. 4 Core growth as function of time, for different values of the initial dust-to-gas ratio Z0. Cores are placed on the same orbits as in Fig. 3, and similar labeling is used. Core growth is very sensitive to the initial metallicity: a twice as high value as the canonical dust-to-gas ratio of Z0 = 0.01 leads to the formation of exclusively gas giants, while lowering the metallicity by a factor 2 leads to systems of small ice giants. |
| In the text | |
|
Fig. 5 Core growth as function of time, for two values of the initial gas surface density β0, which has been altered by a factor of two from the standard value used here (β0 = 500 g cm-2). Cores are placed on the same orbits as in Fig. 3, and similar labeling is used. The grey lines give the evolution in a disc with a temporally constant gas surface density profile, corresponding to Eq. (35). |
| In the text | |
|
Fig. 6 Migration of cores due to type I migration, during the pebble accretion phase. Cores are placed initially at different initial orbital radii (r0 = 5,8,15,20 AU). Red dots mark the critical core mass and black dots the time at which the disc dissipates. Overall, migration is modest in discs where cores grow rapidly by pebble accretion. |
| In the text | |
|
Fig. 7 Accretion rates of planetary cores at different orbital distances and the mass flux in pebbles past the cores (red curve). The cores of the gas giants reach their critical core mass before they achieve complete filtering (5−8 AU curves). In wider orbits (15−20 AU curves) planets only accrete a minor fraction of the full pebble flux, because the gas and dust disc dissipate after τdis = 3 Myr (yellow dashed area), well before sizes with efficient filtering are reached. |
| In the text | |
|
Fig. 8 Core growth as function of time, for a low mass star. Cores are placed on the same orbits as in Fig. 3, and similar labeling is used. Here we have assumed that a star with half the mass of the Sun has a circumstellar disc half as massive than considered in our solar case. The formation of giant planets that reach the critical core mass and become gas giants becomes much harder. |
| In the text | |
|
Fig. 9 Core growth as function of time, for a system with orbital distances taken from the current orbits of the known exoplanets in HR8799. In order to comfortably form the critical core at the widest separation of 68 AU, we increased the disc mass by a factor three compared to the solar system case depicted in Fig. 3. The outer two cores reach the critical core mass before reaching pebble isolation (see also Sect. 3.2). |
| In the text | |
Current usage metrics show cumulative count of Article Views (full-text article views including HTML views, PDF and ePub downloads, according to the available data) and Abstracts Views on Vision4Press platform.
Data correspond to usage on the plateform after 2015. The current usage metrics is available 48-96 hours after online publication and is updated daily on week days.
Initial download of the metrics may take a while.