Fig. 5
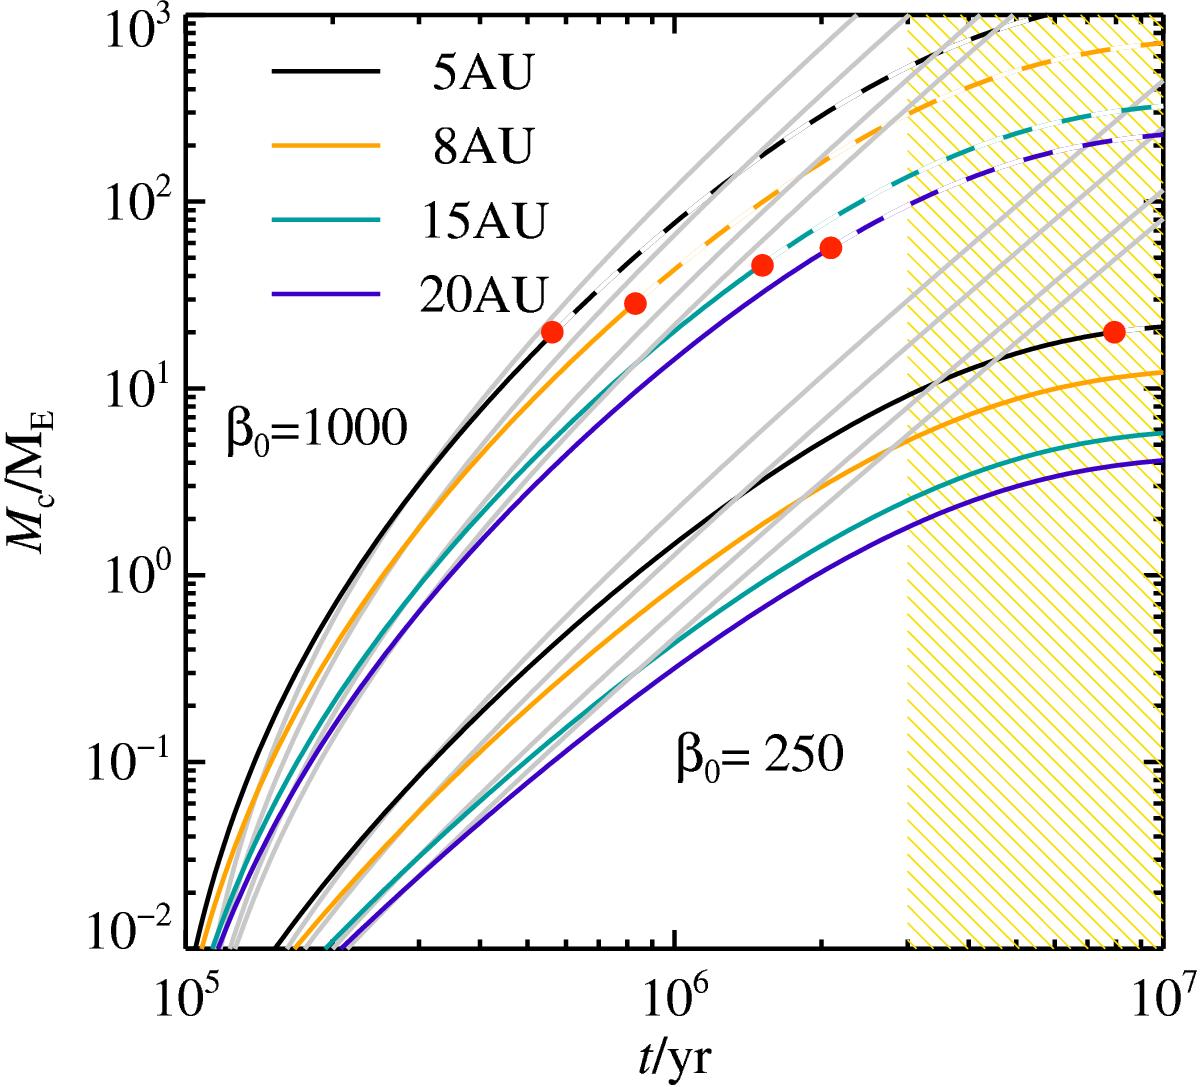
Core growth as function of time, for two values of the initial gas surface density β0, which has been altered by a factor of two from the standard value used here (β0 = 500 g cm-2). Cores are placed on the same orbits as in Fig. 3, and similar labeling is used. The grey lines give the evolution in a disc with a temporally constant gas surface density profile, corresponding to Eq. (35).
Current usage metrics show cumulative count of Article Views (full-text article views including HTML views, PDF and ePub downloads, according to the available data) and Abstracts Views on Vision4Press platform.
Data correspond to usage on the plateform after 2015. The current usage metrics is available 48-96 hours after online publication and is updated daily on week days.
Initial download of the metrics may take a while.