Fig. 1
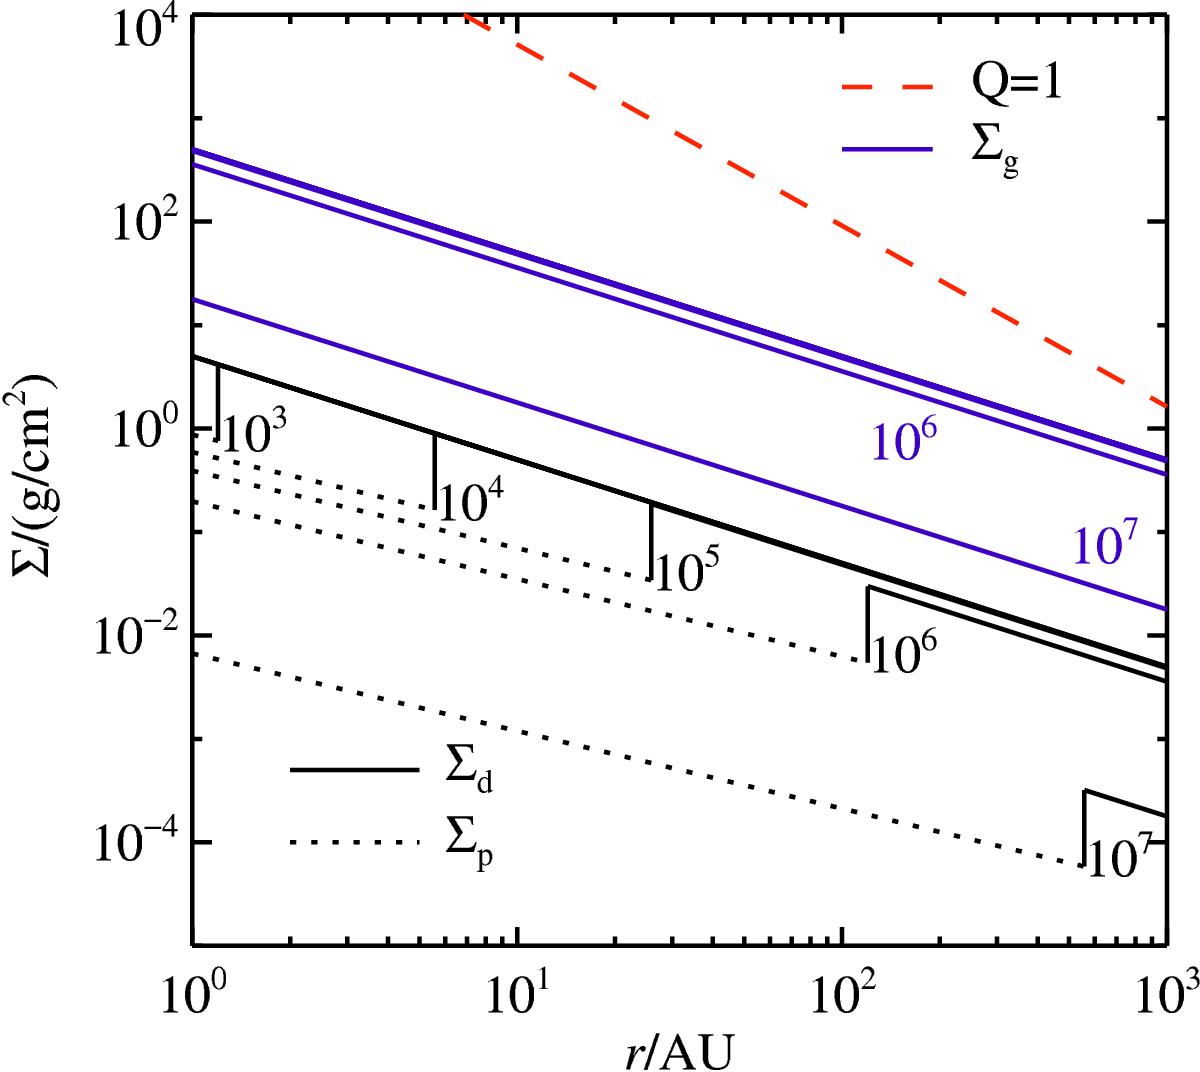
Solid surface density as function of orbital distance (black), at different times (indicated by the labels representing the time in years). The solid black lines represent the dust surface density and the dotted lines the pebble surface density. The exponentially decaying gas surface density is represented in blue, for the same times as the solid surface density. We have here assumed a gas disc dissipation time scale of τdis = 3 Myr. Gas surface densities larger than the red dashed line (which represent Toomre Q = 1), would be gravitationally unstable (see also Sect. 2.6).
Current usage metrics show cumulative count of Article Views (full-text article views including HTML views, PDF and ePub downloads, according to the available data) and Abstracts Views on Vision4Press platform.
Data correspond to usage on the plateform after 2015. The current usage metrics is available 48-96 hours after online publication and is updated daily on week days.
Initial download of the metrics may take a while.