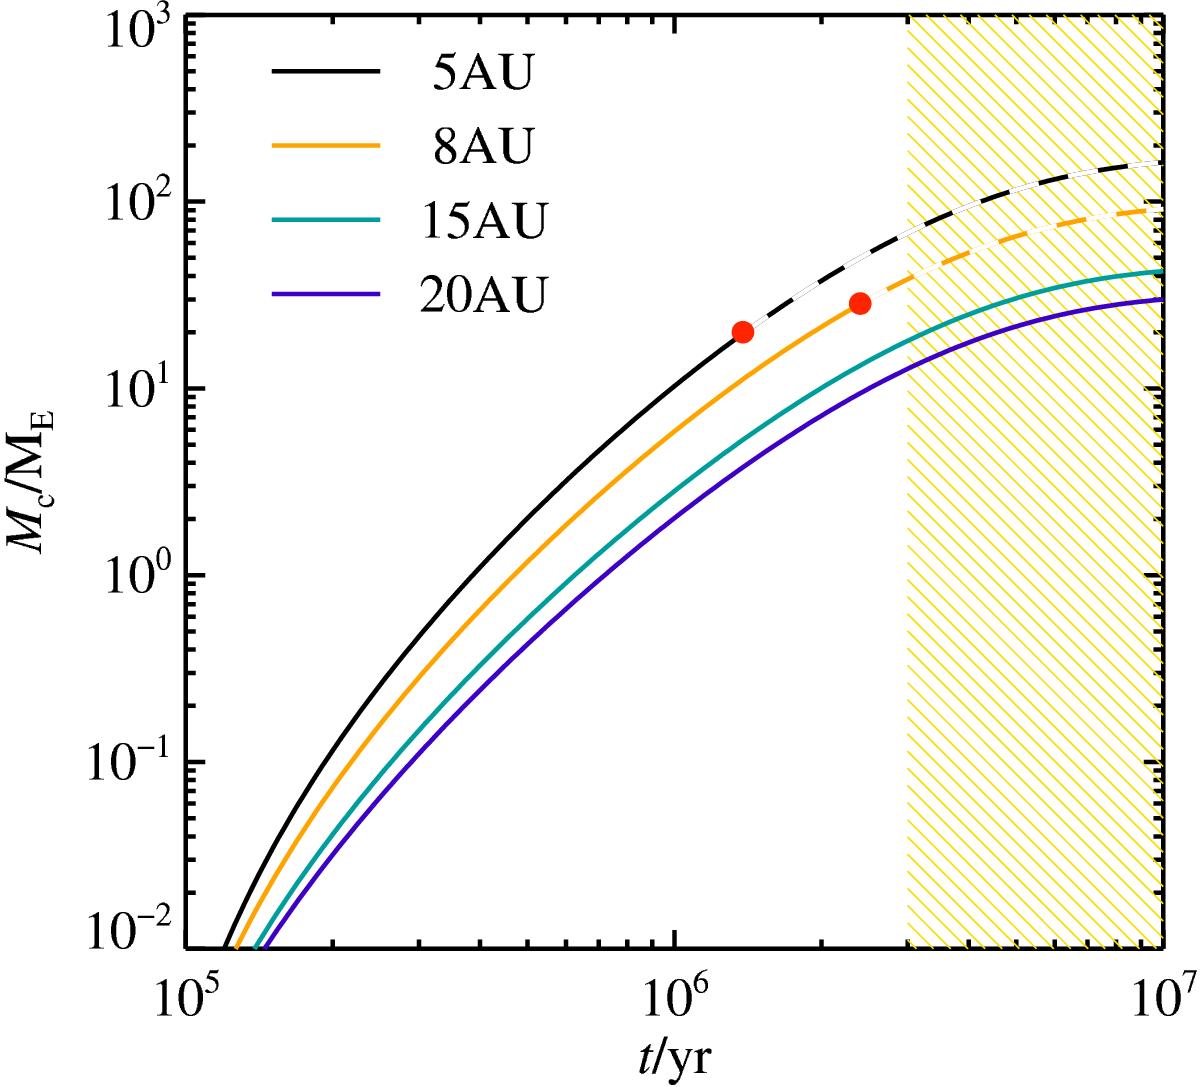
Fig. 3

Core growth as function of time. The different orbital separations (5−8−15−20 AU) resemble the compact orbital configuration expected after disc dissipation (Tsiganis et al. 2005). The red points identify the critical mass where a phase of rapid gas accretion is triggered necessary for the formation of gas giants (Lambrechts et al. 2014). Core growth comes to a halt after reaching the critical core mass. The dashed lines represent an extrapolation ignoring this halt in accretion. The yellow shaded area marks the dissipation of the gas disc after τdis = 3 Myr.
Current usage metrics show cumulative count of Article Views (full-text article views including HTML views, PDF and ePub downloads, according to the available data) and Abstracts Views on Vision4Press platform.
Data correspond to usage on the plateform after 2015. The current usage metrics is available 48-96 hours after online publication and is updated daily on week days.
Initial download of the metrics may take a while.


