| Issue |
A&A
Volume 565, May 2014
|
|
|---|---|---|
| Article Number | A59 | |
| Number of page(s) | 10 | |
| Section | Extragalactic astronomy | |
| DOI | https://doi.org/10.1051/0004-6361/201323331 | |
| Published online | 12 May 2014 | |
ALMA resolves turbulent, rotating [CII] emission in a young starburst galaxy at z = 4.8
1
European Southern Observatory,
Karl Schwarzschild Straße 2,
85748
Garching,
Germany
e-mail:
This email address is being protected from spambots. You need JavaScript enabled to view it.
2
Cavendish Laboratory, University of Cambridge,
19 J. J. Thomson
Avenue, Cambridge
CB3 0HE,
UK
3
Institute for Computational Cosmology, Durham University,
South Road,
Durham
DH1 3LE,
UK
4
School of Physics and Astronomy, University of Leeds,
Leeds
LS2 9JT,
UK
5
Centre for Astrophysics, Science & Technology Research
Institute, University of Hertfordshire, Hatfield
AL10 9AB,
UK
6
Research Center for Space and Cosmic Evolution, Ehime University,
Bunkyo-cho 2-5, Matsuyama,
790-8577
Ehime,
Japan
7
Max-Planck Institut für Astronomie, Königstuhl 17, 69117
Heidelberg,
Germany
8
Max-Planck-Institut für Radioastronomie,
Auf dem Hügel 69,
53121
Bonn,
Germany
Received:
23
December
2013
Accepted:
3
April
2014
Abstract
We present spatially resolved Atacama Large Millimeter/submillimeter Array (ALMA) [Cii] observations of the z = 4.7555 submillimetre galaxy, ALESS 73.1. Our 0.̋5 FWHM map resolves the [Cii] emitting gas which is centred close to the active galactic nucleus (AGN). The gas kinematics are dominated by rotation but with high turbulence, vrot/σint ~ 3.1, and a Toomre Q parameter <1 throughout the disk. By fitting three independent thin rotating disk models to our data, we derive a total dynamical mass of 3 ± 2 × 10¹⁰ M⊙. This is close to the molecular gas mass derived from previous CO(2-1) observations, and implies a CO to H2 conversion factor αCO < 2.3 M⊙ (K km s-1 pc2)-1. The mass budget also constrains the stellar mass to <3.1 × 10¹⁰ M⊙, and entails a gas fraction of fgas ≳ 0.4. The diameter of the dust continuum emission is <2 kpc, while the star-formation rate is as high as 1000 M⊙ yr-1. Combined with our stellar mass constraint, this implies an extreme specific star formation rate >80 Gyr-1, especially since there are no clear indications of recent merger activity. Finally, our high signal-to-noise [Cii] measurement revises the observed [Nii]/[Cii] ratio, which suggests a close to solar metallicity, unless the [Cii] flux contains significant contributions from Hii regions. Our observations suggest that ALESS73.1 is a nascent galaxy undergoing its first major burst of star formation, embedded within an unstable but metal-rich gas disk.
Key words: galaxies: high-redshift / galaxies: starburst / galaxies: kinematics and dynamics / galaxies: ISM
© ESO, 2014
1. Introduction
The [Cii] λ157.74 μm line is a powerful alternative line to 12CO for studying the interstellar medium (ISM) in high-redshift galaxies (e.g. review by Carilli & Walter 2013). The [Cii] line arises predominantly from photodissociation regions (PDRs) associated with star-forming regions; other contributions come from diffuse Hi clouds, low-density warm gas, or denser Hii regions (e.g. Madden et al. 1997), and possibly from shock enhancement (e.g. Appleton et al. 2013). In the most active systems, [Cii] is the dominant cooling line, representing ~0.1–1% of the total luminosity (e.g. Stacey et al. 1991). This luminosity means that [Cii] has significant promise as a route for determining redshifts of even the most obscured systems (Swinbank et al. 2012b; Weiß et al. 2013).
Until recently, [Cii] has remained relatively unexplored in the local Universe as its rest-frame wavelength requires balloon-borne or space-based observations. However, Herschel/PACS observations have now begun to provide spatially resolved [Cii] maps at scales of 0.1–1 kpc in nearby galaxies (e.g. Beirão et al. 2012; Parkin et al. 2013). These observations show significant variations in the line and continuum ratios involving [Cii] due to a range of physical processes including changes in the ionisation mechanism, gradients in metallicity or radiation field strengths – hinting at the potential diagnostic power of this line.
Ironically, [Cii] observations from the ground are easier at z > 1 as the line is redshifted into the submillimetre atmospheric windows. Over the past decade, [Cii] detections have been reported in an increasing number of galaxies at z = 1–2 (Hailey-Dunsheath et al. 2010; Stacey et al. 2010; Ferkinhoff et al. 2014), as well as more distant z> 2–6 systems (Maiolino et al. 2005, 2009; Iono et al. 2006; Wagg et al. 2010; Ivison et al. 2010; De Breuck et al. 2011; Cox et al. 2011; Swinbank et al. 2012b; Venemans et al. 2012; Riechers et al. 2013; Wang et al. 2013a; Rawle et al. 2014; Neri et al. 2014). The first of these high-redshift [Cii] detections were made in powerful quasars. These observations seemed to confirm the trend seen in local galaxies, where the most luminous far-infrared (FIR) sources (LFIR> 1011L⊙) have a ratio of [Cii] to (FIR) luminosity L[ CII ]/LFIR that is lower by about an order of magnitude (e.g. Luhman et al. 1998; Díaz-Santos et al. 2013). However, subsequent observations of a larger sample of powerful FIR sources, less-dominated by powerful active galactic nuclei (AGNs), revealed that the many high-redshift sources show [Cii] lines with similar L[ CII ]/LFIR ratios to those of nearby normal galaxies (Stacey et al. 2010; Carilli & Walter 2013).
By comparing the 12CO, [Cii] and FIR luminosities in a sample of z = 1–2 galaxies, Stacey et al. (2010) showed that star-formation dominated systems have similar L[CII]/LFIR to local (lower-luminosity) normal galaxies, while AGN dominated systems have lower ratios, as seen in local ultra-luminous infra-red galaxies (ULIRGs). In terms of PDR models (e.g. Kaufman et al. 1999), both classes are interpreted as having kpc-scale emitting regions, but the AGN-dominated sources appear to have an order of magnitude more intense far-UV radiation fields.
Luminous, high-redshift star-forming galaxies (submillimetre galaxies; SMGs) rather than quasar hosts are ideal targets to study the ISM of distant, luminous galaxies free from the influence of AGN. Although some SMGs contain luminous AGNs, it is clear from deep X-ray studies that in ~85% of SMGs, the AGN does not dominate the bolometric luminosity (Alexander et al. 2005; Georgantopoulos et al. 2011). Indeed for the less luminous SMGs the X-ray emission potentially originates from star-forming processes rather than an AGN (e.g. Wang et al. 2013b).
In this paper, we present new ALMA observations which spatially resolve the [Cii] emission around an SMG at z = 4.76 in the Extended Chandra Deep Field South (ECDFS): ALESS 73.1 (also known as LESS J033229.4−275619 or XID 403). This galaxy was originally identified as a compact, high-redshift AGN (Vanzella et al. 2006; Fontanot et al. 2007) and also a faint X-ray source from the Chandra observations of ECDFS (Gilli et al. 2011) and was then detected as the most likely counterpart of a luminous submillimetre source in the LABOCA survey of ECDFS by Weiß et al. (2009). Its properties, including both 12CO, [Cii] and [Nii] gas emission, were studied in a series of papers (Coppin et al. 2009, 2010; Biggs et al. 2011; Wardlow et al. 2011; De Breuck et al. 2011; Nagao et al. 2012; Gilli et al. 2014). Subsequent higher-resolution ALMA continuum observations by Hodge et al. (2013) provide an unambiguous identification of the z = 4.76 source as a luminous SMG. Our new ALMA observations map the spatial distribution and kinematics of the [Cii] and rest-frame FIR emission within this system on ~kpc scales, providing new insights into the structure of the most vigorous starbursts seen in the SMG population.
Throughout the paper, we assume H0 = 73 km s-1 Mpc-1, Ωm = 0.27, and ΩΛ = 0.73, indicating a scale size of 6.4 kpc/′′ at z = 4.76.
2. Observations
2.1. ALMA
The ALMA observations of ALESS 73.1 were obtained on UT 2012 July 18 and 27 in the compact Cycle 0 configuration, with 23 antennas covering baselines between 18 m and 402 m. We used the Band 7 receivers with the four basebands centred at 317.20, 319.07, 329.54, and 331.11 GHz. The [Cii] line was covered in the last two basebands to provide redundancy1, while the other basebands covered continuum emission. The correlator was used in the frequency domain mode with a bandwidth of 1875 MHz (488.28 kHz × 3840 channels per baseband). The total time on target was 1.62 h. The bandpass and gain calibrators were J 0522−364 and J 0403−360, respectively; the fluxes were calibrated with Pallas, Neptune, and Callisto. The observations were obtained in good weather conditions with precipitable water vapour between 0.6 and 0.75 mm.
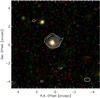 |
Fig. 1 Continuum-subtracted, velocity-integrated [Cii] emission (natural weighting) overplotted on a HST CANDELS YJH image (Grogin et al. 2011; Koekemoer et al. 2011). The HST emission traced by is dominated by an unresolved point source, consistent with AGN-dominated rest-frame UV-optical emission, with no clear host galaxy visible. Both the [Cii], which is spatially resolved in our ALMA observations at ~0.̋6 resolution, and the spatially-unresolved continuum emission (see Fig. 3) peak on the position of the optical/near-infrared source within 0.̋2, indicating that the AGN lies close to the centre of the FIR emission. The contour levels are −3, 3, 5, 10, 15, 20, 25, and 30σ, where σ = 7.5 mJy km s-1. |
The data reduction followed the standard procedures in the Common Astronomy Software Applications (casa) package (Petry & CASA Development Team 2012). We applied a 22 channel (24.85 km s-1) binning to the data cube, and cleaned it using natural weighting, which provides a final synthesised beam size of 0.̋65 × 0.̋40 at position angle of 91°. To search for spatially extended [Cii] and continuum emission, we also made maps with robust = 0.5, providing a resolution of 0.̋56 × 0.̋38 (see Fig. 1). In the remainder of this paper, we only use the higher signal to noise ratio (S/N) natural weighting data. To derive continuum maps, we summed all line free channels in the lower and upper sidebands separately, resulting in two continuum maps at 318.13 and 330.34 GHz, with bandwidths of 3.78 and 3.44 GHz, respectively (see Table 1). We also made a combined 318.13 + 330.34 GHz continuum map, which reaches an rms noise level of 0.15 mJy.
Observed properties of ALESS 73.1.
2.2. APEX
After the upgrade of the backend of the Swedish Heterodyne Facility Instrument (SHFI; Vassilev et al. 2008) on APEX2, we re-observed the [Cii] line in ALESS 73.1 on UT 2013 July 10 to 13 (ESO programme 092.A-0668). The two 2.5-GHz wide units of the Fast Fourier Transform Spectrometers now cover the full 4 GHz IF bandwidth of SHFI, allowing a much improved baseline subtraction compared to the original observations reported by De Breuck et al. (2011). The data were obtained in good to excellent observing conditions with a precipitable water vapour content of 0.16–1.05 mm. The total integration time on source was 4.8 h, and the data were reduced using standard procedures in the Continuum and Line Analysis Single-dish Software.
3. Results
3.1. Integrated [CII] and continuum emission
Table 1 lists the derived parameters from our ALMA data. The velocity-integrated [Cii] line is detected at a significance level of 22σ (Fig. 1), and is spatially resolved with a deconvolved FWHM size of 0.̋64 (4.1 kpc) with the position angle unconstrained. The integrated line flux is only half the intensity originally reported by De Breuck et al. (2011). Figure 2, however, shows that the new APEX observations with an rms = 16 mJy in 80 km s-1 channels do not detect the [Cii], which is consistent with the ALMA data. The [Cii], 12CO(2–1), and [Nii] redshifts are now all consistent within the uncertainties (see Table 1), suggesting they are originating from gas with the same bulk motion. We therefore adopt the [Cii] redshift z = 4.7555 as the systemic (barycentric) redshift and zero-point of all velocities quoted in this paper.
We also compared the velocity structure of the [Cii] and the [Nii] data from Nagao et al. (2012) by making velocity slices along the major axis of the data cube of both datasets. The results are consistent, though a detailed analysis is not possible due to the limited S/N and spatial resolution of the [Nii] data. We ascribe both the different [Cii] flux level and the velocity shift reported by Nagao et al. (2012) to baseline subtraction problems in the 3× narrower bandwidth APEX spectroscopy of De Breuck et al. (2011).
The greyscales in Fig. 3 show the combined 318.13 + 330.34 GHz continuum image, with a synthesised beam size of 0.̋64 × 0.̋44. We very marginally spatially resolve the continuum emission; the deconvolved FWHM size is 0.̋29 ± 0.̋06 (1.9 ± 0.4 kpc), with the position angle unconstrained. To align the HST and ALMA images, we first mapped the BVR images from the MUltiwavelength Survey by Yale-Chile (MUSYC; Gawiser et al. 2006) onto the ALMA astrometry from the ALESS survey (see Sect. 2.2.1 of Simpson et al. 2014). We then translated this new MUSYC astrometric solution to the HST images obtained as part of the Cosmic Assembly Near-infrared Deep Extragalactic Legacy Survey (CANDELS) images (Grogin et al. 2011; Koekemoer et al. 2011). The rms offset between the HST, MUSYC, and ALMA astrometry is 0.̋2, where the uncertainty is mainly due to the use of galaxies rather than stars for the alignment. We find that the ALESS73.1 dust continuum detection is offset by 0.̋22 from the HST F160W identification, corresponding to ~1σ compared to the astrometric accuracy. The HST image is itself spatially unresolved at 0.̋20 (1.3 kpc) resolution (Koekemoer et al. 2011). Hence both the rest-frame UV and FIR emission point towards an apparently compact galaxy. This is in contrast with the larger [Cii] disk, which has a projected FWHM of 0.̋68 (4.4 kpc), and which extends on both sides of the dust continuum (Fig. 3).
We also use the continuum image to search for other sources within the ALMA primary beam, we find no other detections above the 3σ = 0.5 mJy beam-1 level. We can therefore exclude any moderately bright companions at the redshift of ALESS73.1 within a projected radius of 40 kpc; scaling the star-formation rate (SFR) from the dust continuum flux of ALESS 73.1 (Hodge et al. 2013), the non-detection implies that any companion should have an SFR of <75 M⊙ yr-1. This indicates that ALESS 73.1 is unlikely to be a component of a mid-stage pre-coalescence merger with a second FIR-luminous companion, unlike hyper-luminous sources like HATLAS J084933.4+021443 (Ivison et al. 2013) or BR 1202−0725 (Wagg et al. 2012; Carilli et al. 2013; Carniani et al. 2013). A late stage merger cannot be excluded with our current data.
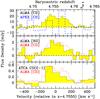 |
Fig. 2 Comparison of the spatially integrated [Cii], [Nii], and 12CO(2–1) velocity profiles. A scaled version of the ALMA velocity profile is reproduced as a red dotted line in the middle and bottom panels to show that the other lines are consistent with it. The top panel shows the APEX [Cii] non-detection (blue dashed histogram) is consistent within the uncertainties with the ALMA detection. |
3.2. [CII] velocity analysis
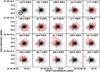 |
Fig. 3 Channel maps (spacing 24.85 km s-1) of [Cii] overlaid on the line-free
318.13 + 330.34 GHz dust continuum image. Contour levels start at 3σ, where
σ =
0.7 mJy/beam, and increase by
|
Our high S/N ALMA observations spatially resolve the [Cii] emission over 0.̋6, i.e. spread over ~2 × 2 synthesised beams (Fig. 3). This is a significant improvement with respect to other ALMA and IRAM observations published to date, which have relatively low S/N and/or barely resolved the [Cii] emission within the individual galaxies (Walter et al. 2009; Wagg et al. 2012; Gallerani et al. 2012; Carilli et al. 2013; Riechers et al. 2013; Willott et al. 2013; Wang et al. 2013a; Carniani et al. 2013; Rawle et al. 2014; Neri et al. 2014). We note that several high redshift [Cii] detections did detect nearby companion galaxies or different components of lensed galaxies. Our ALMA data have a peak S/N = 5–15 in each of the individual 25 km s-1 channels (Fig. 3), allowing us to kinematically model the [Cii] emission in this high redshift system, despite the rather limited spatial extent compared to the synthesised beam size (see also Gnerucci et al. 2011).
The left panel of Fig. 4 shows the observed velocity
field of ALESS 73.1 obtained by fitting the [Cii] line with a single Gaussian
(results do not change significantly by fitting with two Gaussians). The velocity field is
dominated by rotation. We fit the velocity field with a dynamical model assuming that the
ionised gas is circularly rotating in a thin disk, and that the disk surface mass density
distribution is exponential Σ(r) = Σ0e−
r/r0,
where r is
the distance from the disk centre and r0 is the scale radius. We neglect all
hydrodynamical effects, therefore the disk motion is entirely determined by the
gravitational potential. The model also includes the effect of beam smearing (for details,
see Gnerucci et al. 2010, 2011). The central panel of Fig. 4
shows our best fit (i.e. best-fit model convolved with the beam). The right panel of Fig.
4 shows the residuals of the model, which are very
small (less than 10 km s-1 in absolute value over most of the map). The bulk of the
velocity field is very well fitted by our simple rotating disk model, yielding a maximum
de-projected3 velocity vrot = 120 ± 10
km s-1, oriented
at a position angle 40° ±
1° north through east (Fig. 5 centre). The effective half-light radius obtained by fitting a Gaussian to our
model is 2.4 ± 0.2 kpc; this
is consistent with the 4.1 kpc diameter FWHM measured in the integrated [Cii]
image (see Sect. 3.1), and with the turn-over radius of
 kpc obtained by modelling the shape of the rotation curve using the multi-parameter fit
from Courteau (1997).
kpc obtained by modelling the shape of the rotation curve using the multi-parameter fit
from Courteau (1997).
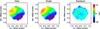 |
Fig. 4 [Cii] velocity field. The left panel presents the observed data, the central panel the best fit rotating disk model (see Sect. 3.2) and the right panel the residuals. The plus and cross mark the locations of the optical counterpart (Fig. 1) and the [Cii] peak flux (see Table 1), respectively. The observed motions of the [Cii] emission are consistent with a rotating disk model. |
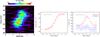 |
Fig. 5 Left: position–velocity diagram along the major axis of the disk model of Fig. 4. Contours show our best fit rotating disk model at 1%, 5%, 20%, 30%, 40%, 50%, 60%, 70%, 80%, 90%, and 95% of the peak flux. Centre: rotation curve extracted along the major axis with our best-fit model overplotted as a dashed line. Right: the variation in velocity dispersion as a function of radius in the disk. We estimate a typical Vrot/σint ~ 3.1 in the disk, showing that it is relatively turbulent. The rise towards the centre in the observed dispersion is an artifact resulting from the limited spatial resolution of the data. The synthesised beam size is shown as a horizontal black bar in the top left corner of the central and right panels. |
Figure 5 left shows a position velocity diagram extracted from the cube across the major kinematic axis of the galaxy with the model overplotted as contours. This highlights the rotation seen in the system, but also shows that the luminosity weighting of the [Cii] is not constant; the brightest [Cii] originates from the higher velocity material. Indeed, the ratio of [Cii] flux between −100 to −50 km s-1 and 50–100 km s-1 is 1.7 (see also Figs. 2 and 3). This non-uniformity suggests that the disk is either gas-loaded on one side, or preferentially illuminated on one side; we return to this in Sect. 3.4.
This flux asymmetry also illustrates the limits of our symmetric disk model. Significantly higher spatial resolution observations are needed to determine a reliable flux distribution within the disk (e.g. de Blok & Walter 2014). In order to test the stability of our disk model and check if the non-uniform flux distribution in the disk could bias our results, we also modelled the disk with two alternative models. First, we used the KINematic Molecular Simulation (KinMS) routines of Davis et al. (2013) The KinMS routine coupled to the Bayesian Monte Carlo Markov chain (MCMC) fitter KinMS_fit (Davis et al., in prep.) matches the brightness distribution of each pixel in the simulated and observed datacubes, rather than fitting Gaussians like the fitting code described above. Second, we used a simple arctan model (e.g. Swinbank et al. 2012a), where the observed emission is fitted assuming its rotation curve uses the form v(r) = 2π-1vasymarctan (r/rt), where vasym is the asymptotic rotational velocity and rt is the effective radius at which the rotation curve turns over. Both the alternative models, which have significantly different flux distributions from the model described above, obtain similar results. This provides confidence that our assumption of a rotating disk is a good (though not necessarily unique) representation of the observed [Cii] velocity field. However, as we barely spatially resolve the flux distribution within the disk, we cannot distinguish which flux distribution is more appropriate. We will therefore quote the full range of uncertainties from all three models in any parameters derived from these models (notably the dynamical mass, see Sect. 3.3.1).
To derive the (model-independent) intrinsic velocity dispersion of the disk at each pixel (corrected for the contribution of the velocity gradient across the synthesised beam), we follow Swinbank et al. (2012a). At each pixel in the velocity dispersion map, we measure the luminosity weighted velocity gradient across the fwhm of the beam at that pixel and subtract this from the velocity dispersion. In Fig. 5 right, we show both the observed and intrinsic one-dimensional velocity dispersion profile we derived, extracted along the major kinematic axis of the galaxy. This shows that the intrinsic velocity dispersion of the disk is σint = 40 ± 10 km s-1 (Fig. 5 right). The ratio of rotational-to-dispersion-support vrot/σint = 3.1 ± 1.0 implying that this is a highly turbulent rotating disk. Such values are a factor of ~three lower than local disk galaxies observed in CO (e.g. Downes & Solomon 1998), but comparable to other high-redshift disks with similar resolution data from the Hα line (e.g. Cresci et al. 2009; Genzel et al. 2011; Swinbank et al. 2012a). Carniani et al. (2013) reports a [Cii] v/σ ~ 1.5 in both the SMG and quasar in the BRI1202 system, while in a quadruple system observed in CO, Ivison et al. (2013) report v/σ ~ 6 in the two brightest systems, and v/σ < 1 in the faintest systems. We do warn that the optically thin [Cii] emitting gas is not necessarily tracing the same gas phase as the optically thick low-J CO, so the higher intrinsic dispersion could also be due to the fact that we are observing a wider range of gas components.
3.3. Constraints on dynamical and stellar mass
3.3.1. Dynamical mass
The circularly rotating disk model allows us to constrain the dynamical mass
 , where R is the radius at which
the maximal velocity vmax is measured, and G the gravitational
constant. To constrain the inclination, we use a MCMC with 105 realisations to investigate
the uncertainties on the disk model parameters (e.g. Carniani et al. 2013). Figure 6 displays
the results of the MCMC in terms Mdyn − i confidence
contours. The high quality of our data allows us to constrain the inclination
i =
53°±9. This implies Mdyn = 1.4 ± 0.5 ×
1010 M⊙ within
R = 4
kpc. The alternative rotating disk models described in Sect. 3.2 derive higher dynamical
masses: the best fit KinMS model has a lower i = 29° ± 4
and
, where R is the radius at which
the maximal velocity vmax is measured, and G the gravitational
constant. To constrain the inclination, we use a MCMC with 105 realisations to investigate
the uncertainties on the disk model parameters (e.g. Carniani et al. 2013). Figure 6 displays
the results of the MCMC in terms Mdyn − i confidence
contours. The high quality of our data allows us to constrain the inclination
i =
53°±9. This implies Mdyn = 1.4 ± 0.5 ×
1010 M⊙ within
R = 4
kpc. The alternative rotating disk models described in Sect. 3.2 derive higher dynamical
masses: the best fit KinMS model has a lower i = 29° ± 4
and  , while the
arctan model yields i =
50° ± 8, and Mdyn = 4.1 ± 0.9 ×
1010 M⊙. Given the
uncertainties in deriving an accurate flux distribution with our limited spatial
resolution, we quote the full range of uncertainties from all three models, and adopt
Mdyn = 3 ± 2 ×
1010 M⊙.
, while the
arctan model yields i =
50° ± 8, and Mdyn = 4.1 ± 0.9 ×
1010 M⊙. Given the
uncertainties in deriving an accurate flux distribution with our limited spatial
resolution, we quote the full range of uncertainties from all three models, and adopt
Mdyn = 3 ± 2 ×
1010 M⊙.
This dynamical mass is up to an order of magnitude lower than those previously reported for z ~ 2 SMGs on the basis of resolved and unresolved 12CO kinematics for SMGs (Tacconi et al. 2008; Swinbank et al. 2011; Bothwell et al. 2013).
3.3.2. Stellar mass and AGN contributions
The X-ray to radio spectral energy distribution (SED) of ALESS73.1 shows evidence of both AGN and stellar emission, with the bolometric AGN contribution constrained to 2–20% (Coppin et al. 2009; Gilli et al. 2014). While the AGN dominates the mid-infrared and X-ray, the starburst component is dominating in the FIR. The well-sampled rest-frame UV to near-infrared part of the SED has been claimed to be consistent with a reddened stellar population (e.g. Coppin et al. 2009; Simpson et al. 2014; Gilli et al. 2014; Wiklind et al. 2014). However, the SED can be equally well fit by a single power law from the U-band to 24-μm in the observed frame, as expected from a reddened AGN (Coppin et al. 2009; Wardlow et al. 2011; Simpson et al. 2014). While the relatively weak mid-infrared emission implies that the AGN in ALESS73.1 contributes at <20% of the bolometric emission (Coppin et al. 2009; Gilli et al. 2014), the AGN may still outshine the rest-frame UV/optical emission. Further evidence of such a dominating UV/optical AGN contribution includes: (i) The rest-frame UV spectrum presented by Coppin et al. (2009) which displays narrow Lyα and ~2000 km s-1 wide Nv λ1250 Å emission. This spectrum is reminiscent of that of the z = 2.88 radio galaxy 4C 24.28 (Röttgering et al. 1997), and is quite unlike the spectra of less-active star-forming galaxies (e.g. Shapley et al. 2003). A similar case to ALESS73.1 is SMM J02399−0136 (Ivison et al. 1998), where the AGN light outshines the rest-frame UV light from a vigorous starburst (Vernet & Cimatti 2001). (ii) The unresolved morphology in the CANDELS HST images of ALESS 73.1 (Fig. 1), indicating an upper limit on the size of the UV source of ≤ 2 kpc, which originally led to its identification as a high-redshift AGN by Fontanot et al. (2007). (iii) The high X-ray luminosity of the source, whose spectrum has been claimed to show a Compton-thick AGN (Gilli et al. 2011), and which is consistent with the observed Nv emission (Coppin et al. 2009).
The stellar mass derived from an SED fit should therefore be considered as a strict upper limit. Assuming a standard light-to-mass ratio used by Simpson et al. (2014), this implies M∗ < 7 × 10¹⁰ M⊙. As the unresolved HST F160W morphology suggests no significant host galaxy emission in addition to the bright AGN light, the actual stellar mass is most likely several times lower than this strict upper limit. Indeed, our limit on the dynamical mass, together with the gas mass of this system (MH2 = 1.6 ± 0.3 × 10¹⁰ M⊙; Coppin et al. 2010) imply M∗ ≲ 3.1 × 10¹⁰ M⊙. We note that the MH2 of Coppin et al. (2010) has been derived assuming a low αCO = 0.8 M⊙ (K km s-1 pc2)-1 conversion factor; adopting a higher αCO will decrease the limit on M∗. We return to this point in Sect. 4.1.
Alternatively, if the observed near-infrared emission would be dominated by stellar light, the rest-frame H-band magnitude MH = −25.61 implies a light-to-mass ratio of LH/M∗ ≳ 12. This is larger than the maximum light-to-mass ratio for all 77 ALESS SMGs, and 5× larger than the average (Simpson et al. 2014). We therefore exclude the possibility that the SED is dominated by stellar emission.
3.4. Stability of the disk
Not withstanding the variation in brightness within the disk, the regular rotation pattern of the [Cii] indicates that the gas it traces had sufficient time to settle in a bulk motion, despite the fact that the rotation period at the outer edge of the disk (trot ~ 200 Myr) is 16% of the age of the Universe at z = 4.8. At the same time, our compact and bright dust continuum detection implies that the inner part of this disk is undergoing a violent burst of star-formation with a rate of 1000 M⊙ yr-1 (e.g. Coppin et al. 2009; Gilli et al. 2014; Swinbank et al. 2014). Such high SFR require a high supply of cold gas. If the [Cii] emitting gas is in a regularly rotating pattern, could it still fuel the central starburst? To answer this question, we now examine if this disk is dynamically stable.
Toomre (1964) introduced a stability criterion for thin rotating disks against gravitational fragmentation. For gaseous disks (e.g. Wang & Silk 1994), this Toomre Q parameter can be expressed as Q(R) = σ(R)κ(R) /πGΣ(R) > 1, where σ is the gas velocity dispersion, κ the epicyclic frequency and Σ the gas mass surface density. All these parameters depend on the radius R from the centre of the rotating disk. If the disk contains both gas and stars which gravitationally interact with each other, the stability criterion becomes Q = (1 /Qstars + 1 /Qgas)-1 > 1 (Wang & Silk 1994). For ALESS 73.1, we cannot determine Qstars, but as argued above, we know that the gas dominates the mass budget. Hence, if Qgas is unstable, the total system will be unstable.
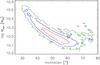 |
Fig. 6 Confidence contours for the dynamical mass and inclination of the rotating disk model from 105 trials of the MCMC. We estimate a typical mass of the galaxy of Mdyn = 1.4 ± 0.5 M⊙ within R = 4 kpc. |
Similar analysis have recently been carried out using spatially resolved (adaptive optics
assisted) IFU observations of the Hα emission in z ~ 1–2 galaxies, which
have demonstrated that the lowest Q (most unstable) regions of high-redshift galaxies
tend to lie in the outer parts of the disks (e.g. Swinbank
et al. 2012a; Genzel et al. 2014).
However, Hα
traces the ionised gas in the Hii regions, which is an indirect tracer to measure
the properties of the star-forming gas, rather than the cold molecular gas, which is a
direct tracer of the fuel for star formation. Although the [Cii] line is tracing
multiple gas phases (see Sect. 1), it has been argued that this line is a good SFR
indicator (e.g. Stacey et al. 1991, 2010; De Looze et al.
2011, 2014). Detailed observations of the
[Cii] kinematics are very difficult, especially in the local Universe, as the
line can only be observed with small single-dish space or airborne telescopes. However,
the [Cii], CO, and Hi velocity profiles do in general trace each other
rather well, although they can differ in some details (Boreiko & Betz 1991; Mookerjea et al.
2011; Braine et al. 2012). One example of
a more detailed study is the Herschel observations of the bright cluster
galaxy NGC 4696, where the Hα and [Cii] emission trace each other both
morphologically and kinematically (Fig. 6 of Mittal et al.
2011). Also at high-redshift, Gullberg et al. (in prep.) found that the CO and
[Cii] velocity profiles in a sample of 13 gravitationally lensed submm galaxies
are very similar. The most likely alternative if the [Cii] and CO are not tracing
the same bulk motion is that the lowest mass component (which in ALESS73.1 is the atomic
gas traced by [Cii], see Sect. 4.1) is outflowing compared to the higher mass
component. Although the S/N of the CO(2–1) data is low, we do not detect any velocity
shift (Fig. 2), nor do not find a significant outflow
component in [Cii] (see Sect. 4.2). We therefore assume that the [Cii]
emission traces well the kinematics of the underlying star-forming molecular gas
component, and derive the spatially resolved Toomre Q in the molecular gas at
each pixel within the galaxy. Assuming a flat rotation curve
( ), and
using the [Cii] luminosity distribution as a proxy to determine Σ, we calculate Q(x,y) =
), and
using the [Cii] luminosity distribution as a proxy to determine Σ, we calculate Q(x,y) =  σint(x,y)V(r)/πrGΣ where r is the radius from the
dynamical centre of each pixel, and V(r) is the rotational velocity at
radius r.
σint(x,y)V(r)/πrGΣ where r is the radius from the
dynamical centre of each pixel, and V(r) is the rotational velocity at
radius r.
Figure 7 shows the spatially resolved (beam smoothed) Toomre Q distribution, and an azimuthally averaged radial profile in ~1 kpc bins across the galaxy image. At all radii, Q is well below 1, suggesting that the disk is unstable throughout. The average Q over the disk is 0.58 ± 0.15, where the uncertainties include the variation in inclination, weighting of the velocity gradient correction, size of the disk, velocity field, and the removal size of of the central aperture. The increase in Q towards the inner regions is due to the high torque on the gas making it more difficult to collapse, as often seen in other high-redshift star-forming galaxies (e.g. Genzel et al. 2014).
We conclude that the rotation of the [Cii] emitting gas does not prevent it from collapsing and being possible/likely fuel for the violent starburst. Interestingly, the [Cii] emission appears to extend twice as far outwards than the dust continuum emission. This could be due to a radial variation in the fraction of star-forming gas traced by [Cii]. Alternatively, this difference could just reflect the mass distribution within the rotating disk, which our data cannot reliably determine. Observations at higher spatial resolution in [Cii], and of more uniform H2-tracers such as CO(1–0) or [CI] are needed to obtain a more reliable distribution of the star-forming gas.
4. Discussion
4.1. A compact, gas rich galaxy with a high star-formation rate
The Mdyn = 3 ± 2 × 10¹⁰ M⊙ (Sect. 3.3.1), is close to the cold gas mass MH2 = 1.6 ± 0.3 × 10¹⁰ M⊙, derived from the 12CO(2–1) detection reported by Coppin et al. (2010). Note that this MH2 was derived assuming a conservative (low) CO-to-H2 conversion factor αCO = 0.8 M⊙ (K km s-1 pc2)-1, so the actual MH2 may still be significantly higher. It is therefore clear that ALESS 73.1 is a very gas-rich galaxy. We can also obtain an estimate of the atomic gas mass Ma associated with the photodissociation regions using Eq. (1) from Hailey-Dunsheath et al. (2010). We also note that this assumes that the fraction of the H2 molecular gas which not traced by CO is negligible. Such an assumption is appropriate for ALESS73.1 as it has a moderately strong far-UV ionisation field G0 ~ 103 (De Breuck et al. 2011) and close to solar metallicity (see Sect. 4.3). Following De Breuck et al. (2011), we adopt a C+ abundance 1.4 × 10⁻⁴, a critical density ncrit = 2.7 × 103 cm-3 and a PDR surface temperature ~300 K. Using our more reliable ALMA [Cii] flux (Table 1), we derive Ma ≃ 4.7 ± 0.5 × 10⁹ M⊙. The combined atomic plus molecular gas mass is therefore ~2.1 × 10¹⁰ M⊙, implying a gas fraction fgas = 0.4–1.
We can also use the mass budget MH2 < Mdyn − Ma − M∗ to constrain αCO. Assuming no significant dark matter contribution and minimising M∗, this puts an upper limit αCO < 2.3 M⊙ (K km s-1 pc2)-1, i.e. < half of the Galactic value, but consistent with the range of αCO values found at high redshift (e.g. Ivison et al. 2011; Bothwell et al. 2013; Bolatto et al. 2013).
Despite being a relatively low-mass galaxy compared to dynamical masses for SMGs (Tacconi et al. 2008; Bothwell et al. 2013), or masses estimated from photometric modelling of the
SEDs of submillimetre-selected galaxies (e.g. Hainline et
al. 2011; Simpson et al. 2014), our bright
and unresolved dust continuum detection (Fig. 1)
suggests that the star-formation in ALESS 73.1 is coincident with the position of the AGN
host galaxy, and not in a nearby companion, as seen in several other SMGs (e.g. Ivison et al. 2008, 2012; Hodge et al. 2013). Using the
Herschel 70–500 μm limits, and three ALMA 872–1305 μm detections, Gilli et al. (2014) obtain L8−1000 μm =
5.9 ± 0.9 × 10¹²L⊙. Any
contributions to L8 −
1000 μm from an AGN are constrained to 2–20%
thanks to the sensitive Herschel limits (Coppin et al. 2009; Gilli et al. 2014).
Using almost the same data, but adding also the 20 cm detection of Miller et al. (2013), Swinbank et al.
(2014) find a very similar,  , showing that the
AGN contribution in also negligible in the radio. Assuming the Kennicutt (1998) relation, this L8−1000
μm implies a SFR of 1000 ± 150
M⊙ yr-1 for a Salpeter initial mass
function. This SFR can be compared to the empirical relations between SFR and the [CII]
and [NII] luminosities derived by De Looze et al.
(2014) and Zhao et al. (2013). Using
these, we find SFR = 450 ±
70 and 600
, showing that the
AGN contribution in also negligible in the radio. Assuming the Kennicutt (1998) relation, this L8−1000
μm implies a SFR of 1000 ± 150
M⊙ yr-1 for a Salpeter initial mass
function. This SFR can be compared to the empirical relations between SFR and the [CII]
and [NII] luminosities derived by De Looze et al.
(2014) and Zhao et al. (2013). Using
these, we find SFR = 450 ±
70 and 600 yr-1, respectively. This suggests
the dust continuum derived SFR may be overestimated by a factor of two, but given the
uncertain calibration of the [CII] and [NII] derived SFR at high redshift, we will adopt
SFR = 1000
M⊙ yr-1 in the remainder of this
paper.
yr-1, respectively. This suggests
the dust continuum derived SFR may be overestimated by a factor of two, but given the
uncertain calibration of the [CII] and [NII] derived SFR at high redshift, we will adopt
SFR = 1000
M⊙ yr-1 in the remainder of this
paper.
Combining this high SFR with the M∗ < 3.1 × 10¹⁰ M⊙ limit (Sect. 3.3.3) implies a specific star-formation rate sSFR > 80 Gyr-1 which is significantly higher than the bulk “normal” star-forming galaxies at the same redshift, i.e. almost an order of magnitude above the “main sequence” at the same redshift (e.g. González et al. 2010; Stark et al. 2013). This galaxy will thus double its stellar mass in ~12 Myr; we are thus likely observing ALESS73.1 during its first major burst of star formation. Generally, galaxies with sSFR well above the Main Sequence are identified as “starburst galaxies” in which star-formation is thought to occur in a violent mode as a consequence of galaxy merging or strong interactions. Nevertheless, the atomic and ionised gas in ALESS 73.1, as traced by [Cii], still shows rotationally supported disk kinematics (as seen in less active, normal main sequence galaxies) underlining the rapidity with which gas can reach such configurations, even in the most active systems.
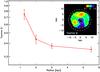 |
Fig. 7 Spatial variation in Toomre Q parameter within the gas disk in ALESS 73.1. The main panel shows the azimuthally integrated Q as marked with dashed lines in the inset. We see that Q declines with radius into the outer, gas-dominated, parts of the galaxy. This behaviour is similar to that inferred for less actively star-forming galaxies at z ~ 2 from Hα kinematic studies (Genzel et al. 2011; Swinbank et al. 2012a). However, the entire disk has Q < 1, meaning it is unstable throughout. |
4.2. Limits on outflowing gas
The [Cii] profile in Fig. 2 shows no obvious indication of an underlying broad component indicative of an outflow as seen in some other high-z systems mapped in [Cii] (Maiolino et al. 2012). In order to set an upper limit on this outflow, we fitted the ALMA spectrum by forcing an additional broad component with a FWHM > 500 km s-1. This additional component is not statistically significant and is not required by the fit, but we can use it to set an upper limit of <1.3 Jy km s-1 on the presence of an outflow. Using the same assumptions as in Sect. 4.1, this translates into an upper limit on the atomic gas mass in an outflow of <9 × 10⁸ M⊙. Following Cano-Díaz et al. (2012), we approximate the outflow as gas with constant velocity uniformly distributed within a sphere of radius R. As we cannot determine R, we assume R ~ 1 kpc as in massive outflows observed in other galaxies at both high redshift (e.g. Maiolino et al. 2012; Cano-Díaz et al. 2012; Weiß et al. 2012; Carilli et al. 2013), and low redshift (e.g. Feruglio et al. 2010, 2013; Sturm et al. 2011; Aalto et al. 2012; Cicone et al. 2012, 2014; Veilleux et al. 2013). We can then constrain the outflow rate Ṁ = 3 vMoutflow/Routflow (Maiolino et al. 2012) to be ≲1400 M⊙ yr-1. This is a rather loose upper limit, but it does show that any outflow must be comparable or less than the star-formation rate, i.e. even if an outflow is present, it is unlikely to dominate the evolution of the gas reservoir.
4.3. Metallicity
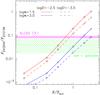 |
Fig. 8 Observed [Nii]/[Cii] flux ratio compared with model predictions for different density n and ionisation parameter U (see Nagao et al. 2012). The green hatched range denotes the observed range for low-redshift galaxies. The pink hatched range shows the observed ALMA ratio for ALESS 73.1 with its uncertainty. The red and blue lines show Cloudy model results as a function of Zgas with log nH [ II ] = 1.5 and 3.0 respectively, while solid and dashed lines denote the models with log UH [ II ] −2.5 and −3.5, respectively. We conclude that the metallicity in this gas rich disk is likely to be close to solar. |
Nagao et al. (2012) used the [Nii] 205 μm/[Cii] 158 μm ratio in ALESS73.1 as a powerful new probe of the metallicity in the ISM. In particular, this line ratio is free of extinction effects which often complicate determinations from optical and near-infrared line ratios. The observed ratio used by Nagao et al. (2012) was rather uncertain due to the velocity offset seen with respect to the narrow-bandwidth APEX spectrum. Using the new [Cii] spectroscopy, we can now constrain this ratio to [Nii]/[Cii] = 0.085 ± 0.015. Figure 8 shows that this implies Z = 0.6–3 Z⊙, where the uncertainty in dominated by the models rather than the measurement uncertainties. Our new ALMA [Cii] data therefore strengthens the conclusion of Nagao et al. (2012) that ALESS 73.1 already has gas with a metallicity close to solar, when the age of the Universe was a mere 1.2 Gyr. Such highly enriched gas has been detected before in broad-line regions surrounding AGNs (e.g. Hamann & Ferland 1993), but our ALMA observations now suggest that the highly enriched material may already be spread out over kpc scales.
An alternative explanation for the relatively large [Nii]/[Cii] ratio is the “truncation” of the PDR. This has been reported by Nakajima et al. (2013) using optical observations of high-z Lymanα emitters. Under the very strong radiation field due to the extreme star-formation, the relative volume ratio of Hii regions and PDRs could change systematically in the sense that the relative PDR contribution becomes smaller for more active star-forming galaxies. This will reduce the [Cii] flux, while the [Nii] as a uniform Hii tracer is not affected. The net result is then an increase in the [Nii]/[Cii] flux ratio for a given metallicity (e.g. Croxall et al. 2012; Decarli et al. 2014). As such, subsolar metallicities are still possible in ALESS73.1. Observations of other fine structure lines such as [Nii] 122 μm, [Oi] 144 μm or [CI] are needed to determine the contributions from Hii and PDRs, and hence derive a more accurate determination of the metallicity.
5. Conclusions
Using ALMA, we have spatially resolved the [Cii] 158 μm emission in the z = 4.7555 SMG ALESS 73.1. The high S/N data cube shows that the [Cii] emitting gas extends twice as far out as the dust continuum and exhibits with clear kinematical signatures of rotation. We demonstrate that these kinematical signatures are well-described by a rotating disk with a disk size ~2.4 kpc and a maximum deprojected rotation velocity of vrot = 120 ± 10 km s-1. The disk is highly turbulent with a vrot/σv ~ 3.1, and a Toomre Q parameter <1 throughout the disk, implying it is unstable. Using this model we constrain the dynamical mass of this galaxy to be 3 ± 2 × 10¹⁰ M⊙, which is close to the M(H2) derived from CO(2–1) (Coppin et al. 2010), and requires αCO < 2.3 (K km s-1 pc2)-1. Combined with the atomic mass Ma = 4.7 ± 0.5 × 10⁹ M⊙, our dynamical mass constrains the stellar mass to <3.1 × 10¹⁰ M⊙. Such low stellar mass is remarkable for an isolated galaxy with a SFR = 1000 M⊙ yr-1, and suggests we are observing its first major burst of star formation. Interestingly, our revised integrated [Nii] 205 μm/[Cii] 158 μm ratio suggest that the gas already has close to solar metallicity. However, one should keep in mind that [Cii] may have significant contributions from non-PDR gas, which may have an impact on the reliability of [Nii]/[Cii] as metallicity tracer and of [Cii] as a tracer of the star-forming gas (De Looze et al. 2011). Spatially resolved observations of pure H2 tracers such as the Jupper ≤ 2 CO lines or the [CI] lines (e.g. Papadopoulos et al. 2004) would be needed to provide a more reliable determination of both the metallicity and the full extent of the star-forming gas reservoir in ALESS73.1.
The ALMA Cycle 0 observations presented here, while still limited in spatial resolution but not in S/N, illustrate the great potential of ALMA to extend dynamical analysis tools out to the epoch when galaxies had their first major burst of star-formation. Such observations of atomic (or molecular) lines can be the only way to probe the dynamics of even the highest redshift galaxies, which can be obscured or barely resolved at optical/near-infrared wavelengths. The final ALMA array will increase its spatial resolution by an order of magnitude, allowing us to regularly probe the scales of star-forming clouds, which have thus far only been seen in studies of strongly lensed galaxies (e.g. Swinbank et al. 2010).
As the real [Cii] frequency turned out to be offset by 120 MHz from the expected frequency predicted from the previous APEX observations of De Breuck et al. (2011), the line was not well centred in the overlap region between the basebands. However, in hindsight, this overlap was not required, so this does not affect our data quality.
APEX is a collaboration between the Max-Planck-Institut fur Radioastronomie, the European Southern Observatory, and the Onsala Space Observatory.
Assuming i = 53°, see Sect. 3.3.1.
Acknowledgments
We thank the anonymous referee for a very thorough reading of the manuscript, and numerous comments which have significantly improved the quality of the paper. We also thank Padelis Papadopoulos, Maud Galametz, Ilse De Looze, and Frank Israel for helpful suggestions, and the ALMA and APEX staff for their hard work behind the scenes to make these observations possible, and the ALMA Regional Centre staff to provide virtually science-ready data products. I.R.S. acknowledges support from STFC (ST/I001573/1), the ERC Advanced Investigator programme DUSTYGAL 321334 and a Royal Society/Wolfson Merit Award. A.M.S. gratefully acknowledges an STFC Advanced Fellowship through grant number ST/H005234/1. The research leading to these results has received funding from the European Community’s Seventh Framework Programme (/FP7/2007-2013/) under grant agreement No. 229517. T.N. is financially supported by JSPS (grant nos. 23654068 and 25707010). This paper makes use of the following ALMA data: ADS/JAO.ALMA#2011.0.00124.S. ALMA is a partnership of ESO (representing its member states), NSF (USA) and NINS (Japan), together with NRC (Canada) and NSC and ASIAA (Taiwan), in cooperation with the Republic of Chile. The Joint ALMA Observatory is operated by ESO, AUI/NRAO and NAOJ. This work is based on observations taken by the CANDELS Multi-Cycle Treasury Program with the NASA/ESA HST, which is operated by the Association of Universities for Research in Astronomy, Inc., under NASA contract NAS5-26555.
References
- Aalto, S., Garcia-Burillo, S., Muller, S., et al. 2012, A&A, 537, A44 [NASA ADS] [CrossRef] [EDP Sciences] [Google Scholar]
- Adelman-McCarthy, J. K., Agüeros, M. A., Allam, S. S., et al. 2008, ApJS, 175, 297 [NASA ADS] [CrossRef] [Google Scholar]
- Alexander, D. M., Smail, I., Bauer, F. E., et al. 2005, Nature, 434, 738 [NASA ADS] [CrossRef] [PubMed] [Google Scholar]
- Appleton, P. N., Guillard, P., Boulanger, F., et al. 2013, ApJ, 777, 66 [NASA ADS] [CrossRef] [Google Scholar]
- Beirão, P., Armus, L., Appleton, P. N., et al. 2010, A&A, 518, L60 [NASA ADS] [CrossRef] [EDP Sciences] [Google Scholar]
- Beirão, P., Armus, L., Helou, G., et al. 2012, ApJ, 751, 144 [NASA ADS] [CrossRef] [Google Scholar]
- Biggs, A. D., Ivison, R. J., Ibar, E., et al. 2011, MNRAS, 413, 2314 [Google Scholar]
- Bolatto, A. D., Wolfire, M., & Leroy, A. K. 2013, ARA&A, 51, 207 [Google Scholar]
- Boreiko, R. T., & Betz, A. L. 1991, ApJ, 380, L27 [NASA ADS] [CrossRef] [Google Scholar]
- Bothwell, M. S., Smail, I., Chapman, S. C., et al. 2013, MNRAS, 429, 3047 [NASA ADS] [CrossRef] [Google Scholar]
- Braine, J., Gratier, P., Kramer, C., et al. 2012, A&A, 544, A55 [NASA ADS] [CrossRef] [EDP Sciences] [Google Scholar]
- Cano-Díaz, M., Maiolino, R., Marconi, A., et al. 2012, A&A, 537, L8 [NASA ADS] [CrossRef] [EDP Sciences] [Google Scholar]
- Carilli, C. L., & Walter, F. 2013, ARA&A, 51, 105 [NASA ADS] [CrossRef] [EDP Sciences] [Google Scholar]
- Carilli, C. L., Riechers, D., Walter, F., et al. 2013, ApJ, 763, 120 [NASA ADS] [CrossRef] [Google Scholar]
- Carniani, S., Marconi, A., Biggs, A., et al. 2013, A&A, 559, A29 [NASA ADS] [CrossRef] [EDP Sciences] [Google Scholar]
- Cicone, C., Feruglio, C., Maiolino, R., et al. 2012, A&A, 543, A99 [NASA ADS] [CrossRef] [EDP Sciences] [Google Scholar]
- Cicone, C., Maiolino, R., Sturm, E., et al. 2014, A&A, 562, A21 [NASA ADS] [CrossRef] [EDP Sciences] [Google Scholar]
- Coppin, K., Chapin, E. L., Mortier, A. M. J., et al. 2006, MNRAS, 372, 1621 [NASA ADS] [CrossRef] [Google Scholar]
- Coppin, K. E. K., Smail, Ian,Alexander, D. M., et al. 2009, MNRAS, 395, 1905 [NASA ADS] [CrossRef] [Google Scholar]
- Coppin, K. E. K., Chapman, S. C., Smail, I., et al. 2010, MNRAS, 407, L103 [NASA ADS] [CrossRef] [Google Scholar]
- Cormier, D., Madden, S. C., Hony, S., et al. 2010, A&A, 518, L57 [NASA ADS] [CrossRef] [EDP Sciences] [Google Scholar]
- Courteau, S. 1997, AJ, 114, 2402 [NASA ADS] [CrossRef] [Google Scholar]
- Cox, P., Krips, M., Neri, R., et al. 2011, ApJ, 740, 63 [NASA ADS] [CrossRef] [Google Scholar]
- Cresci, G., Hicks, E. K. S., Genzel, R., et al. 2009, ApJ, 697, 115 [NASA ADS] [CrossRef] [Google Scholar]
- Croxall, K. V., Smith, J. D., Wolfire, M. G., et al. 2012, ApJ, 747, 81 [NASA ADS] [CrossRef] [Google Scholar]
- Daddi, E., Dannerbauer, H., Stern, D., et al. 2009, ApJ, 694, 1517 [Google Scholar]
- Davis, T. A., Alatalo, K., Bureau, M., et al. 2013, MNRAS, 429, 534 [NASA ADS] [CrossRef] [Google Scholar]
- de Blok, W. J. G., & Walter, F. 2014, AJ, 147, 96 [NASA ADS] [CrossRef] [Google Scholar]
- De Breuck, C., Maiolino, R., Caselli, P., et al. 2011, A&A, 530, L8 [NASA ADS] [CrossRef] [EDP Sciences] [Google Scholar]
- Decarli, R., Walter, F., Carilli, C., et al. 2014, ApJ, 782, L17 [NASA ADS] [CrossRef] [Google Scholar]
- De Looze, I., Baes, M., Bendo, G. J., Cortese, L., & Fritz, J. 2011, MNRAS, 416, 2712 [Google Scholar]
- De Looze, I., Cormier, D., Lebouteiller, V., et al. 2014, A&A, submitted [arXiv:1402.4075] [Google Scholar]
- Díaz-Santos, T., Armus, L., Charmandaris, V., et al. 2013, ApJ, 774, 68 [NASA ADS] [CrossRef] [Google Scholar]
- Downes, D., & Solomon, P. M. 1998, ApJ, 507, 615 [NASA ADS] [CrossRef] [Google Scholar]
- Ferkinhoff, C., Brisbin, D., Parshley, S., et al. 2014, ApJ, 780, 142 [NASA ADS] [CrossRef] [Google Scholar]
- Feruglio, C., Maiolino, R., Piconcelli, E., et al. 2010, A&A, 518, L155 [NASA ADS] [CrossRef] [EDP Sciences] [Google Scholar]
- Feruglio, C., Fiore, F., Maiolino, R., et al. 2013, A&A, 549, A51 [NASA ADS] [CrossRef] [EDP Sciences] [Google Scholar]
- Fontanot, F., Cristiani, S., Monaco, P., et al. 2007, A&A, 461, 39 [NASA ADS] [CrossRef] [EDP Sciences] [Google Scholar]
- Gallerani, S., Neri, R., Maiolino, R., et al. 2012, A&A, 543, A114 [NASA ADS] [CrossRef] [EDP Sciences] [Google Scholar]
- Gawiser, E., van Dokkum, P. G., Herrera, D., et al. 2006, ApJS, 162, 1 [NASA ADS] [CrossRef] [Google Scholar]
- Genzel, R., Newman, S., Jones, T., et al. 2011, ApJ, 733, 101 [NASA ADS] [CrossRef] [Google Scholar]
- Genzel, R., Förster Schreiber, N. M., Lang, P., et al. 2014, ApJ, 785, 75 [NASA ADS] [CrossRef] [Google Scholar]
- Georgantopoulos, I., Rovilos, E., & Comastri, A. 2011, A&A, 526, A46 [NASA ADS] [CrossRef] [EDP Sciences] [Google Scholar]
- Gilli, R., Su, C., Norman, C., et al. 2011, ApJ, 730, L28 [NASA ADS] [CrossRef] [Google Scholar]
- Gilli, R., Norman, C., Vignali, C., et al. 2014, A&A, 562, A67 [NASA ADS] [CrossRef] [EDP Sciences] [Google Scholar]
- Gnerucci, A., Marconi, A., Capetti, A., Axon, D. J., & Robinson, A. 2010, A&A, 511, A19 [NASA ADS] [CrossRef] [EDP Sciences] [Google Scholar]
- Gnerucci, A., Marconi, A., Cresci, G., et al. 2011, A&A, 533, A124 [NASA ADS] [CrossRef] [EDP Sciences] [Google Scholar]
- González, V., Labbé, I., Bouwens, R. J., et al. 2010, ApJ, 713, 115 [NASA ADS] [CrossRef] [Google Scholar]
- Grogin, N. A., Kocevski, D. D., Faber, S. M., et al. 2011, ApJS, 197, 35 [NASA ADS] [CrossRef] [Google Scholar]
- Guo, Y., Ferguson, H. C., Giavalisco, M., et al. 2013, ApJS, 207, 24 [NASA ADS] [CrossRef] [Google Scholar]
- Hailey-Dunsheath, S., Nikola, T., Stacey, G. J., et al. 2010, ApJ, 714, L162 [NASA ADS] [CrossRef] [Google Scholar]
- Hainline, L. J., Blain, A. W., Smail, I., et al. 2011, ApJ, 740, 96 [NASA ADS] [CrossRef] [Google Scholar]
- Hamann, F., & Ferland, G. 1993, ApJ, 418, 11 [NASA ADS] [CrossRef] [Google Scholar]
- Hodge, J. A., Karim, A., Smail, I., et al. 2013, ApJ, 768, 91 [NASA ADS] [CrossRef] [Google Scholar]
- Iono, D., Yun, M. S., Elvis, M., et al. 2006, ApJ, 645, L97 [NASA ADS] [CrossRef] [Google Scholar]
- Ivison, R. J., Smail, I., Le Borgne, J.-F., et al. 1998, MNRAS, 298, 583 [NASA ADS] [CrossRef] [Google Scholar]
- Ivison, R. J., Morrison, G. E., Biggs, A. D., et al. 2008, MNRAS, 390, 1117 [NASA ADS] [CrossRef] [Google Scholar]
- Ivison, R. J., Swinbank, A. M., Swinyard, B., et al. 2010, A&A, 518, L35 [NASA ADS] [CrossRef] [EDP Sciences] [Google Scholar]
- Ivison, R. J., Papadopoulos, P. P., Smail, I., et al. 2011, MNRAS, 412, 1913 [NASA ADS] [CrossRef] [Google Scholar]
- Ivison, R. J., Smail, I., Amblard, A., et al. 2012, MNRAS, 425, 1320 [NASA ADS] [CrossRef] [Google Scholar]
- Ivison, R. J., Swinbank, A. M., Smail, I., et al. 2013, ApJ, 772, 137 [NASA ADS] [CrossRef] [Google Scholar]
- Kaufman, M., Wolfire, M., Hollenbach, D., & Luhman, M. 1999, ApJ, 527, 795 [NASA ADS] [CrossRef] [Google Scholar]
- Kennicutt, R. C., Jr. 1998, ApJ, 498, 541 [NASA ADS] [CrossRef] [Google Scholar]
- Koekemoer, A. M., Faber, S. M., Ferguson, H. C., et al. 2011, ApJS, 197, 36 [NASA ADS] [CrossRef] [Google Scholar]
- Luhman, M. L., Satyapal, S., Fischer, J., et al. 1998, ApJ, 504, L11 [NASA ADS] [CrossRef] [Google Scholar]
- Madden, S., Poglitsch, A., Geis, N., Stacey, G., & Townes, C. 1997, ApJ, 483, 200 [NASA ADS] [CrossRef] [MathSciNet] [Google Scholar]
- Maiolino, R., Cox, P., Caselli, P., et al. 2005, A&A, 440, L51 [NASA ADS] [CrossRef] [EDP Sciences] [Google Scholar]
- Maiolino, R., Caselli, P., Nagao, T., et al. 2009, A&A, 500, L1 [NASA ADS] [CrossRef] [EDP Sciences] [Google Scholar]
- Maiolino, R., Gallerani, S., Neri, R., et al. 2012, MNRAS, 425, L66 [NASA ADS] [CrossRef] [Google Scholar]
- Miller, N. A., Bonzini, M., Fomalont, E. B., et al. 2013, ApJS, 205, 13 [NASA ADS] [CrossRef] [Google Scholar]
- Mittal, R., O’Dea, C. P., Ferland, G., et al. 2011, MNRAS, 418, 2386 [NASA ADS] [CrossRef] [Google Scholar]
- Mookerjea, B., Kramer, C., Buchbender, C., et al. 2011, A&A, 532, A152 [NASA ADS] [CrossRef] [EDP Sciences] [Google Scholar]
- Nagao, T., Maiolino, R., De Breuck, C., et al. 2012, A&A, 542, L34 [NASA ADS] [CrossRef] [EDP Sciences] [Google Scholar]
- Nakajima, K., Ouchi, M., Shimasaku, K., et al. 2013, ApJ, 769, 3 [NASA ADS] [CrossRef] [Google Scholar]
- Neri, R., Downes, D., Cox, P., & Walter, F. 2014, A&A, 562, A35 [NASA ADS] [CrossRef] [EDP Sciences] [Google Scholar]
- Papadopoulos, P. P., Thi, W.-F., & Viti, S. 2004, MNRAS, 351, 147 [NASA ADS] [CrossRef] [Google Scholar]
- Parkin, T. J., Wilson, C. D., Schirm, M. R. P., et al. 2013, ApJ, 776, 65 [NASA ADS] [CrossRef] [Google Scholar]
- Pentericci, L., Röttgering, H. J. A., Miley, G. K., et al. 1999, A&A, 341, 329 [NASA ADS] [Google Scholar]
- Petry, D., & CASA Development Team 2012, Astronomical Data Analysis Software and Systems XXI, 461, 849 [Google Scholar]
- Rawle, T. D., Egami, E., Bussmann, R. S., et al. 2014, ApJ, 783, 59 [NASA ADS] [CrossRef] [Google Scholar]
- Riechers, D. A., Bradford, C. M., Clements, D. L., et al. 2013, Nature, 496, 329 [Google Scholar]
- Röttgering, H. J. A., van Ojik, R., Miley, G. K., et al. 1997, A&A, 326, 505 [NASA ADS] [Google Scholar]
- Seymour, N., Stern, D., De Breuck, C., et al. 2007, ApJS, 171, 353 [NASA ADS] [CrossRef] [Google Scholar]
- Shapley, A. E., Steidel, C. C., Pettini, M., & Adelberger, K. L. 2003, ApJ, 588, 65 [NASA ADS] [CrossRef] [Google Scholar]
- Simpson, J., Swinbank, M., Smail, I., et al. 2013, ApJ, submitted [arXiv:1310.6363] [Google Scholar]
- Stacey, G. J., Geis, N., Genzel, R., et al. 1991, ApJ, 373, 423 [NASA ADS] [CrossRef] [Google Scholar]
- Stacey, G., Hailey-Dunsheath, S., Ferkinhoff, C., et al. 2010, ApJ, 724, 957 [NASA ADS] [CrossRef] [Google Scholar]
- Stark, D. P., Schenker, M. A., Ellis, R., et al. 2013, ApJ, 763, 129 [NASA ADS] [CrossRef] [Google Scholar]
- Sturm, E., González-Alfonso, E., Veilleux, S., et al. 2011, ApJ, 733, L16 [NASA ADS] [CrossRef] [Google Scholar]
- Swinbank, A. M., Smail, I., Longmore, S., et al. 2010, Nature, 464, 733 [Google Scholar]
- Swinbank, A. M., Papadopoulos, P. P., Cox, P., et al. 2011, ApJ, 742, 11 [NASA ADS] [CrossRef] [Google Scholar]
- Swinbank, A. M., Smail, I., Sobral, D., et al. 2012a, ApJ, 760, 130 [NASA ADS] [CrossRef] [Google Scholar]
- Swinbank, A. M., Karim, A., Smail, I., et al. 2012b, MNRAS, 427, 1066 [NASA ADS] [CrossRef] [Google Scholar]
- Swinbank, A. M., Simpson, J. M., Smail, I., et al. 2014, MNRAS, 438, 1267 [Google Scholar]
- Tacconi, L. J., Genzel, R., Smail, I., et al. 2008, ApJ, 680, 246 [NASA ADS] [CrossRef] [PubMed] [Google Scholar]
- Toomre, A. 1964, ApJ, 139, 1217 [NASA ADS] [CrossRef] [Google Scholar]
- Vanzella, E., Cristiani, S., Dickinson, M., et al. 2006, A&A, 454, 423 [NASA ADS] [CrossRef] [EDP Sciences] [Google Scholar]
- Vassilev, V., Meledin, D., Lapkin, I., et al. 2008, A&A, 490, 1157 [NASA ADS] [CrossRef] [EDP Sciences] [Google Scholar]
- Veilleux, S., Meléndez, M., Sturm, E., et al. 2013, ApJ, 776, 27 [NASA ADS] [CrossRef] [Google Scholar]
- Venemans, B. P., McMahon, R. G., Walter, F., et al. 2012, ApJ, 751, L25 [Google Scholar]
- Vernet, J., & Cimatti, A. 2001, A&A, 380, 409 [NASA ADS] [CrossRef] [EDP Sciences] [Google Scholar]
- Wagg, J., Carilli, C. L., Wilner, D. J., et al. 2010, A&A, 519, L1 [NASA ADS] [CrossRef] [EDP Sciences] [Google Scholar]
- Wagg, J., Wiklind, T., Carilli, C. L., et al. 2012, ApJ, 752, L30 [NASA ADS] [CrossRef] [Google Scholar]
- Walter, F., Riechers, D., Cox, P., et al. 2009, Nature, 457, 699 [NASA ADS] [CrossRef] [PubMed] [Google Scholar]
- Wang, B., & Silk, J. 1994, ApJ, 427, 759 [NASA ADS] [CrossRef] [Google Scholar]
- Wang, R., Wagg, J., Carilli, C. L., et al. 2013a, ApJ, 773, 44 [NASA ADS] [CrossRef] [Google Scholar]
- Wang, S. X., Brandt, W. N., Luo, B., et al. 2013b, ApJ, 778, 179 [NASA ADS] [CrossRef] [Google Scholar]
- Wardlow, J. L., Smail, I., Coppin, K. E. K., et al. 2011, MNRAS, 415, 1479 [NASA ADS] [CrossRef] [Google Scholar]
- Weiß, A., Kovács, A., Coppin, K., et al. 2009, ApJ, 707, 1201 [NASA ADS] [CrossRef] [Google Scholar]
- Weiß, A., Walter, F., Downes, D., et al. 2012, ApJ, 753, 102 [NASA ADS] [CrossRef] [Google Scholar]
- Weiß, A., De Breuck, C., Marrone, D. P., et al. 2013, ApJ, 767, 88 [NASA ADS] [CrossRef] [Google Scholar]
- Wiklind, T., Conselice, C., Dahlen, T., et al. 2014, ApJ, 785, 111 [NASA ADS] [CrossRef] [Google Scholar]
- Willott, C. J., Omont, A., & Bergeron, J. 2013, ApJ, 770, 13 [NASA ADS] [CrossRef] [Google Scholar]
- Zhao, Y., Lu, N., Xu, C. K., et al. 2013, ApJ, 765, L13 [NASA ADS] [CrossRef] [Google Scholar]
All Tables
All Figures
|
Fig. 1 Continuum-subtracted, velocity-integrated [Cii] emission (natural weighting) overplotted on a HST CANDELS YJH image (Grogin et al. 2011; Koekemoer et al. 2011). The HST emission traced by is dominated by an unresolved point source, consistent with AGN-dominated rest-frame UV-optical emission, with no clear host galaxy visible. Both the [Cii], which is spatially resolved in our ALMA observations at ~0.̋6 resolution, and the spatially-unresolved continuum emission (see Fig. 3) peak on the position of the optical/near-infrared source within 0.̋2, indicating that the AGN lies close to the centre of the FIR emission. The contour levels are −3, 3, 5, 10, 15, 20, 25, and 30σ, where σ = 7.5 mJy km s-1. |
| In the text | |
|
Fig. 2 Comparison of the spatially integrated [Cii], [Nii], and 12CO(2–1) velocity profiles. A scaled version of the ALMA velocity profile is reproduced as a red dotted line in the middle and bottom panels to show that the other lines are consistent with it. The top panel shows the APEX [Cii] non-detection (blue dashed histogram) is consistent within the uncertainties with the ALMA detection. |
| In the text | |
|
Fig. 3 Channel maps (spacing 24.85 km s-1) of [Cii] overlaid on the line-free
318.13 + 330.34 GHz dust continuum image. Contour levels start at 3σ, where
σ =
0.7 mJy/beam, and increase by
|
| In the text | |
|
Fig. 4 [Cii] velocity field. The left panel presents the observed data, the central panel the best fit rotating disk model (see Sect. 3.2) and the right panel the residuals. The plus and cross mark the locations of the optical counterpart (Fig. 1) and the [Cii] peak flux (see Table 1), respectively. The observed motions of the [Cii] emission are consistent with a rotating disk model. |
| In the text | |
|
Fig. 5 Left: position–velocity diagram along the major axis of the disk model of Fig. 4. Contours show our best fit rotating disk model at 1%, 5%, 20%, 30%, 40%, 50%, 60%, 70%, 80%, 90%, and 95% of the peak flux. Centre: rotation curve extracted along the major axis with our best-fit model overplotted as a dashed line. Right: the variation in velocity dispersion as a function of radius in the disk. We estimate a typical Vrot/σint ~ 3.1 in the disk, showing that it is relatively turbulent. The rise towards the centre in the observed dispersion is an artifact resulting from the limited spatial resolution of the data. The synthesised beam size is shown as a horizontal black bar in the top left corner of the central and right panels. |
| In the text | |
|
Fig. 6 Confidence contours for the dynamical mass and inclination of the rotating disk model from 105 trials of the MCMC. We estimate a typical mass of the galaxy of Mdyn = 1.4 ± 0.5 M⊙ within R = 4 kpc. |
| In the text | |
|
Fig. 7 Spatial variation in Toomre Q parameter within the gas disk in ALESS 73.1. The main panel shows the azimuthally integrated Q as marked with dashed lines in the inset. We see that Q declines with radius into the outer, gas-dominated, parts of the galaxy. This behaviour is similar to that inferred for less actively star-forming galaxies at z ~ 2 from Hα kinematic studies (Genzel et al. 2011; Swinbank et al. 2012a). However, the entire disk has Q < 1, meaning it is unstable throughout. |
| In the text | |
|
Fig. 8 Observed [Nii]/[Cii] flux ratio compared with model predictions for different density n and ionisation parameter U (see Nagao et al. 2012). The green hatched range denotes the observed range for low-redshift galaxies. The pink hatched range shows the observed ALMA ratio for ALESS 73.1 with its uncertainty. The red and blue lines show Cloudy model results as a function of Zgas with log nH [ II ] = 1.5 and 3.0 respectively, while solid and dashed lines denote the models with log UH [ II ] −2.5 and −3.5, respectively. We conclude that the metallicity in this gas rich disk is likely to be close to solar. |
| In the text | |
Current usage metrics show cumulative count of Article Views (full-text article views including HTML views, PDF and ePub downloads, according to the available data) and Abstracts Views on Vision4Press platform.
Data correspond to usage on the plateform after 2015. The current usage metrics is available 48-96 hours after online publication and is updated daily on week days.
Initial download of the metrics may take a while.