Fig. 5
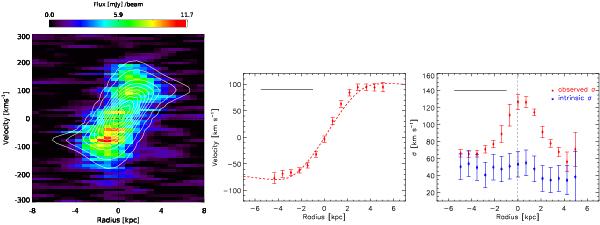
Left: position–velocity diagram along the major axis of the disk model of Fig. 4. Contours show our best fit rotating disk model at 1%, 5%, 20%, 30%, 40%, 50%, 60%, 70%, 80%, 90%, and 95% of the peak flux. Centre: rotation curve extracted along the major axis with our best-fit model overplotted as a dashed line. Right: the variation in velocity dispersion as a function of radius in the disk. We estimate a typical Vrot/σint ~ 3.1 in the disk, showing that it is relatively turbulent. The rise towards the centre in the observed dispersion is an artifact resulting from the limited spatial resolution of the data. The synthesised beam size is shown as a horizontal black bar in the top left corner of the central and right panels.
Current usage metrics show cumulative count of Article Views (full-text article views including HTML views, PDF and ePub downloads, according to the available data) and Abstracts Views on Vision4Press platform.
Data correspond to usage on the plateform after 2015. The current usage metrics is available 48-96 hours after online publication and is updated daily on week days.
Initial download of the metrics may take a while.