Fig. 2
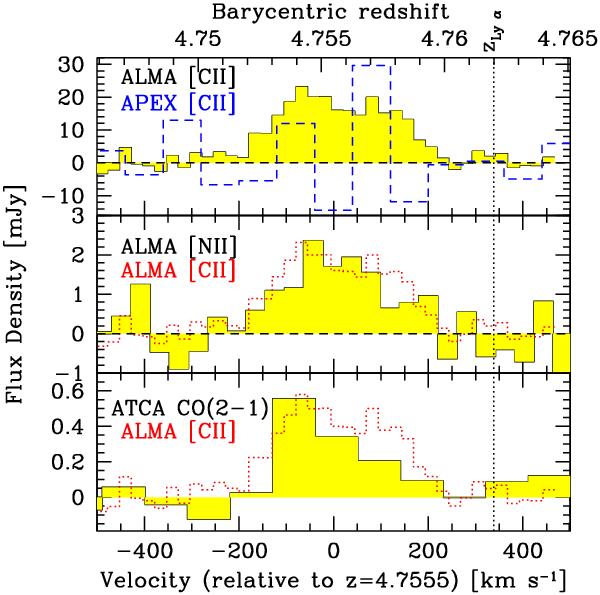
Comparison of the spatially integrated [Cii], [Nii], and 12CO(2–1) velocity profiles. A scaled version of the ALMA velocity profile is reproduced as a red dotted line in the middle and bottom panels to show that the other lines are consistent with it. The top panel shows the APEX [Cii] non-detection (blue dashed histogram) is consistent within the uncertainties with the ALMA detection.
Current usage metrics show cumulative count of Article Views (full-text article views including HTML views, PDF and ePub downloads, according to the available data) and Abstracts Views on Vision4Press platform.
Data correspond to usage on the plateform after 2015. The current usage metrics is available 48-96 hours after online publication and is updated daily on week days.
Initial download of the metrics may take a while.