Fig. 4
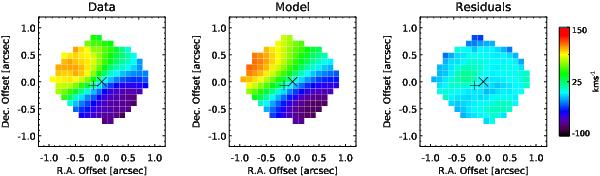
[Cii] velocity field. The left panel presents the observed data, the central panel the best fit rotating disk model (see Sect. 3.2) and the right panel the residuals. The plus and cross mark the locations of the optical counterpart (Fig. 1) and the [Cii] peak flux (see Table 1), respectively. The observed motions of the [Cii] emission are consistent with a rotating disk model.
Current usage metrics show cumulative count of Article Views (full-text article views including HTML views, PDF and ePub downloads, according to the available data) and Abstracts Views on Vision4Press platform.
Data correspond to usage on the plateform after 2015. The current usage metrics is available 48-96 hours after online publication and is updated daily on week days.
Initial download of the metrics may take a while.