| Issue |
A&A
Volume 565, May 2014
|
|
|---|---|---|
| Article Number | A74 | |
| Number of page(s) | 12 | |
| Section | Interstellar and circumstellar matter | |
| DOI | https://doi.org/10.1051/0004-6361/201322685 | |
| Published online | 14 May 2014 | |
The supernova remnant W44: Confirmations and challenges for cosmic-ray acceleration
1
INAF/IAPS,
00133
Roma,
Italy
e-mail:
This email address is being protected from spambots. You need JavaScript enabled to view it.
2
Dip. di Fisica, Univ. Tor Vergata, 00133
Roma,
Italy
3
CIFS-Torino, 10133
Torino,
Italy
4
INAF/IASF-Milano, 20133
Milano,
Italy
5
Department of Physics and Astrophysics, Nagoya
University, Furo-cho,
Chikusa-ku, Nagoya
464-8601,
Japan
6
Instituto de Astronomía y Física del Espacio (IAFE),
CC.67, Suc.28,
1428
Buenos Aires,
Argentina
Received:
16
September
2013
Accepted:
5
March
2014
Abstract
The middle-aged supernova remnant (SNR) W44 has recently attracted attention because of its relevance regarding the origin of Galactic cosmic-rays. For the first time for a SNR, the gamma-ray missions AGILE and Fermi have established the spectral continuum below 200 MeV, which can be attributed to a neutral pion emission. Confirming the hadronic origin of the gamma-ray emission near 100 MeV is then of the greatest importance. Our paper is focused on a global re-assessment of all available data and models of particle acceleration in W44 with the goal of determining the hadronic and leptonic contributions to the overall spectrum on a firm ground. We also present new gamma-ray and CO NANTEN2 data on W44 and compare them to recently published AGILE and Fermi data. Our analysis strengthens previous studies and observations of the W44 complex environment and provides new information for more detailed modeling. In particular, we determine that the average gas density of the regions emitting 100 MeV–10 GeV gamma-rays is relatively high (n ~ 250–300 cm-3). The hadronic interpretation of the gamma-ray spectrum of W44 is viable and supported by strong evidence. It implies a relatively large value for the average magnetic field (B ≥ 102 μG) in the SNR surroundings,which is a sign of field amplification by shock-driven turbulence. Our new analysis establishes that the spectral index of the proton energy distribution function is p1 = 2.2 ± 0.1 at low energies and p2 = 3.2 ± 0.1 at high energies. We critically discuss hadronic versus leptonic-only models of emission taking radio and gamma-ray data into account simultaneously. We find that the leptonic models are disfavored by the combination of radio and gamma-ray data. Having determined the hadronic nature of the gamma-ray emission on firm ground, a number of theoretical challenges remain to be addressed.
Key words: acceleration of particles / astroparticle physics / shock waves / radiation mechanisms: non-thermal / ISM: supernova remnants / gamma rays: ISM
© ESO, 2014
1. Introduction
Cosmic-rays (CRs) are highly energetic particles (with kinetic energies up to E = 1020 eV), which are mainly composed of protons and nuclei with a small percentage of electrons (1%). Currently, the CR origin is one of the most important problems of high-energy astrophysics, and the issue is the subject of very intense research (Fermi 1949; Ginzburg & Syrovatskii 1964; Berezinskii et al. 1990). For recent reviews, see Helder et al. (2012) and Aharonian (2012). Focusing on CRs produced in our Galaxy (energies up to the so-called “knee”, E = 1015 eV), strong shocks in supernova remnants (SNRs) are considered the most probable CR sources (e.g., Ginzburg & Syrovatskii 1964). This hypothesis is supported by several “indirect” signatures which indicate the presence of ultra-high energy electrons (recent review in Vink 2012). However, the final proof for the origin of CRs up to the knee can only be obtained through two fundamental signatures. The first is the identification of sources emitting a photon spectrum up to PeV energies. The second is the detection of a clear gamma-ray signature of π0 decay in Galactic sources. Both indications are quite difficult to obtain. The “Pevatron” sources are notoriously hard to find (see Aharonian 2012, for a review), and the neutral pion decay signature is not easy to identify because of the possible contribution from co-spatial leptonic emission. Hadronic (expected to produce the π0 decay spectral signature) and leptonic components can in principle be distinguished in the 50–200 MeV energy band, where they are expected to show different behaviors.
Over the last five years, AGILE, Fermi-LAT and ground telescopes operating in the TeV energy range (HESS, VERITAS, and MAGIC) collected a great amount of data from SNRs (Abdo et al. 2009, 2010a,b,c,e,d, 2011; Acciari et al. 2009; Tavani et al. 2010; Acciari et al. 2010, 2011; Aharonian et al. 2001, 2007, 2008; Aleksic et al. 2012; Giordano et al. 2012; Giuliani et al. 2010; Hewitt et al. 2012; Katsuta et al. 2012; Lemoine-Goumard et al. 2012), providing important information and challenging theoretical models. For example, most of the observed SNRs appear to have a spectrum that is steeper than the one expected from linear and non-linear diffusive shock acceleration models (DSA) of index near 2 (and possibly convex spectrum Bell 1987; Malkov & Drury 2001; Blasi et al. 2005). The SNR W44 is one of the most interesting SNRs observed so far; it is a middle-aged SNR, bright at gamma-ray energies, and quite close to us. Its gamma-ray spectral index (indicative of the underlying proton/ion distribution in the hadronic model) is p ~ 3, which is in apparent contradiction with DSA models. The SNR W44 is therefore an ideal system to study CR acceleration in detail. The AGILE data analysis of this remnant provided information below E = 200 MeV for the first time, which shows the low-energy steepening, in agreement with the hadronic interpretation (Giuliani et al. 2011). Recently, an analysis of Fermi-LAT data confirms these results (Ackermann et al. 2013).
In this paper, we present a new analysis of AGILE data with a re-assessment of CO and radio data on W44. We also compare our results to those obtained from Fermi-LAT data. In Sect. 2, we summarize the most relevant facts about W44, and in Sect. 3, we present an updated view on the AGILE gamma-ray data and on the CO and radio data of this SNR. In Sect. 4, we discuss hadronic and leptonic models in light of our refined analysis. The implications of this work are discussed in Sect. 5. We provide relevant details about our modeling in the Appendices.
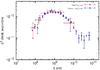 |
Fig. 1 AGILE new gamma-ray spectrum of SNR W44 (red data points) superimposed with the Fermi-LAT data from Ackermann et al. (2013) (blue data points). |
2. The supernova remnant W44
The SNR W44 is a middle-aged (~20 000 years old) SNR located in the Galactic Plane (l,b) = (34.7, −0.4) at a distance d ~ 3.1 kpc (Clark & Caswell 1976; Wolszczan et al. 1991, Fang et al. 2013 report 1.9 kpc.). Multiwavelength observations revealed interesting features. In the radio band, W44 shows a quasi-elliptical shell (Castelletti et al. 2007, and references therein); the radio shell asymmetry is probably due to expansion in an inhomogeneous ISM. In the northwest side of the remnant, which correlates with a peak of the radio emission, there is bright [SII] emission characteristic of shock-excited radiative filaments (Giacani et al. 1997). In the southeast side, instead, there is a molecular cloud (MC) complex embedded in the SNR shell that interacts with the source (Wootten et al. 1977; Rho et al. 1994). The OH maser (1720 MHz) emission detected in correspondence with the SNR/MC region, confirm their interaction (Claussen et al. 1997; Hoffman et al. 2005). Wolszczan et al. (1991) reported the discovery of the radio pulsar PSR B1853+01, which is located in the south part of the remnant and surrounded by a cometary-shaped pulsar wind nebula (PWN; Frail et al. 1996). This system, however, does not appear to be correlated with the detected gamma-ray emission. The X-ray observations of W44 by the Einstein Observatory (Watson et al. 1983) showed centrally peaked emission, which is later confirmed by Chandra data (Shelton et al. 2004).
The first report on W44 in the gamma-ray band was by Fermi-LAT (Abdo et al. 2010e) that showed a GeV emission morphology which has apparent good correlation with the radio shell. The Fermi-LAT energy power spectrum of W44 showed a prominent peak near 1 GeV and a clear decrease at higher energies with a steep spectrum for the photon index near 3 (Abdo et al. 2010e). Early processing of Fermi-LAT data has a low-energy threshold of 200 MeV, thus limiting its ability to identify a neutral pion signature. In addition to hadronic models is then not surprising that leptonic models predicting bremsstrahlung emission below 200 MeV could not be excluded. The relatively large gamma-ray brightness of W44 and the good spectral capability of AGILE near 100 MeV (Tavani et al. 2009; Vercellone et al. 2008, 2009) have stimulated a thorough investigation of this SNR with the AGILE data. The AGILE gamma-ray spectrum in the range of 50 MeV to 10 GeV confirms the high-energy steep slope up to 10 GeV and, remarkably, identifies a spectral decrease below 200 MeV for the first time, as expected from neutral pion decay (Giuliani et al. 2011, hereafter G11). In the analysis of G11, both leptonic and hadronic models were considered in fitting both AGILE and Fermi-LAT data. Proper consideration was given to the constraints derived from VLA radio data and NANTEN CO data for the ambient magnetic field and density, respectively. In G11, the best model was determined to be dominated by hadronic emission with a proton distribution of spectral index p2 = 3.0 ± 0.1 and a low-energy cut-off at Ec = 6 ± 1 GeV. The W44 gamma-ray morphology determined by AGILE agrees well with the emission detected by Fermi-LAT below 1 GeV. Furthermore, a correlation of gamma-ray emission with CO emission is observed, which indicates that most of the gamma-ray emission can be associated with the SNR/MC interaction. A possible large-scale influence of escaping particles accelerated at the W44 SNR shock was studied by Uchiyama et al. (2012), who noticed the existence of far and bright gamma-ray bright MCs. A new important contribution was recently produced by the Fermi-LAT team that revisited the gamma-ray emission from W44 (Ackermann et al. 2013, hereafter A13). This work was also motivated by the improvement in the LAT data analysis that permits a better study of the spectrum near 100 MeV (Ackermann et al. 2012). The new gamma-ray spectrum of W44 by Fermi-LAT fully confirms the AGILE spectrum below 200 MeV (Ackermann et al. 2013, for a comparison of AGILE and new Fermi-LAT data, see Fig. 6 in Appendix A). The analysis in A13 tends to exclude a leptonic-only contribution to the gamma-ray emission because it requires a very large density (n ~ 650 cm-3). Their best hadronic model with an assumed surrounding medium density n ~ 100 cm-3 is based on a smoothed broken power-law hadronic distribution with a break energy Ebr = 22 GeV and indices p1 = 2.36 for E < Ebr and p2 = 3.5 for E>Ebr. Model parameters in A13 differ from those considered earlier in Abdo et al. (2010e). Apparently, bremsstrahlung emission is not considered to be relevant in the hadronic modeling of A13, even though this process could provide a non-negligible contribution to the gamma-ray emissivity in principle. An important feature of the SNR W44 spectrum is its slope at GeV energies: the index p ~ 3 is substantially steeper than the range that is plausibly expected in linear and non-linear DSA models. In Malkov et al. (2011), this spectral feature is explained by Alfvén damping in the presence of a relatively large-density medium where acceleration occurs. The W44 environment is quite challenging in its morphology and requires a reanalysis of its properties in the context of the crucial implications for the acceleration mechanism of CRs. We present here a new analysis of AGILE data with a revised assessment of the W44 surrounding environment, which is based on new CO data obtained from the NANTEN2 telescope.
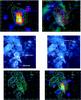 |
Fig. 2 Upper left panel: AGILE gamma-ray intensity map (in Galactic coordinates) of the W44 region in the energy range 400 MeV–10 GeV, which is obtained by integrating all available data collected during the period from May 2007 to June 2012. The pixel size is 0.05° × 0.05° with a 3-bin Gaussian smoothing. Green contours show the 324 MHz radio continuum flux density detected by the very large array (Castelletti et al. 2007) and red circles indicate detected OH masers (Claussen et al. 1997). Upper right panel: combined CO data from the NANTEN2 observatory that is superimposed with the AGILE gamma-ray data contours (magenta) above 400 MeV of the W44 region (map in Galactic coordinates) and VLA contours (white). The CO data have been selected in the velocity range 40–43 km s-1, corresponding to a kinematic distance compatible with the W44 distance. Middle left and right panels: NANTEN2 CO integrated maps with CO contours (40–43 km s-1). Thick white lines show the four CO peaks. Bottom left panel: NANTEN2 CO integrated contours (40–43 km s-1, cyan) and VLA contours (green). Bottom right panel: AGILE intensity map (400 MeV–10 GeV) with NANTEN2 (cyan) and VLA (green) contours. |
3. New AGILE data analysis
We performed a global reassessment of the AGILE data on W44, including new gamma-ray data obtained until June 2012. The new data were obtained using the updated AGILE data archive, which is available at the ASDC site (http://www.asdc.asi.it). The analysis procedure is the same as described in G111, except for the map bin-size (that is now wider than before in order to make an analysis focused on extended features) and the substantially more extended observing period.
3.1. Morphology
The upper left panel of Fig. 2 shows the W44 AGILE gamma-ray map in the 400–10 000 MeV energy range2 with radio contours from VLA (green contour levels). The upper right panel shows the NANTEN2 telescope CO map in two velocity channels, 41 and 43 km s-1, with AGILE (magenta) and VLA (white) contours. Gamma-ray emission appears to be mostly concentrated near a high-density region, (bottom panel of the Fig. 2), indicating that most of the W44 gamma-ray emission is coincident with a site of SNR/MC interaction. This MC could be at some distance from the remnant or embedded in it. The CO maps (Fig. 2, medium panel) show the presence of a large molecular cloud complex with four different peaks at (34.8, –0.8), (34.75, –0.5), (35.1, –0.2), and (34.65, –0.1), respectively, which are indicated by the thick white lines. Each of these peaks reaches densities of about 103 cm-3 for an estimated average density in the SNR shell of nav ~ 200 cm-3 (Yoshiike et al. 2013). A good correlation with the gamma-ray emission corresponds with the peak at (34.7, –0.5).
3.2. Spectrum
Figure 1 shows the AGILE gamma-ray spectrum with the recently updated Fermi-LAT data from Ackermann et al. (2013). The AGILE spectrum is composed by six energy bins between 50 MeV and 10 GeV and our error-bars takes statistical errors into account3. The measured flux of the source above 400 MeV is F = (23 ± 2) × 10-8 ph cm-2 s-1. We notice the good agreement between the two spectra. Especially important is the confirmation of the drastic spectral decrement below 200 MeV, a crucial feature that is discussed below. Both AGILE and Fermi-LAT spectra differ from the previously published spectra in G11 and Abdo et al. (2010e) (see Appendix A).
4. Modeling
We model the radio, AGILE, and Fermi-LAT spectral data by hadronic and leptonic-only scenarios by considering the new NANTEN2 CO data that provides a value for the ISM density in the SNR surroundings4, nav ≃ 250 cm-3 (Yoshiike et al. 2013). This value of the average gaseous density that surrouds the gamma-ray emission is substantially larger than the one assumed in G11 and A13 (n = 100 cm-3). Since the AGILE gamma-ray emission is strongly correlated with one of the CO peaks, we consider an average density n ≃ 300 ± 50 cm-3 > nav in the following. In modeling the spectra, we consider the most statistically significant Fermi-LAT data up to 50 GeV.
4.1. Hadronic models
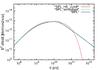 |
Fig. 3 Particle total energy distributions for our best hadronic models vs. the kinetic energy: a simple power-law with a high-energy cut-off at Ec = 45 GeV (Eq. (1), red), a smoothed broken power law with Ebr = 16 GeV (Eq. (2), green), and broken power law with Ebr = 20 GeV (Eq. (3), blue). |
Hadronic model parameters.
We assume that the gamma-ray emission spectrum is due to the combined contribution of hadronic π0 emission and leptonic bremsstrahlung emission by considering the proton component as the main one. For hadronic emission, we use the formalism explained in Kelner et al. (2006) that is a good approximation of the exact solution. We consider a proton distribution in total energy E rather than in kinetic energy Ek = E − mpc2, following Simpson (1983) and Dermer (1986), but with δ-function approximation for the cross-section (Aharonian 2004). This approximation provides that a fixed fraction of proton energy is converted to π0 energy. Even if the distribution is broad, this method gives accurate results as long as the proton spectrum is smooth and broad (e.g., power-law). We fit the gamma-ray data by assuming different types of proton distributions in energy (see Fig. 3):
-
a simple power-law with a high-energy cut-off (model H1):
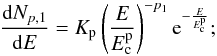 (1)
(1) -
a smoothed broken power-law (model H2):
 (2)
(2) -
a broken power-law (model H3):
 (3)
(3)
 (4)We
fix only the parameters for which we have solid observational evidence: the average medium
density, n =
300 cm-3, and the radio spectral index, p′ = 1.74. We
vary all other parameters, such as the normalization constants, Kp and
Ke, and the cut-off and break energies,
Ec and Ebr. Our results
are summarized in Table 1, where we show the best
models which are obtained according to the standard chi-square minimization test (Taylor 2000). Every model is discussed individually in
Appendix B. Here, we present the properties of our best hadronic model H3. This is
characterized by the distribution in Eq. (3) with p1
= 2.2 ± 0.1 (for E < Ebr),
p2 = 3.2 ±
0.1 (for E > Ebr),
and an energy break
(4)We
fix only the parameters for which we have solid observational evidence: the average medium
density, n =
300 cm-3, and the radio spectral index, p′ = 1.74. We
vary all other parameters, such as the normalization constants, Kp and
Ke, and the cut-off and break energies,
Ec and Ebr. Our results
are summarized in Table 1, where we show the best
models which are obtained according to the standard chi-square minimization test (Taylor 2000). Every model is discussed individually in
Appendix B. Here, we present the properties of our best hadronic model H3. This is
characterized by the distribution in Eq. (3) with p1
= 2.2 ± 0.1 (for E < Ebr),
p2 = 3.2 ±
0.1 (for E > Ebr),
and an energy break  GeV.
The leptonic contribution to this model is given by a simple power-law for the electrons
with p′ =
1.74, and
GeV.
The leptonic contribution to this model is given by a simple power-law for the electrons
with p′ =
1.74, and  GeV
(see Fig. 4). This model provides a proton energy
Wp = 5 ×
1049 erg and requires an average magnetic field in the
emission region, B =
210 μG.
GeV
(see Fig. 4). This model provides a proton energy
Wp = 5 ×
1049 erg and requires an average magnetic field in the
emission region, B =
210 μG.
 |
Fig. 4 Our best hadronic model, H3, of the broadband spectrum of the SNR W44 superimposed
with radio (data points in green color) and gamma-ray data of Fig. 1 (in blue and cyan color). Proton distribution in
Eq. (3) with index p1 = 2.2 ±
0.1 (for E < Ebr)
and p2 = 3.2
± 0.1 (for E>Ebr)
where |

In our calculations, we do not consider the so-called “nuclear enhancement factor” (Dermer 2012) that considers helium contribution in the gamma-ray spectrum, which is on the order of 2. However, the only change due to this factor is a reduced proton energy density; our most important results and conlusions about spectral indices and parameter estimation are not affected in any way.
4.2. Leptonic-only models
It is important to test the viability of leptonic-only models of gamma-ray emission from W44. We use the general expression for electron radiative processes as in Blumenthal & Gould (1970).
-
Synchrotron emission: for a power-law electron distribution, it is convenient to use a δ-function approximation (e.g., Longair 2011) that can be expressed as:
![Mathematical equation: \begin{eqnarray} \frac{{\rm d}N}{{\rm d}E_{\gamma}}=4\pi \frac{1}{E_{\rm ph}}\sigma_{\rm th}U_{B}F_{\rm e}(E_{\rm e}){\rm d}E_{\rm e}\,\,\left[\frac{1}{\rm MeV\,s\,cm^{-3}}\right], \end{eqnarray}](/articles/aa/full_html/2014/05/aa22685-13/aa22685-13-eq82.png) (5)where
(5)where
 MeV cm-3 is
magnetic energy density, σth is Thompson cross-section,
d
MeV cm-3 is
magnetic energy density, σth is Thompson cross-section,
d ,
and
,
and  is the initial photon energy. For a power-law electron distribution proportional to
E−
p′, the photon energy
distribution is then proportional to
is the initial photon energy. For a power-law electron distribution proportional to
E−
p′, the photon energy
distribution is then proportional to  .
.
-
Bremsstrahlung emission: we used the general expression from Blumenthal & Gould (1970):
![Mathematical equation: \begin{eqnarray} &&\frac{{\rm d}N}{{\rm d}E}=\alpha r_{0}^{2}E^{-1}n\int {\rm d}E_{\rm e}F_{\rm e}(E_{\rm e})E_{\rm e}^{-2}\nonumber\\ &&\times \left[\left(2E_{\rm e}^{2}-2E_{\rm e}E+E^{2}\right)\phi_{1}-\frac{2}{3}E_{\rm e}\left(E_{\rm e}-E\right)\phi_{2}\right]\nonumber\\ &&\times \left[\frac{1}{\rm MeV\,s\,cm^{-3}}\right] \end{eqnarray}](/articles/aa/full_html/2014/05/aa22685-13/aa22685-13-eq89.png) (6)where
n is
the density, φ1 and φ2 are
functions of electron energies, α is the fine structure constant, and
re is the electron classical radius.
This can be used in both a totally ionized medium (weak shielding) and in the
presence of neutrals (strong shielding); the difference is only a logarithmic
factor. For a power-law electron distribution proportional to E−p, the photon energy distribution is then
proportional to E−p′.
(6)where
n is
the density, φ1 and φ2 are
functions of electron energies, α is the fine structure constant, and
re is the electron classical radius.
This can be used in both a totally ionized medium (weak shielding) and in the
presence of neutrals (strong shielding); the difference is only a logarithmic
factor. For a power-law electron distribution proportional to E−p, the photon energy distribution is then
proportional to E−p′. -
Inverse Compton emission:
![Mathematical equation: \begin{eqnarray} \frac{{\rm d}N}{{\rm d}E}=4\pi \frac{1}{E_{\rm ph}}\sigma_{\rm kn}U_{\rm ph}F_{\rm e}(E_{\rm e}){\rm d}E_{\rm e}\,\,\left[\frac{1}{\rm MeV\,s\,cm^{-3}}\right], \end{eqnarray}](/articles/aa/full_html/2014/05/aa22685-13/aa22685-13-eq96.png) (7)where
Uph energy density of the radiation
field, σkn is Klein-Nishina cross-section,
d,
and Eph is the interstellar radiation
field initial photon energy.
(7)where
Uph energy density of the radiation
field, σkn is Klein-Nishina cross-section,
d,
and Eph is the interstellar radiation
field initial photon energy.
To fit both gamma-ray and radio data, we consider a smoothed broken power-law leptonic
distribution:  (8)Our
assumption is that the same electron population produces both the gamma-ray and the radio
fluxes through bremsstrahlung and synchrotron emissions, respectively. The spatial
co-existence of radio filaments and sites of gamma-ray emission justifies this hypothesis.
We fix the gaseous density value, n = 300 cm-3, from NANTEN2 data.
(8)Our
assumption is that the same electron population produces both the gamma-ray and the radio
fluxes through bremsstrahlung and synchrotron emissions, respectively. The spatial
co-existence of radio filaments and sites of gamma-ray emission justifies this hypothesis.
We fix the gaseous density value, n = 300 cm-3, from NANTEN2 data.
Our first leptonic-only model was developed (L1, see Table 2) by fixing the electron spectral index at the value found from radio
data analysis by Castelletti et al. (2007);
 for
E < Epeak.
We found a high energy electron spectral index
for
E < Epeak.
We found a high energy electron spectral index  above
an energy break
above
an energy break  GeV and
a magnetic field B ~
25 μG. However, fixing
, we
can fit radio synchrotron data, but we cannot fit it in any way the low-energy gamma-ray
data (see Fig. 5).
GeV and
a magnetic field B ~
25 μG. However, fixing
, we
can fit radio synchrotron data, but we cannot fit it in any way the low-energy gamma-ray
data (see Fig. 5).
The second leptonic-only model was developed to fit gamma-ray data with the
Bremsstrahlung emission (L2, see Table 2) by
changing the electron spectral index. We can fit low-energy gamma-ray data with an index
 for
for
 , which is
very hard to explain. The other parameters found are
, which is
very hard to explain. The other parameters found are
 for
for
 ,
,
 MeV,
and B ~
40 μG.
MeV,
and B ~
40 μG.
Leptonic model parameters.
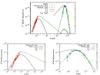 |
Fig. 5 Photon spectra obtained from the two leptonic-only models, L1 (green) and L2
(black), based on a broken power-law electron distribution. The density is fixed at
n =
300 cm-3. In the model L1 the electron index is fixed at
|


5. Discussion
5.1. Models
Gamma-ray emission from SNRs can be produced in general by three different mechanisms: (1) relativistic bremsstrahlung from electrons interacting with surrounding medium; (2) inverse Compton emission from electrons that scatter soft photons (e.g.,s cosmic background radiation and interstellar radiation field); and (3) proton-proton interaction producing π0, which subsequently decays into two gamma-ray photons. To find an unambiguous signature of accelerated hadrons in W44, we need to clearly identify these different contributions in the high energy spectrum. As in G11, we model the gamma-ray data by considering all possible emission mechanisms. We fix two important parameters obtained from radio and mm-CO data. Multifrequency radio data (Castelletti et al. 2007) provide the radio photon index α = 0.37, which implies an electron index p′ = 1.74, for energies less than the synchrotron peak. By using NANTEN2 telescope data, we can also fix the SNR average density in the region of gamma-ray emission at nav = 300 cm-3.
5.1.1. Leptonic-only model failure
Our aim is to test whether a leptonic-only model can explain the gamma-ray emission from W44. We assume that the same electron population produces both the radio and the gamma-ray emissions. We assume a broken power-law electron distribution with inverse Compton and Bremsstrahlung components.
-
L1 model: we use the index
as a parameter,
which is obtained from radio synchrotron data (Castelletti et al. 2007). Relativistic bremsstrahlung has the same
electron index (Blumenthal & Gould
1970). Consequently, an index cannot explain the
low-energy gamma-ray data in any way (Fig. 5,
black curve). Moreover, the relation between density and magnetic field (see
Appendix C) constrains the synchrotron peak; fixing the medium density to the
average value found in Yoshiike et al.
(2013), n =
300 cm-3, we cannot fit in a good way the W44 radio
emission for any magnetic field value. The best model gives a B =
25 μG. Changing the density value does not
improve the fit. -
L2 model: in this case, we do not apply the radio constraint on the electron spectral index to fit the low-energy gamma-ray data. We find that only an index
can explain the
gamma-ray spectrum decay at with
 MeV with an index
for
. In this
case, the W44 gamma-ray emission can be explained, but the radio synchrotron data
(see Fig. 5, green curve) contradicts with
the model.
MeV with an index
for
. In this
case, the W44 gamma-ray emission can be explained, but the radio synchrotron data
(see Fig. 5, green curve) contradicts with
the model.
Figure 5 shows the failure of these two models5, L1 and L2, to simultaneously explain the radio and gamma-ray emission of W44.
5.1.2. The best hadronic model: a broken power-law distribution
We considered different possible hadronic models (Table 1 and Fig. 3). The best one is the so-called H3, a broken power-law proton distribution discussed in the following. Features and implications of the other models, H1 and H2, are discussed in Appendix A. To separately consider the low and high energy parts of the spectrum, we consider a non-smoothed broken power-law distribution (Eq. (3)). In this way, we can study which kind of processes affect one or the other part of the spectrum. We obtain a good model with p1 = 2.2 ± 0.1 for E < Ebr and p2 = 3.2 ± 0.1 for E>Ebr, where Ebr = 20 GeV. The magnetic field is on the same order as for other hadronic models, B = 210 μG, and the electron/proton number ratio is ℜ = 0.01 at e ~ 10 GeV. The index found for the low-energy part agrees with the one found by A13. On the other hand, the high energy index of the H3 model is substantially harder than in A13 and steeper than the one found in our previous paper, p2 = 3.0 ± 0.1 (Giuliani et al. 2011). Our analysis confirms that the SNR W44 has a gamma-ray spectral index near 10 GeV that is steeper than all other middle-aged SNRs. Interestingly, the low-energy index near 2.3 is close to the value found in several other young SNRs (Abdo et al. 2010a; Acciari et al. 2010, 2011; Aharonian et al. 2001; Giordano et al. 2012; Hewitt et al. 2012). This can have a profound reason, and it may be related with a universal or quasi-universal injection of energetic particles by a SNR shock.
Summary of the model parameters used to fit gamma-ray and radio W44 data.
5.2. Hadronic models: proton energies and magnetic fields
An important physical consequence of hadronic models is the value of the total energy going into accelerated protons. Considering the total particle energy, Castelletti et al. (2007) provided a minimum value for the total CR energy and for the magnetic field in W44, which is estimated from the radio data, assuming particle and magnetic energy equipartition; Umin = 5.8 × 1049 erg and Bmin = 13 μG. For the equipartition assumption, Umin = 2UB = 2UCR. Consequently, far away from equipartition, magnetic energy should be greater than particle energy or vice versa (Longair 2011). We can use the equipartition values for magnetic and particle energies found by Castelletti et al. (2007) to expose a contradiction in their relation. Our models, except for the simple power-law with a high energy cut-off, provide a total energy in accelerated protons that is lower than the one calculated with the equipartition assumption, which implies magnetic fields with higher values. It is essential to obtain a good estimate of the magnetic field in regions of interest in W44. To fit the gamma-ray data in our models, we also explicitly consider the bremsstrahlung contribution by electrons. This approach provides a constraint on the magnetic field. Assuming that synchrotron and bremsstrahlung emissions are originated by the same electron population, both processes depend on the electron density; the higher its value, the higher their emissivity. Consequently, to obtain a small bremsstrahlung contribution to the gamma-ray emission with a fixed target density, the magnetic field has to be enhanced in order to obtain the correct synchrotron emission and viceversa. The final result is that we can fit the radio data by only considering a magnetic field, B ~ 102 μG ≫ Bmin (see Table 3), regardless of the hadronic model. This implies that the magnetic energy should be the main contribution to the total energy. Consequently, our model H1 can be excluded because both magnetic and particle energies are greater than the equipartition values. Large values of the magnetic field (B ~ 0.2 mG) in W44 were deduced by Claussen et al. (1997) in regions near the detected OH masers. Interestingly, from Fig. 2, we find that the gamma-ray emission detected by AGILE overlaps with one of the OH maser regions. To obtain a large local magnetic field (i.e., substantially larger than the equipartition one), an efficient amplification mechanism must be operating. A possible mechanism was discussed by Schure et al. (2012): a linear magnetic instability can provide the condition δB ~ B0. However, it is required that the instability continues to grow in order to explain magnetic fields greater than 100 μG. Identifying the physical mechanisms for magnetic field amplification can be challenging. It is also important to explain the relation between magnetic field and density structures (e.g., Fig. 2 in Schure et al. 2012). In young SNRs where the ISM density is low (n ~ 1 cm-3), high magnetic fields are usually correlated with optical and radio filaments. In middle-aged SNRs, such as W44, which are surrounded by high ISM densities (n ~ 102 cm-3), the magnetic field is relatively large on wider scales.
5.3. Spectral index
Our best hadronic model is obtained from a non-smoothed broken power-law distribution. At low-energies, we can fit the gamma-ray data with a proton distribution index p1 = 2.2. This value apparently agrees with the behavior seen in younger SNRs. The difference is that in young SNRs this spectral index also applies at higher energies not being affected by propagation and damping mechanisms. On the contrary, in the middle-aged SNR W44, we find a proton index p2 = 3.2 at higher energies, that is substantially steeper that the value expected from theoretical models without damping. Malkov et al. (2011) explained the W44 steep spectral index with the mechanism of Alfvèn damping, which provides a steepening of exactly one unit. However, Alfvèn damping, if it occurs in W44, cannot be acting across all the proton spectrum because the deduced low-energy index seems unaffected by it.
It is interesting to compare W44 gamma-ray spectrum to the CR particle interstellar
spectrum. The interstellar cosmic-ray proton index, in momentum space, is p1,IS =
2.5 below E
= 6.5 GeV and p2,IS = 2.8 above
E = 6.5 GeV
(Dermer et al. 2013); the interstellar cosmic-ray
electron spectrum, instead, seems to have an index  –1.6 below a few GeV and
 –2.3 above GeV energies (Strong et al. 2011, and references therein).
Considering our best hadronic model, H3, a proton index at the lowest energies,
p1 =
2.2, in the energy space is provided. In the momentum space, the high
energy proton spectral index, p2 = 3.2, results to be steeper than the
interstellar CR spectrum. For the electrons, instead, radio data provided an index
p′ =
1.74 (Castelletti et al. 2007),
which is steeper than
–2.3 above GeV energies (Strong et al. 2011, and references therein).
Considering our best hadronic model, H3, a proton index at the lowest energies,
p1 =
2.2, in the energy space is provided. In the momentum space, the high
energy proton spectral index, p2 = 3.2, results to be steeper than the
interstellar CR spectrum. For the electrons, instead, radio data provided an index
p′ =
1.74 (Castelletti et al. 2007),
which is steeper than  but harder
than
but harder
than  .
Consequently, the CR spectral behavior in SNR W44 is different from that of the
interstellar CR spectrum. This challenging issue requires a deeper analysis beyond the
scope of this paper. We also note, however, that proton and electron spectra have
different indices in the interstellar case as well as in W44.
.
Consequently, the CR spectral behavior in SNR W44 is different from that of the
interstellar CR spectrum. This challenging issue requires a deeper analysis beyond the
scope of this paper. We also note, however, that proton and electron spectra have
different indices in the interstellar case as well as in W44.
Our spectral indices are compatible with the values, p1 = 2.36 ± 0.05 for p < pbr = 22 GeVc-1 and p2 = 3.5 ± 0.3 for p>pbr, found in Ackermann et al. (2013), where a smoothed broken power-law is used and he electron contributions are not considered. Fang et al. (2013), instead, assume that the W44 spectral behavior is explained by diffusive shock acceleration with ion-neutral damping and consider a lower distance of the remnant (d ~ 1.9) and a lower density (n ~ 102 cm-3). In this way, they found every low magnetic field (B ~ 10 μG) and a very steep spectral index, p1 ~ 4.1. A direct comparison with our results is not so trivial because of the different approaches: we, like Ackermann et al. (2013), begin from fitting our data and then we look for a physical explanation. Fang et al. (2013), instead, begin from the issue that a linear DSA theory can explain Fermi-LAT data and then obtain the parameters that are inconsistent with values from our work and Ackermann et al. (2013).
It is interesting to remark here that data collected from the young SNRs, Tycho, and Cas A (Abdo et al. 2010a; Giordano et al. 2012) show a spectral index in the range p1 ≈ 2.2–2.4, which is steeper than the value p1 = 2 predicted by idealized theoretical models (assumed by Malkov et al. 2011). Other non-linear mechanisms modifying standard DSA, such as neutral leakage (Blasi et al. 2012, and references therein) or re-acceleration (Blasi & Amato 2012, and references therein), may substantially affect SNRs in the whole range of energies.
6. Conclusions
The SNR W44 is a crucial source providing important information about the CR origin in our Galaxy. However, several characteristics of this SNR, which have been deduced by a multifrequency approach (gamma-ray spectral indices, large magnetic field), are challenging. As discussed in this paper, W44 is a relatively close and quite bright gamma-ray source. Therefore, an excellent characterization of its gamma-ray spectrum in the range 50–200 MeV has been possible because of the good statistics achieved by AGILE and Fermi-LAT. In this paper, we re-analyzed the spectral properties and the likelihood of interpreting the decrement below 200 MeV as a “pion bump”. We performed a re-analysis of the AGILE data, by revisiting radio and CO data of W44. We showed the unlikeliness of leptonic-only models in their most natural form: electron distributions constrained by radio data cannot fit the broad-band W44 spectrum. On the other hand, we find that both gamma-ray and radio data can be successfully modeled by different kinds of hadronic models (H1, H2, and H3).
Our results regarding the spectral properties of the accelerated proton/ion population by the W44 shock qualitatively agree with the results of Giuliani et al. (2011). We provided a broader discussion of alternatives in this paper, and specified the role played by leptons alone and jointly with protons. In what follows, we summarize the most important physical characteristics of this source.
-
Neutral pion signature: W44 is the first SNR clearly showing the so-called “pion bump” that we expect at E ≥ 67 MeV from π0-decay photons. The low-energy gamma-ray spectral index in our best model is p1 = 2.2 ± 0.1. This value is similar to those found in young SNRs, which indicates that the proton injection spectrum is affected by non-standard mechanisms of acceleration.
-
High density of the surrounding environment: we determined that the average density in the W44 shell is nav ~ 300 cm-3 with n ≥ 103 cm-3, which corresponds with CO peaks (see medium panels in Fig. 2). This feature was also found in other middle-aged SNRs, like W51c and IC443 (Koo et al. 2010; Castelletti et al. 2011) and explains the high gamma-ray flux detected from these sources. In the SNR W28, the average density is lower, nav ≈ 5 cm-3 (Gabici et al. 2009), but gamma-ray emission was detected and correlates with the two MC complexes where n ≈ 103 cm-3 (Giuliani et al. 2010).
-
High magnetic field: in W44 our best hadronic models imply a magnetic field B ≥ 100 μG, which is lower than the post-shock magnetic field estimated from Zeeman splitting in the OH masers by Claussen et al. (1997), and substantially higher than the equipartition magnetic field (Castelletti et al. 2007). However, in most of SNRs, magnetic field estimations give values B ~ 10−102 μG that are much higher than the average diffuse galactic value (e.g., see Morlino & Caprioli 2012 for Tycho, Koo et al. 2010 for W51c, and Tavani et al. 2010 for IC443). This is hardly surprising since magnetic field compression due to the shock interaction with the ISM leads to its amplification. We need to then consider a non-linear scenario with a back-reaction of the accelerated particle at the shock (Bell et al. 2001). The large value for the magnetic field in W44 may be linked to the environment density value, nav ~ 300 cm-3 given by NANTEN2. For a lower density value, we notice that we can enhance the electron density and make plausible a lower magnetic field.
-
Steepness of the high energy index: as in Abdo et al. (2010e), G11, and A13, W44 shows a spectral index p2 ~ 3 for energies above 1 GeV, that is steeper than the values found in other middle-aged SNRs. Alfvèn damping in a dense environment (Malkov et al. 2011) is a mechanism for explaining this behavior, but other possibilities exist (e.g., Blasi & Amato 2012; Blasi et al. 2012). This is a point requiring deeper investigations in the future.
Our final conclusion is that W44 stands out as a crucial SNR whose gamma-ray emission can be firmly demonstrated to be of hadronic origin. A complete understanding of the W44 features requires modeling physical processes beyond DSA. Future investigations will have to address these issues, as well as understanding W44 within the context of other SNRs.
Appendix A: Old and new AGILE and Fermi -LAT data on W44
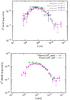 |
Fig. 6 Top panel: AGILE (red) and Fermi-LAT (green) old spectral energy distribution (SED) of W44 (Giuliani et al. 2011; Abdo et al. 2010e), with the new Fermi-LAT (magenta, Ackermann et al. 2013). The new AGILE data are shown in blue in Fig. 1. Bottom panel: Fermi-LAT new (magenta, Ackermann et al. 2013) and old (green, Abdo et al. 2010e) spectral energy distributions. We note that there is a substantial difference at low-energies between the two data sets. |
Figure 6 shows the old and new AGILE and Fermi-LAT spectral gamma-ray data W44. Low-energy spectral points have been added to the Fermi-LAT spectrum because of its recently improved analysis (Ackermann et al. 2012). We notice that the low-energy Fermi-LAT spectrum below 200 MeV has changed with respect to the previous Fermi-LAT data of Abdo et al. (2010e). On the other hand, the AGILE data re-analyzed in this paper are not different from those previously presented in G11, except the lowest energy point between 50–100 MeV. This lowest-energy spectral data is lower than the one found in our previous paper and agrees with the Fermi-LAT spectral trend. Constraining the gamma-ray spectrum near 50 MeV is very important with regard to a possible bremsstrahlung contribution.
Appendix B: Other hadronic models
Simple power-law with a high-energy cut-off
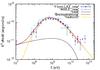 |
Fig. 7 Hadronic model H1 of the gamma-ray spectrum of W44 superimposed with the gamma-ray
data of Fig. 1 (in blue and cyan colors). We find
an index p1 =
2.0 ± 0.1 with a high-energy cut-off at
|

Following Aharonian (2004), we fit our W44 spectral
data with a simple power-law with a high-energy cut-off. In this case, our best-fitting
parameters are an index p1 = 2.0 ± 0.1, and a cut-off energy at
 GeV with
B =
210 μG. Deduced global physical quantities are a relatively
large proton energy, Wp = 1.2 × 1050 erg, and a low
electron/proton energy ratio ℜ =
0.005. Even in this case, there are some points against the applicability
of this model. First, we can only fit our data with this proton distribution by ignoring the
last four Fermi high energy points and requiring a very low electron/proton
ratio. Moreover, the high-energy cut-off considered in Aharonian (2004) for a SNR of similar age as W44 in similar density and magnetic
field conditions is less sharp than the one obtained in our model, even with a high
diffusion coefficient.
GeV with
B =
210 μG. Deduced global physical quantities are a relatively
large proton energy, Wp = 1.2 × 1050 erg, and a low
electron/proton energy ratio ℜ =
0.005. Even in this case, there are some points against the applicability
of this model. First, we can only fit our data with this proton distribution by ignoring the
last four Fermi high energy points and requiring a very low electron/proton
ratio. Moreover, the high-energy cut-off considered in Aharonian (2004) for a SNR of similar age as W44 in similar density and magnetic
field conditions is less sharp than the one obtained in our model, even with a high
diffusion coefficient.
Smoothed broken power-law
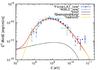 |
Fig. 8 Hadronic model H2 of the gamma-ray spectrum of W44 superimposed with the gamma-ray
data of Fig. 1 (in blue and cyan colors). We find
an index p1 =
1.74.0 ± 0.1 (for E < Ebr),
and p2 = 3.5 ±
0.1 (for E>Ebr)
where |

Another way to model the W44 gamma-ray spectral data is using a smoothed broken power-law proton distribution (Eq. (2)). Our best model provides indices p1 = 1.74 ± 0.1 for E < Ebr and p2 = 3.5 ± 0.1 for E > Ebr with Ebr = 16 GeV, B = 210 μG, and ℜ = 0.08. For this proton distribution we notice that we obtain the same index of the electron distribution. In our opinion, however, the distribution of Eq. (2) cannot be considered a good model. The reason is that this model introduces a strong covariance between the low- and high-energy indices which makes their determination quite difficult and questionable. In Fig. 10 we demonstrate this point by showing the pion emission expected from the proton distribution of different indices that extend to the lowest energies and have no breaks at higher energies. The low-energy part of the spectrum of W44 can be well fit by an index in a range 2–2.3. Steeper or harder indices cannot reproduce our data, which is also true for the value p1 = 1.74 ± 0.1 found with the approach considered here.
Simple power-law with a low-energy cut-off
 |
Fig. 9 Hadronic model H4 of the gamma-ray spectrum of W44 that is superimposed with the
gamma-ray data of Fig. 1 (in blue and cyan
colors). We find an index p1 = 3.2 ± 0.1 with a low-energy
cut-off at |

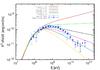 |
Fig. 10 Gamma-ray emission from neutral pion decay calculated for different simple power-law proton distributions of different spectral indices without any break or cut-off. We show the cases for p1 = 1.74 (red), p1 = 2 (green), p1 = 2.3 (black), p1 = 2.5 (magenta), p1 = 2.7 (cyan), and p1 = 3 (yellow). |
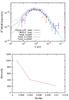 |
Fig. 11 Top panel: our best hadronic model H3 (see Fig. 4) for three different values of the target density; n = 300, 1000, and 2000 cm-3. Bottom panel: correlation between the magnetic field and the electron/proton ratio to fit the spectral gamma-ray data of W44 for the three assumed target densities. |
In our previous paper G11, we used a simple power-law proton distribution in kinetic energy
which resulted in a spectral index p1 = 3.0 ± 0.1 and a low-energy cut off at
 GeV. We model the W44 spectral
data with the same kind of distribution as in G11 here, which is in total energy rather than
kinetic energy, as justified by the approach of Kelner et
al. (2006):
GeV. We model the W44 spectral
data with the same kind of distribution as in G11 here, which is in total energy rather than
kinetic energy, as justified by the approach of Kelner et
al. (2006): 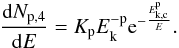 (9)We
obtain a reasonable good model of the spectral data with an index p1 = 3.2 ± 0.1 and
a cut-off energy
(9)We
obtain a reasonable good model of the spectral data with an index p1 = 3.2 ± 0.1 and
a cut-off energy  GeV for
a magnetic field B =
145 μG and an electron/proton energy ratio ℜ =
We/Wp =
0.03. If the interaction of protons with the gas is outside the
acceleration site, the energy-dependent diffusion of particles may produce this cutoff, as
observed for the SNR W28 (Giuliani et al. 2010) and
discussed by Gabici et al. (2009). Alternatively, it
may be due to a suppression of the diffusion coefficient due to turbulent motions in the
cloud (Gabici et al. 2007) that would exclude the
low-energy CRs from the denser regions. In both cases, a slow diffusion coefficient
(D ~
1026 cm2 s-1 at 10 GeV) is required.
GeV for
a magnetic field B =
145 μG and an electron/proton energy ratio ℜ =
We/Wp =
0.03. If the interaction of protons with the gas is outside the
acceleration site, the energy-dependent diffusion of particles may produce this cutoff, as
observed for the SNR W28 (Giuliani et al. 2010) and
discussed by Gabici et al. (2009). Alternatively, it
may be due to a suppression of the diffusion coefficient due to turbulent motions in the
cloud (Gabici et al. 2007) that would exclude the
low-energy CRs from the denser regions. In both cases, a slow diffusion coefficient
(D ~
1026 cm2 s-1 at 10 GeV) is required.
Appendix C: Density and magnetic field link
The relation between the magnetic field and the target density in W44 is important for our modeling. We consider here a hadronic model with the same parameters of our best model (broken power-law distribution, see Table 3) but with higher density values, n = 1000 cm-3 and n = 2000 cm-3. We assume that all gamma-ray emission detected by AGILE originates from the core of the W44 molecular cloud at Galactic coordinates (34.75, –0.5). In Fig. 11 (top panel), we show the results obtained with these high density values with the one obtained for n = 300 cm-3. The higher the density, the higher the bremsstrahlung contribution to the total gamma-ray emission. A very large value of the target density may lead to an overestimation of the high energy gamma-ray data. The only way to fit the data is by assuming a lower electron density (and a lower electron/proton energy ratio ℜ = We/Wp) with a consequently higher magnetic field, B ~ 410 μG and B ~ 1110 μG for n = 1000 cm-3 and n = 2000 cm-3, respectively (Fig. 11, bottom panel).
For more details about the background model, software and likelihood technique, see Giuliani et al. (2004, 2006); Bulgarelli et al. (2012); Chen et al. (2013).
The different morphology of the gamma-ray emission compared to that presented in G11 is influenced by binning. In G11, we used 0.02° × 0.02° bins; instead, we make the choice of a 0.05° × 0.05° binning.
The systematic errors in the canonical energy band (100 MeV–3 GeV) are on the order of 20%–30% of the statistical errors (Chen et al. 2013).
Yoshiike et al. (2013) use a H2/CO ratio which is equal to XCO = 1.56 × 1020 cm-2/K/km s-1 (see also Hunter et al. 1997) that we use as a reference value. This value of XCO is known to be uncertain within a factor of at least 2 (see, e.g., Strong et al. 2004).
A substantial inverse Compton contribution can be easily excluded. If the soft photon source is the cosmic background radiation (CBR), we expect a second peak in the gamma-ray spectrum (Epeak ~ 1 TeV), which contradicts upper limits from Cherenkov telescopes (Abdo et al. 2010e). If soft photons come from the interstellar radiation field (ISRF), we cannot fit synchrotron radio data in any way, using reasonable magnetic field values.
Acknowledgments
We thank the anonymous referee for his/her comments that led to substantial improvements of our paper. We are pleased to thank F. Aharonian for extensive discussions that stimulated parts of the work presented in this paper. Research partially supported by the ASI grants no. I/042/10/0 and I/028/12/0 and Argentina ANPCyT and CONICET grants: PICT 0902/07, 0795/08, 0571/11, PIP 2166/08, 0736/12.
References
- Abdo, A., Ackermann, M., Ajello, M., et al. 2009, ApJ, 706, L1 [Google Scholar]
- Abdo, A., Ackermann, M., Ajello, M., et al. 2010a, ApJ, 710, 92 [Google Scholar]
- Abdo, A., Ackermann, M., Ajello, M., et al. 2010b, ApJ, 712, 459 [NASA ADS] [CrossRef] [Google Scholar]
- Abdo, A., Ackermann, M., Ajello, M., et al. 2010c, ApJ, 722, 1303 [NASA ADS] [CrossRef] [Google Scholar]
- Abdo, A., Ackermann, M., Ajello, M., et al. 2010d, ApJ, 718, 348 [Google Scholar]
- Abdo, A., Ackermann, M., Ajello, M., et al. 2010e, Science, 327, 1103 [NASA ADS] [CrossRef] [PubMed] [Google Scholar]
- Abdo, A., Ackermann, M., Ajello, M., et al. 2011, ApJ, 734, 28 [NASA ADS] [CrossRef] [Google Scholar]
- Acciari, V. A., Aliu, E., Arlen, T., et al. 2009, ApJ, 698, 133 [Google Scholar]
- Acciari, V. A., Aliu, E., Arlen, T., et al. 2010, ApJ, 714, 163 [Google Scholar]
- Acciari, V. A., Aliu, E., Arlen, T., et al. 2011, ApJ, 730, L720 [Google Scholar]
- Ackermann, M., Ajello, M., Albert, A., et al. 2012, ApJS, 203, 4 [NASA ADS] [CrossRef] [Google Scholar]
- Ackermann, M., Ajello, M., Allafort, A., et al. 2013, Science, 339, 807 (A13) [NASA ADS] [CrossRef] [PubMed] [Google Scholar]
- Aharonian, F. A. 2001, A&A, 370, 112 [NASA ADS] [CrossRef] [EDP Sciences] [Google Scholar]
- Aharonian, F. A. 2004, Very High Energy Cosmic Gamma Radiation: a Crucial Window on the Extreme Universe (World Scientific Publishing) [Google Scholar]
- Aharonian, F. 2012, Astropart. Phys., 43, 71 [Google Scholar]
- Aharonian, F., Akhperjanian, A., Bazer-Bachi, A., et al. 2007, A&A, 464, 235 [Google Scholar]
- Aharonian, F., Akhperjanian, A., Bazer-Bachi, A., et al. 2008, A&A, 481, 401 [NASA ADS] [CrossRef] [EDP Sciences] [MathSciNet] [PubMed] [Google Scholar]
- Aleksic, J., Alvarez, E., Antonelli, L., et al. 2012, A&A, 541, A13 [Google Scholar]
- Bell, A. R. 1978a, MNRAS, 182, 147 [NASA ADS] [CrossRef] [Google Scholar]
- Bell, A. R. 1978b, MNRAS, 182, 443 [NASA ADS] [CrossRef] [Google Scholar]
- Bell, A. R. 1987, MNRAS, 225, 615 [NASA ADS] [Google Scholar]
- Bell, A. R. 2001, MNRAS, 321, 433 [NASA ADS] [CrossRef] [Google Scholar]
- Berezhko, E. G., & Voelk, H. J. 2007, ApJ, 661, L175 [NASA ADS] [CrossRef] [Google Scholar]
- Berezinskii, V. S., Bulanov, S. V., Dogiel, V. A., Ginzburg, V. L., & Ptuskin, V. S. 1990, Astrophysics of Cosmic Rays, ed. V. L. Ginzburg (Amsterdam: North-Holland) [Google Scholar]
- Blasi, P. 2012, ApJ, 755, 121 [NASA ADS] [CrossRef] [Google Scholar]
- Blasi, P., & Amato, E. 2012, JCAP, 01, 10 [Google Scholar]
- Blasi, P., Gabici, S., & Vannoni, G. 2005, MNRAS, 361, 907 [NASA ADS] [CrossRef] [Google Scholar]
- Blumenthal, G. R., & Gould, R. J. 1970, Rev. Mod. Phys., 42 [Google Scholar]
- Bulgarelli, A., Chen, A. W., Tavani, M. V., et al. 2012, A&A, 540, A79 [NASA ADS] [CrossRef] [EDP Sciences] [Google Scholar]
- Butt, Y. M. 2009, Nature, 460, 701 [NASA ADS] [CrossRef] [PubMed] [Google Scholar]
- Castelletti, G., Dubner, G., Brogan, C., & Kassim, N. E. 2007, A&A, 471, 537 [NASA ADS] [CrossRef] [EDP Sciences] [Google Scholar]
- Castelletti, G. G., Dubner, C. T., & Kassim, N. E. 2011, A&A, 534, A21 [NASA ADS] [CrossRef] [EDP Sciences] [Google Scholar]
- Chen, A. W., Argan, A., Bulgarelli, A., et al. 2013, A&A, 558, A37 [NASA ADS] [CrossRef] [EDP Sciences] [Google Scholar]
- Clark, D. H., & Caswell, J. L. 1976, MNRAS, 174, 267 [NASA ADS] [CrossRef] [Google Scholar]
- Claussen, M. J. 1999, ApJ, 522, 349 [NASA ADS] [CrossRef] [Google Scholar]
- Claussen, M. J., Frail, D. A., & Goss, W. M. 1997, ApJ, 489, 143 [NASA ADS] [CrossRef] [Google Scholar]
- Dermer, C. D. 1986, A&A, 157, 223 [NASA ADS] [Google Scholar]
- Dermer, C. D. 2012, Phys. Rev. Lett., 109, 091101 [NASA ADS] [CrossRef] [PubMed] [Google Scholar]
- Dermer, C. D., Strong, A. W., Orlando, E., & Tibaldo, L. 2013, ICRC [arXiv:1307.0497] [Google Scholar]
- Fang, J., Yu, H., Zhu, B., & Zhang, L., et al. 2013, MNRAS, 435, 570 [NASA ADS] [CrossRef] [Google Scholar]
- Fermi, E. 1949, Phys. Rev., 75, 1169 [NASA ADS] [CrossRef] [Google Scholar]
- Frail, D. A., Giacani, E. B., Goss, W. M., & Dubner, G. 1996, ApJ, 464, 165 [Google Scholar]
- Fukui, Y., Sano, H., Sato, J., et al. 2012, ApJ, 746, 82 [NASA ADS] [CrossRef] [Google Scholar]
- Gabici, S., Aharonian, F. A., & Blasi, P. 2007, Astrophys. Space Sci., 309, 365 [Google Scholar]
- Gabici, S., Aharonian, F., & Casanova, S. 2009, MNRAS, 396, 1629 [NASA ADS] [CrossRef] [Google Scholar]
- Giacani, E. B., Dubner, G., Kassim, N. E., et al. 1997, AJ, 113, 1379 [NASA ADS] [CrossRef] [Google Scholar]
- Ginzburg, V. L., & Syrovatskii, S. I. 1964, The Origin of Cosmic Rays (New York: Macmillan) [Google Scholar]
- Giordano, F., Naumann-Godo, M., Ballet, K., et al. 2012, ApJ, 744, 2 [Google Scholar]
- Giuliani, A., Chen, A., Mereghetti, S., et al. 2004, Mem. Soc. Astron. It. Suppl., 5, 135 [Google Scholar]
- Giuliani, A., Cocco, V., Mereghetti, S., et al. 2006, Nucl. Instrum. Methods Phys. Res. A, 568, 692 [Google Scholar]
- Giuliani, A., Tavani, M., Bulgarelli, A., et al. 2010, A&A, 516, L11 [Google Scholar]
- Giuliani, A., Cardillo, M., Tavani, M., et al. 2011, ApJ, 742, 30 (G11) [Google Scholar]
- Gomez, H. L. 2012, MNRAS, 420, 3557 [NASA ADS] [CrossRef] [Google Scholar]
- Helder, E. A., Vink, J., Bykov, A. M., et al. 2012, Space Sci. Rev., 173, 369 [NASA ADS] [CrossRef] [Google Scholar]
- Hewitt, J. W., Acero, E., Brandt, T. J., et al. 2012, ApJ, 759, 89 [NASA ADS] [CrossRef] [Google Scholar]
- Hoffman, M., Goss, W. M., Brogan, C. L., & Claussen, M. J. 2005, AJ, 620, 257 [Google Scholar]
- Hunter, S. D., Bertsch, D. L., Catelli, J. R., et al. 1997, ApJ, 481, 205 [NASA ADS] [CrossRef] [Google Scholar]
- Hwang, U., & Laming, J. M. 2012, ApJ, 746, 130 [NASA ADS] [CrossRef] [Google Scholar]
- Inoue, T., Yamakazi, R., & Inutsuka, S. 2012, ApJ, 744, 71 [NASA ADS] [CrossRef] [Google Scholar]
- Katsuta, J. 2012, ApJ, 752, 135 [NASA ADS] [CrossRef] [Google Scholar]
- Kelner, S. R., Aharonian, F. A., & Bugayov, V. V. 2006, Phys. Rev. D, 74, 4018 [Google Scholar]
- Koo, B., Heiles, C., Stanimirovic, S., & Troland, T. 2010, AJ, 140, 262 [NASA ADS] [CrossRef] [Google Scholar]
- Lemoine-Goumard, M., Renaud, M., Vink, J., et al. 2012, A&A, 545, A28 [NASA ADS] [CrossRef] [EDP Sciences] [Google Scholar]
- Longair, M. 2011, High Energy Astrophysics 3rd edn. (Cambridge University Press) [Google Scholar]
- Malkov, M. A., & Drury, O. 2001, Rep. Prog. Phys., 64, 429 [NASA ADS] [CrossRef] [Google Scholar]
- Malkov, M. A., Diamond, P. H., & Sagdeev, R. Z. 2011, NatCo, 2, 194 [Google Scholar]
- Mori, M. 1997, ApJ, 478, 225 [NASA ADS] [CrossRef] [Google Scholar]
- Morlino, G., & Caprioli, D. 2012, A&A, 538, A81 [NASA ADS] [CrossRef] [EDP Sciences] [Google Scholar]
- Onic, D. 2013, Ap&SS, 346, 3 [NASA ADS] [CrossRef] [Google Scholar]
- Picozza, P., Galper, A. M., Castellini, G., et al. 2007, Proc. ICRC [Google Scholar]
- Reach, W. T., Rho, J., & Jarret, T. H. 2005, AJ, 618, 297 [Google Scholar]
- Rho, J., Petre, L., Schlegel, E. M., & Hester, J. J. 1994, AJ, 430, 757 [Google Scholar]
- Schure, K. M., Bell, A. R., O’C. Drury, L., & Bykov, A. M. 2012, Space Sci. Rev., 173, 491 [NASA ADS] [CrossRef] [EDP Sciences] [Google Scholar]
- Shelton, R. L., Kuntz, K. D., & Petre, R. 2004, ApJ, 611, 906 [NASA ADS] [CrossRef] [Google Scholar]
- Simpson, J. A. 1983, Ann. Rev. Nucl. Part. Sci., 33, 323 [Google Scholar]
- Skilling, J., & Jones, A. W. 1976, A&A, 53, 253 [NASA ADS] [Google Scholar]
- Strong, A. W., Moskalenko, I. V., Reimer, O., et al. 2004, A&A, 422, 47 [Google Scholar]
- Strong, A. W., Orlando, E., & Jaffe, T. R. 2011, A&A, 534, A54 [NASA ADS] [CrossRef] [EDP Sciences] [Google Scholar]
- Tavani, M., Barbiellini, G., Argan, A., et al. 2009, A&A, 502, 995 [NASA ADS] [CrossRef] [EDP Sciences] [Google Scholar]
- Tavani, M., Giuliani, A., Chen, A. W., et al. 2010, ApJ, 710, 151 [Google Scholar]
- Taylor, J. R. 2000, An Introduction to Error Analysis: The Study of Uncertainties in Physical Measurements (University Science Books) [Google Scholar]
- Torres, D. F., Romero, G. E., Dame, T. M., et al. 2003, Phys. Rep., 382, 303 [NASA ADS] [CrossRef] [Google Scholar]
- Uchiyama, Y., Funk, S., Katagiri, H., et al. 2012, ApJ, 749, 35 [Google Scholar]
- Vercellone, S., Chen, A. W., Giuliani, A., et al. 2008, ApJ, 676, L13 [NASA ADS] [CrossRef] [Google Scholar]
- Vercellone, S., Chen, A. W., Vittorini, V., et al. 2009, ApJ, 690, 1018 [NASA ADS] [CrossRef] [Google Scholar]
- Vink, Y. 2012, A&AR, 20, 49 [Google Scholar]
- Watson, M. G., Willingale, R., Pye, J. P., et al. 1983, Supernova remnants and their X-ray emission, Proc. Symp. (Dordrecht: D. Reidel Publishing Co), 101, 273 [Google Scholar]
- Wolszczan, A., Cordes, J. M., & Dewey, R. J. 1991, AJ, 372, L99 [Google Scholar]
- Wootten, H. A. 1977, ApJ, 216, 440 [NASA ADS] [CrossRef] [Google Scholar]
- Yoshiike, S. 2013, ApJ, 768, 179 [Google Scholar]
All Tables
All Figures
|
Fig. 1 AGILE new gamma-ray spectrum of SNR W44 (red data points) superimposed with the Fermi-LAT data from Ackermann et al. (2013) (blue data points). |
| In the text | |
|
Fig. 2 Upper left panel: AGILE gamma-ray intensity map (in Galactic coordinates) of the W44 region in the energy range 400 MeV–10 GeV, which is obtained by integrating all available data collected during the period from May 2007 to June 2012. The pixel size is 0.05° × 0.05° with a 3-bin Gaussian smoothing. Green contours show the 324 MHz radio continuum flux density detected by the very large array (Castelletti et al. 2007) and red circles indicate detected OH masers (Claussen et al. 1997). Upper right panel: combined CO data from the NANTEN2 observatory that is superimposed with the AGILE gamma-ray data contours (magenta) above 400 MeV of the W44 region (map in Galactic coordinates) and VLA contours (white). The CO data have been selected in the velocity range 40–43 km s-1, corresponding to a kinematic distance compatible with the W44 distance. Middle left and right panels: NANTEN2 CO integrated maps with CO contours (40–43 km s-1). Thick white lines show the four CO peaks. Bottom left panel: NANTEN2 CO integrated contours (40–43 km s-1, cyan) and VLA contours (green). Bottom right panel: AGILE intensity map (400 MeV–10 GeV) with NANTEN2 (cyan) and VLA (green) contours. |
| In the text | |
|
Fig. 3 Particle total energy distributions for our best hadronic models vs. the kinetic energy: a simple power-law with a high-energy cut-off at Ec = 45 GeV (Eq. (1), red), a smoothed broken power law with Ebr = 16 GeV (Eq. (2), green), and broken power law with Ebr = 20 GeV (Eq. (3), blue). |
| In the text | |
|
Fig. 4 Our best hadronic model, H3, of the broadband spectrum of the SNR W44 superimposed
with radio (data points in green color) and gamma-ray data of Fig. 1 (in blue and cyan color). Proton distribution in
Eq. (3) with index p1 = 2.2 ±
0.1 (for E < Ebr)
and p2 = 3.2
± 0.1 (for E>Ebr)
where |
| In the text | |
|
Fig. 5 Photon spectra obtained from the two leptonic-only models, L1 (green) and L2
(black), based on a broken power-law electron distribution. The density is fixed at
n =
300 cm-3. In the model L1 the electron index is fixed at
|
| In the text | |
|
Fig. 6 Top panel: AGILE (red) and Fermi-LAT (green) old spectral energy distribution (SED) of W44 (Giuliani et al. 2011; Abdo et al. 2010e), with the new Fermi-LAT (magenta, Ackermann et al. 2013). The new AGILE data are shown in blue in Fig. 1. Bottom panel: Fermi-LAT new (magenta, Ackermann et al. 2013) and old (green, Abdo et al. 2010e) spectral energy distributions. We note that there is a substantial difference at low-energies between the two data sets. |
| In the text | |
|
Fig. 7 Hadronic model H1 of the gamma-ray spectrum of W44 superimposed with the gamma-ray
data of Fig. 1 (in blue and cyan colors). We find
an index p1 =
2.0 ± 0.1 with a high-energy cut-off at
|
| In the text | |
|
Fig. 8 Hadronic model H2 of the gamma-ray spectrum of W44 superimposed with the gamma-ray
data of Fig. 1 (in blue and cyan colors). We find
an index p1 =
1.74.0 ± 0.1 (for E < Ebr),
and p2 = 3.5 ±
0.1 (for E>Ebr)
where |
| In the text | |
|
Fig. 9 Hadronic model H4 of the gamma-ray spectrum of W44 that is superimposed with the
gamma-ray data of Fig. 1 (in blue and cyan
colors). We find an index p1 = 3.2 ± 0.1 with a low-energy
cut-off at |
| In the text | |
|
Fig. 10 Gamma-ray emission from neutral pion decay calculated for different simple power-law proton distributions of different spectral indices without any break or cut-off. We show the cases for p1 = 1.74 (red), p1 = 2 (green), p1 = 2.3 (black), p1 = 2.5 (magenta), p1 = 2.7 (cyan), and p1 = 3 (yellow). |
| In the text | |
|
Fig. 11 Top panel: our best hadronic model H3 (see Fig. 4) for three different values of the target density; n = 300, 1000, and 2000 cm-3. Bottom panel: correlation between the magnetic field and the electron/proton ratio to fit the spectral gamma-ray data of W44 for the three assumed target densities. |
| In the text | |
Current usage metrics show cumulative count of Article Views (full-text article views including HTML views, PDF and ePub downloads, according to the available data) and Abstracts Views on Vision4Press platform.
Data correspond to usage on the plateform after 2015. The current usage metrics is available 48-96 hours after online publication and is updated daily on week days.
Initial download of the metrics may take a while.